Forty-eight Years (1969–2016) of Climatological Data:
NMSU Agricultural Science Center at Farmington, New Mexico
BL-809
M.K. O’Neill, D. Smeal, M.M. West, S.C. Allen, and K. Djaman
College of Agricultural, Consumer and Environmental Sciences
Authors: Respectively, Professor (retired), Department of Plant and Environmental Sciences (PES); College Professor (retired), PES; Agricultural Research Scientist, Agricultural Science Center at Farmington (ASCF); Agricultural Research Scientist, ASCF; and Assistant Professor, ASCF, New Mexico State University. (Print friendly PDF)
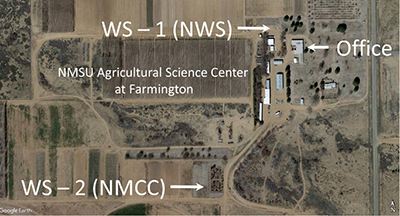
Figure 1. Satellite view showing locations of the two weather stations at the NMSU Agricultural Science Center at Farmington (Google Earth, 2015).
Plant growth and crop production are intrinsically linked to climate and daily weather conditions. Climate determines the types of plants that can be grown in a particular area and the management techniques required for successful landscapes and agricultural sustainability. Weather affects crop water requirements; the timing of planting, cultivation, fertilization, and harvest; crop tolerance to diseases and pests; total crop yield; and product quality. Agricultural and landscape planning begins with a thorough understanding of a locale’s climate. To help provide this understanding for the Four Corners region, daily weather observations have been made since 1969 at the New Mexico State University (NMSU) Agricultural Science Center at Farmington (ASCF). ASCF is located in northwestern New Mexico (36°4’ N lat., 108°2’ W long.) about seven miles southwest of Farmington at an elevation of 5,640 feet above mean sea level. Two weather data recording stations are located at ASCF (Figure 1). Station 1 (WS-1) was established on bare soil about 150 feet west-northwest of the ASCF office building in January 1969 and was given an official designation by the National Weather Service (NWS) in 1978. Station 2 (WS-2) was installed in an alfalfa-grass field approximately 400 yards south of WS-1 in 1985 (Figure 1). This is an automated, computer-linked station that is operated and maintained by the New Mexico Climate Center (NMCC) at NMSU in Las Cruces. This report summarizes weather observations from these stations from 1969 through 2016.
Summary
ASCF is located near the geographic center of the Southwest Climate Region of the U.S. (National Centers for Environmental Information, 2017) in United States Department of Agriculture (USDA) plant hardiness zone 7a (USDA–ARS, 2017; PlantMaps, 2017), while the Sunset Western Garden Collection (2017) includes ASCF in Climate Zone 3A and the American Horticultural Society (2017) has ASCF in Heat Zone 7. Compared to the mountainous areas that surround it, the climate at ASCF is relatively dry and mild. Summer days of June and July are typically warm (avg. 90–92°F) and dry, while nights are cool (avg. 56–62°F). During the winter months of December and January, air temperatures commonly fall below 20°F in the early morning, while daytime highs typically average between 37 and 46°F. The frost-free period averages 163 days from mid-April to early November, but crops such as potatoes, corn, spring cereals, etc. are frequently planted before May 1. Throughout the year, days are typically clear and sunny. When precipitation events occur, they are usually of short duration and deposit less than 0.10 inch of rain per event. During the winter, snows are infrequent, and accumulated snow depths greater than a few inches are rare. Total annual precipitation averages slightly more than 8 inches, with about half of the total occurring in the four-month period of July–October. Twenty-four-hour precipitation depths exceeding one inch have occurred 17 times during the entire 48 years of record. Compared to southern and eastern New Mexico, winds are relatively calm during the summer and winter, averaging 103 miles per day (MPD) (4.3 miles per hour [MPH]) between July and January. From February through May, strong westerly winds are common, and average wind velocity increases to about 134 MPD (5.6 MPH).
Materials and Methods
Weather Station 1
WS-1 (Figure 2) air temperature measurements were recorded from standard U.S. Weather Bureau maximum (mercury) and minimum (alcohol) thermometers housed in a regulation, wooden, louvered instrument shelter until March 2005. From March 2005 onward, air temperatures have been recorded with a Nimbus PL digital-style thermometer housed in a plastic, cylindrical, stacked-plate radiation shield. A standard 8-inch-diameter rain gauge has been used since January 1969 to measure total daily precipitation. A battery-operated, constant-reading rain gauge was installed in 1982 to measure precipitation rate. Wind movement in miles per day has been recorded at two heights since 1980 using standard three-cup anemometers. One is located 6 inches above a standard Class-A metal evaporation pan, while the other is set at a height of 6 feet above the soil surface.
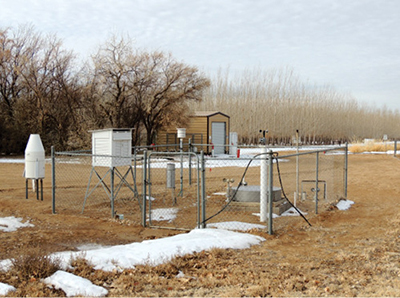
Figure 2. Southwest view of the NWS weather station (WS-1) at the NMSU Agricultural Science Center at Farmington, NM, in January 2013.
Water evaporation from a Class-A pan (PAN) was measured daily with a hook gauge from May 1 through September 30 in all years from 1974 to 2016. PAN measurements were also recorded for most days in April from 1977 to 1981, 1984 to 1986, and 1989 to 2016. October measurements were recorded in 1972, 1974 to 1979, 1981, 1984, 1985, 1987, 1988, and 1990 to 2016.
Maximum and minimum bare-soil temperatures at a depth of 4 inches have been recorded since 1976 using buried temperature sensors. The soil type is a Doak fine sandy loam with about 70% sand, 20% silt, and 10% clay.
From January 1977 to September 1996, global (direct and diffuse) solar radiation was measured with a star pyranometer set at a height of 6.5 feet near the WS-1 instrument shelter. Subsequent measurements were made with a LI-COR pyranometer set at a 10-foot height at WS-2.
Relative humidity (RH) data were recorded from 1980 to 1989 with hygrothermographs set in the WS-1 instrument shelter. From 1990 to 2016, RH was monitored with temperature/RH probes housed in a plastic, cylindrical, louvered shelter 6 feet above the ground at WS-2.
Data recorded at WS-1 are summarized on the Western Regional Climate Center website (http://www.wrcc.dri.edu/cgi-bin/cliMAIN.pl?nm3142) and the ASCF website (http://farmingtonsc.nmsu.edu/weather-daily-data.html).
Weather Station 2
The NMCC weather station (Figure 3) consisted of air temperature, RH, solar radiation, wind speed, wind direction, soil temperature, and rain depth sensors wired to a Campbell Scientific CR10 data logger until 2015. In June 2015, a newer Campbell Scientific CR1000 data logger was installed for all sensors. The data logger, powered by a 12-volt, deep-cycle, lead-acid battery, and all sensors were mounted to a 10-foot-high steel and aluminum tripod. A solar panel provided recharge to the battery. Measurements were recorded to the data logger every hour, and the data were downloaded to a PC at the NMCC via modem and telephone line until 2015, when data began wireless transmission to an on-site network computer system. PAN measurements were also taken from a standard Class-A evaporation pan installed at WS-2 from 1985 through 1994. All data except PAN from WS-2 are accessible from the NMCC website (http://weather.nmsu.edu).
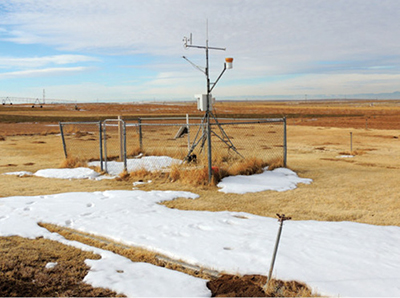
Figure 3. Southwest view of the NMCC weather station (WS-2) at the NMSU Agricultural Science Center at Farmington, NM, in January 2013.
Data Adjustment
From January 1, 1969, to March 31, 1980, weather data from WS-1 were recorded at 4:30 p.m. Mountain Time (MT). From April 1, 1980, onward, WS-1 data were recorded at 8:00 a.m. MT. In preparing this report, various assumptions (and data adjustments) were made based on these recording times. When recording occurred at 4:30 p.m., it was assumed that both minimum and maximum temperature and RH occurred on the day of record. Likewise, PAN, solar radiation (when recorded at WS-1), and wind run are also reported as occurring on the day of record even though a significant portion of the 24-hour totals for these parameters could have occurred the previous day between 4:30 p.m. and midnight.
When data were recorded at 8:00 a.m., it was assumed that minimum temperature and maximum RH occurred on the day of record (i.e., after midnight). It was assumed that maximum temperature, minimum RH, total solar radiation, and total wind run occurred on the previous day, and the records in this report for WS-1 reflect these assumptions. Data recorded from WS-2 reflect parameter summaries or totals from midnight to midnight and did not require adjustments.
Only temperature and precipitation measurements were made every day for the entire 48-year period, at WS-1. The other parameters were measured for either a portion of this time span (e.g., wind, solar radiation) or for selected days during the year (e.g., PAN evaporation). Monthly averages shown in the summary tables in this report represent means of all reliable values recorded for each day within a month. Monthly means are not shown for months in which reliable daily measurements were not recorded or were missing due to instrument malfunctions, etc.
In the original data records for WS-1, PAN measurements were entered as differences in hook gauge readings from one day to the next, without adjustments for precipitation. In this report, PAN data reflect hook gauge reading differences plus adjustments for precipitation that occurred between readings.
Results
Daily Averages
Temperature and Precipitation
Tables 1 through 12 summarize average and extreme air temperatures (highest and lowest) and maximum precipitation depth recorded for each day of each month at WS-1 from 1969 through 2016. The number of years in which measurable (at least 0.01 inch) precipitation was recorded for each day during the 48-year period is also shown, as well as the total cumulative depth for that day over the period. These records provide a base of reference for determining how subsequent daily temperature or precipitation measurements compare to averages or extremes for the previous 48-year period (i.e., new records, etc.). Average daily high temperatures ranged from 41°F in January and 42°F in December to 91°F in July (Table 19 and Figure 4). The highest temperature recorded at WS-1 over the 48-year period was 103°F and occurred on the dates of June 30, 1990 (Table 6); July 6, 1989; July 15, 2003; and July 21, 2005 (Table 7). A few notable periods with consecutive record-breaking high temperatures occurred from July 9 to July 26 in both 2003 and 2005 (Table 7). The lowest temperature of -18°F was recorded on January 7, 1971 (Table 1). Notable cold periods with subzero temperatures occurred from January 5 to 9, 1971 (Table 1); February 6 to 7, 1989 (Table 2); December 7 to 11, 1978 (Table 12); and December 23 to 27, 1990 (Table 12).
The highest 24-hour precipitation accumulation of 1.93 inches was recorded on September 6, 1970 (Table 9). Daily precipitation of greater than 1 inch was recorded on only 16 other dates during the entire 48-year period. Notable multi-day periods of significant precipitation occurred April 3 to 4, 1997 (1.88 inches), and July 19 to 22, 1986 (2.66 inches). The two wettest days of the year, raining on the date 17 times (35% of the 48 years), were August 20 with a cumulative total depth of 4.11 inches (Table 8) and September 12 with a cumulative total depth of 4.10 inches (Table 9). August 23 has the greatest cumulative (48-year) total of 4.37 inches over 15 rainfall events (Table 8). Precipitation has not occurred on the leap year date of February 29 (Table 2) or on May 30 (Table 5).
Wind Run
Tables 13a and 13b display the average and maximum recorded 24-hour wind run and the calculated average miles per hour (avg. 24-hour wind run / 24) measured at a height of 6 feet from 1980 to 2016 at WS-1. High average wind runs in excess of 160 MPD (6.7 MPH) have occurred on March 17, March 26, April 2, April 18, and April 25 (Table 13a). September had the lowest average wind run with 99 MPD and 4.1 MPH (Table 13b). From 1985 to 2011, daily wind speed recorded at a height of 6 feet at WS-1 averaged 80% of that recorded at a height of 10 feet at WS-2 (Figure 5). While part of the difference can be attributed to the logarithmic wind speed profile (i.e., inherent wind speed differences with height), prevailing south and southwest winds are partially blocked by trees and other obstructions near WS-1 (Figures 1 and 2), whereas WS-2 has a south and southwest fetch of several hundred yards (Figures 1 and 3).
Relative Humidity
In simple terms, RH refers to the ratio of the amount of water vapor in the air compared to the amount of water vapor that would result in saturation of that air at the same temperature and pressure expressed as a percentage. At 100% RH, the air is saturated and water condenses (changes from a vapor to liquid). Average daily RH from 1980 through 2016 ranged from 33% in June to 63% in December (Tables 14a and 14b). The average daily maximum RH usually occurred in the early morning and exceeded 85% for most days in December and January, but averaged less than 53% in mid-June. The average daily minimum RH generally occurred during the warmest part of the day in mid-afternoon and was less than 16% for all days in June (Table 14a). Highest average minimum daily RH of greater than 40% occurred on most days in December (Table 14b) and January (Table 14a).
Solar Radiation
Solar radiation was measured in Langleys per day. A Langley (Ly) is a unit of energy equal to 1 calorie per square centimeter (cal/cm2), and 1 Ly/day is equal to 0.1536 BTU/ft2/hour (USDA–NRCS, 2017a). The average number of Ly/day ranged from 182 on December 21 to 693 on June 22 (Table 15). Since skies are generally clear most days of the year in northwestern New Mexico, these two dates correspond with the dates of winter and summer solstices (December 20–21 and June 20–21, respectively). Solar radiation at the equinoxes (March 20–21 and September 22–23) averaged about 437 Ly/day (Table 15). Total solar radiation per month ranged from a low of 6,333 Ly in December (mean = 204 Ly/day) to 19,651 Ly in June (mean = 655 Ly/day; Table 15 and Figure 6). Total Langleys per year averaged 13,100.
PAN Evaporation
Evaporation is affected by temperature, wind speed, relative humidity, and solar radiation. With appropriate correction factors, it is sometimes used as an index of plant water use. Average daily PAN at WS-1 between April 1 and October 31 from 1972 to 2016 ranged from less than 0.20 inch/day in late October to greater than 0.45 inch/day from mid-June to mid-July (Table 16). The greatest average (44-year) daily PAN of 0.50 inch/day occurred on June 22. Average PAN per month ranged from 5.09 inches in October to 12.97 inches in June and totaled 68.59 inches from April through October. Despite the higher average wind speed at WS-2, PAN measurements taken from the WS-1 pan, which was situated over bare soil, averaged 18% greater (from 1985 to 1994) than PAN measurements taken from the pan situated over vegetation (alfalfa or grass) at WS-2 (Figure 7).
Soil Temperature
Since seeds require a minimum soil temperature for successful germination, soil temperature (ST) is an important factor to consider when determining when to plant agronomic and horticultural crops. While seeds of small grain crops such as wheat and barley and cool-season vegetables such as spinach, radishes, and peas may germinate at ST of less than 45°F, crops such as corn, melons, squash, dry beans, and chile germinate best at ST above 55 or 65°F (Flynn et al., 2002; Pathak et al., 2012). Sixteen-year average maximum daily ST at 4 inches deep reached 66°F at WS-1 during the third week in April, and the average minimum nighttime ST stayed consistently above 60°F after May 15 (Table 17a).
Average mean daily ST of 87°F was consistently exceeded from the end of the second week in July to the fourth week of July, while average maximum daytime ST was greater than 96°F during this same time period (Table 17b). In the fall, average maximum daily ST dropped below 65°F by about mid-October and was at 32°F or below from December 26 to January 23 (Tables 17a
and 17b).
To evaluate the effects of vegetative cover on ST, average daily ST calculated at WS-1 from 2001 to 2016 was compared to that calculated at WS-2 for the same time period. Average daily ST at WS-1 (bare soil) was greater than that at WS-2 (vegetative cover) from about mid-March through mid-October and less than that at WS-2 from about mid-November through mid-February (Figure 8). Maximum average ST at WS-2 did not exceed 75°F during the summer and did not fall below 32°F in the winter (Figure 8).
Freeze-free Periods
The freeze-free period (consecutive days above 32°F) averaged 163 days over the 48 years (Table 18). The shortest freeze-free period of 115 days occurred in 1999, the only year in which a June freeze was recorded. The longest frost-free period of 193 days occurred in 1977. The average dates of the last spring freeze and first autumn freeze were May 5 and October 14, respectively. The earliest and latest dates of the last spring freeze were April 10, 1990, and June 5, 1999, respectively. The earliest and latest dates of the first fall freeze were September 18, 1971, and November 12, 1988, respectively (Table 18). The number of consecutive days without a killing freeze (28°F or less) averaged 184. A killing freeze results in substantial damage to most plants. A temperature of 28°F for more than 30 minutes, for example, will kill approximately 10% of apple or cherry blossoms during flowering (Longstroth, 2001).
Growing Degree Days
Growing degree days (GDD) or heat units are used to rate or predict the growth or development stage of plants or insects. Plant development is related to temperature, and each crop has an optimal temperature range for growth. That is, there is a minimum temperature below which plants will not grow (minimum cutoff or base temperature) and a maximum temperature at which plant growth rate will stabilize or decrease (maximum cutoff temperature). The average daily temperature (mean of daily minimum and maximum temperatures) minus the base temperature is equal to GDD for that day. However, if the observed minimum temperature for the day is less than the minimum cutoff temperature (COmin), then it is set equal to COmin. Correspondingly, if the observed maximum temperature exceeds the maximum cutoff temperature (COmax), then it is set equal to COmax, prior to calculating the average. In corn, the base temperature and COmin are 50°F and COmax is 86°F (Eckert, 2017). In alfalfa, the base temperature and COmin are 41°F and COmax is 110°F (Lee et al., 2010). Alfalfa and corn GDD (using 48-year average temperature data) began to accumulate in February and March, respectively (Figure 9), totaling about 5,600 for alfalfa and 3,600 for corn for the entire year. Usually, corn is not planted until about May 1, so the accumulation of 400 GDD between January 1 and May 1 should not be considered in the total for corn.
Reference Evapotranspiration
Evapotranspiration (ET) refers to the volume of water used by a crop during a given time period. It includes water that is actively transported through the plant from the roots to leaves during transpiration and water that is lost from plant and soil surfaces through evaporation. If crops are healthy and soil moisture is not limiting, plant size and weather (solar radiation, air temperature, humidity, and wind speed) are the primary factors affecting crop ET (Allen et al., 1998). Reference ET (ETos or ETrs, for example) refers to the ET of a reference crop such as grass (ETos) or alfalfa (ETrs) that is of a certain height and is growing under optimal conditions for maximum production. Since measured reference ET has been correlated with measurements of the weather parameters referred to above, it can be calculated when these parameters are available. Correction values or crop coefficients (Kc), if available, can be applied to reference ET to estimate a particular crop’s actual ET rate or water requirement throughout the growing season. These estimates can be used in irrigation scheduling.
An Excel spreadsheet developed by Snyder and Eching (2007) was used to calculate standardized grass (ETos) and alfalfa (ETrs) reference ET with inputs of daily average air temperature (recorded from WS-1) and SR, RH, and wind (recorded from WS-2) from 1985 through 2016. Both ETos and ETrs were less than 0.10 inch/day in January and December (Figure 10). At about the beginning of the growing season (May 1–10), ETos ranged from 0.20 to 0.25 inch/day and ETrs ranged from 0.30 to 0.35 inch/day. Peak ETos and ETrs occurred from June 26 to July 5 and averaged 0.30 and 0.41 inch/day, respectively (Figure 10). Cumulative annual reference ET averaged 60 inches for ETos and 84 inches for ETrs.
Monthly and Yearly Averages
Temperature
The coldest month of the year has been January, with average daily maximum, mean, and minimum temperatures of 41.1°F, 30.1°F, and 19.1°F, respectively (Tables 19, 20, and 21). The warmest month has been July, with average daily maximum, mean, and minimum air temperatures of 90.9°F, 75.7°F, and 60.5°F, respectively. The average daily maximum, mean, and minimum annual temperatures were 66.4°F, 52.7°F, and 38.9°F, respectively (Tables 19, 20, and 21). The warmest year on record was 2003, when the average daily maximum and mean were 69.2°F and 54.7°F, respectively (Tables 19 and 20, Figure 11). There was a statistically significant linear trend of increasing average annual maximum, mean, and minimum temperatures from 1969 to 2016 of 0.0384°F/yr, 0.0382°F/yr, and 0.0385°F/yr, respectively (Figure 11 and Table 29). This translates into an increase in temperature of 1.8°F over the 48-year period being reported, higher than the 1.5°F increase in global temperatures reported by the National Oceanic and Atmospheric Administration (NOAA) over the past five decades (Dahlman, 2017) and 140% greater than the global temperature increase of 1.8°F over the last 115 years (1901–2016) (U.S. Global Change Research Program, 2017). Increased annual mean temperature has regional ramifications on snow pack in the San Juan Mountains. Since 1979, snowpack water equivalence has decreased 2 inches per year, resulting in an 80-inch decrease over the 38-year period through 2016 (USDA–NRCS, 2017b). Snow melt from the San Juan Mountains is the source for most irrigation, municipal, industrial, and domestic water across the four states in the Four Corners region. San Juan Mountain snowpack is the principal source of water not only in the Four Corners region but also in downstream states that rely on this water as a significant contributor since 60% of the surface water passing through New Mexico is from the San Juan River Basin.
Precipitation
Total monthly precipitation averaged slightly over 1 inch in August and September, the two wettest months of the year, to less than 0.26 inch in June, the driest month of the year (Table 24). Average annual precipitation was 8.04 inches, and ranged from a high of 14.58 inches in 1986 to a low of 3.57 inches in 1976 (Table 24). Accurate and regular snowfall measurements did not appear to be taken prior to 1987. From 1987 through 2016, the greatest total monthly snow depths of 19.0 inches (two events at 9.5 inches average per event) and 21.3 inches (5 events at 4.3 inches average per event) occurred in December and February, respectively, during 1987 (Table 25). December has a slightly higher average measurable snow frequency (3.3 days/month) than January or February. February has the highest average total depth of snow at 4.0 inches (Table 25).
Evaporation and Reference Evapotranspiration
Total monthly ETos during the growing season months averaged 5.9 inches in April to 4.0 inches in October (Figure 12). Average monthly ETrs and PAN had a similar distribution, with ETrs ranging from 8.4 inches to 5.8 inches in April through October and PAN ranging from 8.6 inches in April to 5.8 inches in October (Figure 12 and Table 26).
Growing Degree Days
Total monthly growing degree day accumulations were calculated for corn with a base temperature of 50°F and a maximum temperature of 86°F, while the base temperature for alfalfa was 41°F and the maximum temperature was 110°F. Cumulated growing degree days (CGDD) averaged 255 for alfalfa in March. In April, CGDD were 239 for corn and 374 for alfalfa, and monthly CGDD peaked in July at 721 for corn and 1,075 for alfalfa. Total CGDD throughout the season (March–October) were 3,516 and 5,358 for corn and alfalfa, respectively (Figure 13).
Wind Run
Since 1980, wind run measured at a height of 6 feet has averaged 114 MPD (4.8 MPH), ranging from a low of 61 MPD (2.5 MPH) in 2015 to a high of 142 MPD (5.9 MPH) in 1990 and 1996 (Table 26). On a monthly basis, daily wind run has averaged from 148 MPD (6.1 MPH) in April (generally the windiest month) to 100 MPD (4.1 MPH) in the calmest months of August through October (Table 27).
Solar Radiation
From 1977 through 2016, daily solar radiation has averaged 429 Ly/day, ranging from a low of 347 Ly/day in 1979 to a high of 482 Ly/day in 2003 and 2008 (Table 28). Maximum solar radiation is during the summer months of June (650 Ly/day) and July (614 Ly/day), while the least amount of solar radiation is during December (205 Ly/day) and January (223 Ly/day).
Polynomial Regression Data Fit
To facilitate climatological modeling, polynomial regression (CoStat, 2008) was used to formulate the best line fits to daily data means shown in Figures 4 through 11 (Equations 1 through 16). Table 29 lists the coefficients that define these lines. Most equations were fitted to a fifth or sixth order polynomial equation. Annual maximum, mean, and minimum temperatures were fitted to a linear equation. Coefficients of determination ranged from a low of 0.142 for the line describing the trend of annual maximum temperatures to a high of 1.000 for the cumulative growing degree day equations.
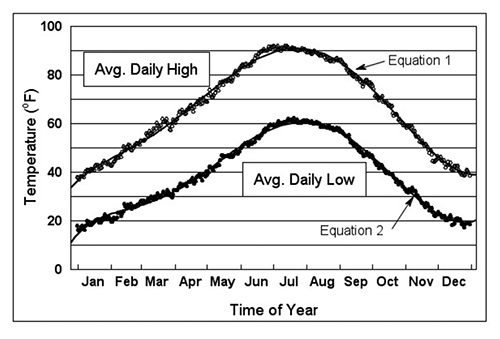
Figure 4. Average daily high and low temperatures at the NMSU Agricultural Science Center at Farmington, NM, 1969–2016. See Table 29 for coefficients of best line fit describing equations 1 and 2.
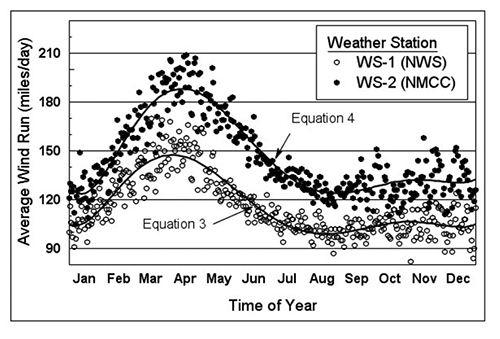
Figure 5. Average daily wind run measured at WS-1 and WS-2 at the NMSU Agricultural Science Center at Farmington, NM, 1980–2016. See Table 29 for coefficients of best line fit describing equations 3 and 4.
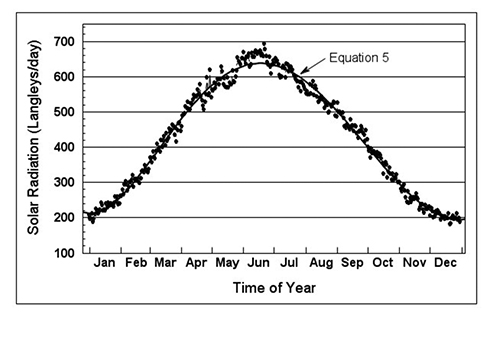
Figure 6. Average daily solar radiation at the NMSU Agricultural Science Center at Farmington, NM, 1972–2016. See Table 29 for coefficients of best line fit describing equation 5.
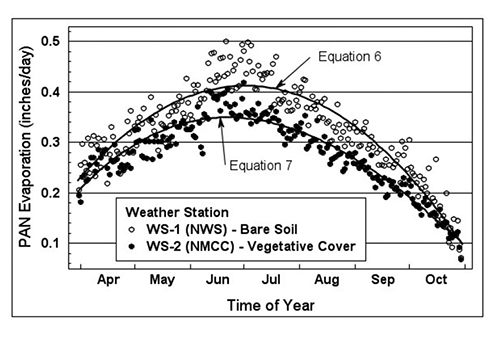
Figure 7. Average daily PAN evaporation measured at WS-1 and WS-2 at the NMSU Agricultural Science Center at Farmington, NM, 1985–1994. See Table 29 for coefficients of best line fit describing equations 6 and 7.
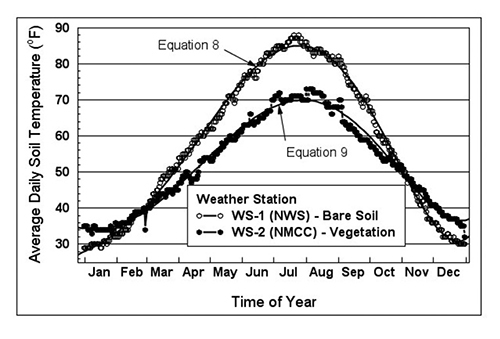
Figure 8. Average daily soil temperature measured at WS-1 and WS-2 at the NMSU Agricultural Science Center at Farmington, NM, 2001–2016. See Table 29 for coefficients of best line fit describing equations 8 and 9.
Figure 9. Cumulative average growing degree days for alfalfa and corn at the NMSU Agricultural Science Center at Farmington, NM, 1969–2016. See Table 29 for coefficients of best line fit describing equations 10 and 11.
Figure 10. Average daily reference ET at the NMSU Agricultural Science Center at Farmington, NM, 1985–2016. See Table 29 for coefficients of best line fit describing equations 12 and 13.
Figure 11. Average annual maximum, mean, and minimum air temperatures at the NMSU Agricultural Science Center at Farmington, NM, 1969–2016. See Table 29 for coefficients of best line fit describing equations 14, 15, and 16.
Figure 12. Average monthly grass reference ET (ETos), alfalfa reference ET (ETrs), and PAN evaporation at the NMSU Agricultural Science Center at Farmington, NM, 1985–2016.
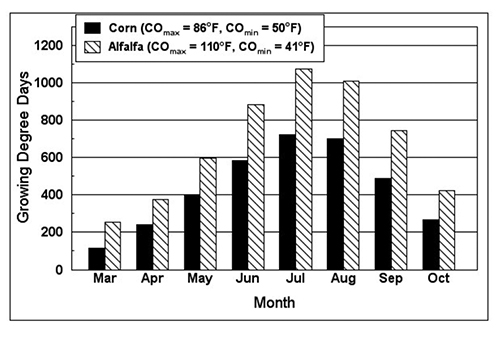
Figure 13. Average monthly growing degree days for corn and alfalfa at the NMSU Agricultural Science Center at Farmington, NM, 1969–2016.
|
Table 1. Average High and Low Temperature, High and Low Temperature Extremes and Year(s) of Occurrence, Highest Recorded Precipitation and Year(s) of Occurrence, and Number of Years Precipitation Occurred on each January Date at the NMSU Agricultural Science Center at Farmington, NM, 1969–2016 |
||||||||||
|
Date |
Air Temperature (°F) |
Precipitation (inches) |
||||||||
|
Avg. High |
Avg. Low |
Highest Record |
Year(s) of |
Lowest Record |
Year(s) of Lowest |
Highest |
Year(s) of Highest |
No. Years > 0* |
Total for |
|
|
1 Jan |
38 |
18 |
60 |
1981 |
-5 |
2011 |
0.30 |
1974 |
5 |
0.63 |
|
2 Jan |
38 |
16 |
57 |
2006 |
-4 |
1976 |
0.19 |
1974 |
8 |
0.68 |
|
3 Jan |
37 |
16 |
58 |
1997 |
-11 |
1974 |
0.26 |
2009 |
9 |
1.03 |
|
4 Jan |
38 |
17 |
56 |
1987 |
-9 |
1974 |
0.19 |
1991 |
8 |
0.81 |
|
5 Jan |
38 |
17 |
58 |
1994 |
-11 |
1971 |
0.35 |
1988 |
14 |
1.56 |
|
6 Jan |
38 |
18 |
55 |
2003 |
-13 |
1971 |
0.12 |
1993 |
10 |
0.64 |
|
7 Jan |
38 |
17 |
55 |
2006 |
-18 |
1971 |
0.45 |
1993 |
6 |
1.02 |
|
8 Jan |
39 |
16 |
53 |
2003 |
-8 |
1971 |
0.17 |
1993 |
8 |
0.77 |
|
9 Jan |
40 |
18 |
56 |
1996 |
1 |
1971 |
0.15 |
2001 |
6 |
0.39 |
|
10 Jan |
41 |
20 |
57 |
2005 |
-2 |
1977 |
0.29 |
2005 |
7 |
0.68 |
|
11 Jan |
41 |
19 |
56 |
2007 |
0 |
1977 |
0.07 |
1980 |
6 |
0.28 |
|
12 Jan |
41 |
20 |
56 |
1990 |
-3 |
1988 |
0.26 |
1979 |
6 |
0.71 |
|
13 Jan |
40 |
18 |
56 |
1986 |
0 |
1977 |
0.15 |
2015 |
7 |
0.42 |
|
14 Jan |
41 |
18 |
59 |
1980 |
1 |
1977 |
0.01 |
1980, 1993 |
2 |
0.02 |
|
15 Jan |
41 |
19 |
59 |
2000 |
-6 |
1997, 2013 |
0.29 |
1978 |
6 |
1.11 |
|
16 Jan |
41 |
19 |
66 |
2000 |
-6 |
1997, 2013 |
0.28 |
1993 |
6 |
0.67 |
|
17 Jan |
41 |
19 |
58 |
2000 |
-7 |
2008 |
0.41 |
1983 |
7 |
0.63 |
|
18 Jan |
42 |
20 |
61 |
2000 |
-2 |
2008 |
0.80 |
1993 |
7 |
1.76 |
|
19 Jan |
43 |
20 |
62 |
1999 |
-2 |
2008 |
0.18 |
2006 |
11 |
0.82 |
|
20 Jan |
43 |
20 |
64 |
1986 |
3 |
1997 |
0.78 |
1980 |
11 |
1.48 |
|
21 Jan |
42 |
21 |
57 |
2000 |
-2 |
1988 |
0.31 |
2010 |
5 |
0.45 |
|
22 Jan |
41 |
19 |
55 |
1994, 2005 |
-2 |
1988 |
0.11 |
1969 |
5 |
0.32 |
|
23 Jan |
42 |
19 |
58 |
1986 |
1 |
1973 |
0.26 |
1997 |
4 |
0.43 |
|
24 Jan |
42 |
20 |
58 |
1999 |
5 |
1974 |
0.07 |
1989 |
7 |
0.21 |
|
25 Jan |
44 |
20 |
62 |
1999 |
1 |
1988 |
0.29 |
1997 |
8 |
0.99 |
|
26 Jan |
44 |
21 |
61 |
1972, 1975 |
5 |
1988 |
0.35 |
2013 |
9 |
0.98 |
|
27 Jan |
44 |
22 |
59 |
2002 |
9 |
1979, 1988 |
0.94 |
1989 |
9 |
2.15 |
|
28 Jan |
44 |
21 |
57 |
2003 |
0 |
1990 |
0.20 |
2013 |
6 |
0.57 |
|
29 Jan |
43 |
20 |
63 |
1986 |
5 |
1974 |
0.27 |
2015 |
7 |
0.74 |
|
30 Jan |
44 |
21 |
64 |
1986 |
-8 |
1979 |
0.61 |
2015 |
10 |
1.01 |
|
31 Jan |
43 |
22 |
60 |
1971 |
0 |
1979 |
0.23 |
1978 |
9 |
1.29 |
|
*Number of years between 1969 and 2016 in which measurable precipitation (equal to or greater than 0.01 inch) fell on the date. |
||||||||||
|
Table 2. Average High and Low Temperature, High and Low Temperature Extremes and Year(s) of Occurrence, Highest Recorded Precipitation and Year(s) of Occurrence, and Number of Years Precipitation Occurred on each February Date at the NMSU Agricultural Science Center at Farmington, NM, 1969–2016 |
||||||||||
|
Date |
Air Temperature (°F) |
Precipitation (inches) |
||||||||
|
Avg. High |
Avg. Low |
Highest Record |
Year(s) of Highest |
Lowest Record |
Year(s) of Lowest |
Highest |
Year(s) of Highest |
No. Years > 0* |
Total for |
|
|
1 Feb |
43 |
20 |
59 |
1971 |
-1 |
1985 |
0.19 |
1996 |
5 |
0.35 |
|
2 Feb |
42 |
20 |
60 |
1995 |
0 |
2011 |
0.75 |
1988 |
6 |
0.94 |
|
3 Feb |
43 |
20 |
61 |
1995 |
-6 |
2011 |
0.36 |
2009 |
8 |
0.94 |
|
4 Feb |
44 |
21 |
58 |
2009 |
0 |
2011 |
0.23 |
1994 |
8 |
0.71 |
|
5 Feb |
44 |
21 |
60 |
2009 |
1 |
1985 |
0.07 |
1983 |
4 |
0.16 |
|
6 Feb |
45 |
21 |
62 |
2001, 2005 |
-7 |
1989 |
0.30 |
1986 |
5 |
0.41 |
|
7 Feb |
46 |
21 |
62 |
2009 |
-14 |
1989 |
0.28 |
2005 |
11 |
0.89 |
|
8 Feb |
46 |
23 |
62 |
1976, 2000, 2015 |
1 |
1974 |
0.62 |
2001 |
14 |
2.13 |
|
9 Feb |
46 |
23 |
66 |
1999, 2015 |
7 |
1982 |
0.34 |
2009 |
6 |
0.57 |
|
10 Feb |
47 |
23 |
61 |
1987, 1996 |
1 |
2011 |
0.11 |
1982 |
9 |
0.30 |
|
11 Feb |
46 |
22 |
61 |
1970 |
7 |
2011 |
0.47 |
2005 |
6 |
0.89 |
|
12 Feb |
48 |
23 |
61 |
1970 |
7 |
1999 |
0.20 |
2003 |
9 |
0.85 |
|
13 Feb |
50 |
24 |
63 |
1996, 1999, 2016 |
6 |
2004 |
0.09 |
1992 |
5 |
0.31 |
|
14 Feb |
50 |
27 |
63 |
1996, 2015 |
13 |
2004 |
0.41 |
1998 |
10 |
0.97 |
|
15 Feb |
49 |
26 |
66 |
1996 |
13 |
2002 |
0.17 |
1986 |
8 |
0.62 |
|
16 Feb |
50 |
25 |
64 |
1996 |
4 |
1990 |
0.17 |
1975, 1978 |
8 |
0.61 |
|
17 Feb |
50 |
27 |
66 |
1970, 1996, 2016 |
0 |
1978 |
0.16 |
2003 |
6 |
0.44 |
|
18 Feb |
51 |
26 |
66 |
2016 |
3 |
1978 |
0.39 |
2005 |
8 |
0.64 |
|
19 Feb |
51 |
26 |
65 |
1981 |
12 |
1978 |
0.21 |
1987 |
9 |
1.18 |
|
20 Feb |
49 |
27 |
65 |
1972, 1981, 1995, 2000 |
17 |
2009, 2012 |
0.26 |
1980 |
8 |
0.73 |
|
21 Feb |
49 |
25 |
68 |
1995 |
5 |
1971 |
0.30 |
2010 |
9 |
0.85 |
|
22 Feb |
50 |
25 |
64 |
1982, 2007 |
5 |
1971 |
0.17 |
2008 |
6 |
0.48 |
|
23 Feb |
50 |
26 |
66 |
1995 |
10 |
1975 |
0.35 |
2004 |
11 |
0.87 |
|
24 Feb |
51 |
25 |
67 |
1981 |
10 |
1974 |
0.43 |
1982 |
9 |
1.52 |
|
25 Feb |
52 |
26 |
69 |
1986, 2009 |
13 |
1971 |
0.81 |
1987 |
6 |
1.35 |
|
26 Feb |
52 |
27 |
70 |
1986 |
9 |
1971 |
0.21 |
2003 |
8 |
0.57 |
|
27 Feb |
52 |
26 |
69 |
1986 |
5 |
1971 |
0.34 |
2015 |
11 |
1.71 |
|
28 Feb |
51 |
27 |
67 |
2006 |
5 |
1971 |
0.34 |
2015 |
11 |
1.71 |
|
29 Feb |
57 |
29 |
68 |
1976 |
21 |
1995, 2000, 2012 |
0.00 |
n/a |
0 |
0.00 |
|
*Number of years between 1969 and 2016 in which measurable precipitation (equal to or greater than 0.01 inch) fell on the date. |
||||||||||
|
Table 3. Average High and Low Temperature, High and Low Temperature Extremes and Year(s) of Occurrence, Highest Recorded Precipitation and Year(s) of Occurrence, and Number of Years Precipitation Occurred on each March Date at the NMSU Agricultural Science Center at Farmington, NM, 1969–2016 |
||||||||||
|
Date |
Air Temperature (°F) |
Precipitation (inches) |
||||||||
|
Avg. High |
Avg. Low |
Highest Record |
Year(s) of Highest |
Lowest Record |
Year(s) of Lowest |
Highest |
Year(s) of Highest |
No. Years > 0* |
Total for |
|
|
1 Mar |
53 |
28 |
69 |
2008 |
9 |
1987 |
0.60 |
2013 |
13 |
2.39 |
|
2 Mar |
53 |
28 |
70 |
2009 |
8 |
2002 |
0.32 |
1981 |
7 |
0.99 |
|
3 Mar |
53 |
27 |
68 |
1986, 1999, 2006 |
3 |
2002 |
0.35 |
1995 |
6 |
0.99 |
|
4 Mar |
53 |
28 |
70 |
2000 |
6 |
2002 |
0.17 |
2014 |
7 |
0.63 |
|
5 Mar |
53 |
28 |
68 |
1972, 1986, 2016 |
13 |
1997 |
0.30 |
1995 |
5 |
0.52 |
|
6 Mar |
56 |
28 |
72 |
1972 |
9 |
1971 |
0.30 |
2000 |
3 |
0.34 |
|
7 Mar |
55 |
28 |
70 |
1972 |
10 |
1971 |
0.77 |
2001 |
13 |
2.19 |
|
8 Mar |
55 |
29 |
74 |
1989 |
17 |
1988, 1991 |
0.20 |
1973 |
7 |
0.65 |
|
9 Mar |
57 |
28 |
79 |
1989 |
11 |
2002 |
0.41 |
2010 |
6 |
1.19 |
|
10 Mar |
56 |
29 |
81 |
1989 |
15 |
1998 |
0.39 |
1981 |
10 |
1.57 |
|
11 Mar |
56 |
30 |
74 |
1972 |
13 |
1969 |
0.43 |
1985 |
12 |
1.76 |
|
12 Mar |
55 |
29 |
71 |
1972, 1989 |
11 |
1976 |
0.08 |
1975, 2009 |
6 |
0.26 |
|
13 Mar |
58 |
28 |
74 |
1972, 2003 |
11 |
1976 |
0.36 |
1981 |
9 |
1.13 |
|
14 Mar |
57 |
30 |
75 |
2007 |
9 |
1988 |
0.18 |
1991 |
7 |
0.40 |
|
15 Mar |
58 |
29 |
74 |
1994, 2007, 2013 |
14 |
1971 |
0.22 |
1975 |
7 |
0.58 |
|
16 Mar |
60 |
30 |
74 |
1994 |
17 |
1976 |
0.28 |
2001 |
6 |
0.80 |
|
17 Mar |
59 |
31 |
76 |
2007 |
13 |
1980 |
0.16 |
1983 |
5 |
0.33 |
|
18 Mar |
59 |
30 |
76 |
2007 |
11 |
1970 |
0.22 |
1987 |
6 |
0.67 |
|
19 Mar |
58 |
30 |
76 |
2004 |
11 |
1970 |
0.27 |
1985 |
4 |
0.57 |
|
20 Mar |
59 |
30 |
82 |
2004 |
18 |
2010, 2014 |
0.31 |
1983 |
7 |
0.87 |
|
21 Mar |
62 |
31 |
78 |
2004 |
16 |
1976 |
0.33 |
1983 |
10 |
1.13 |
|
22 Mar |
61 |
32 |
80 |
2004 |
19 |
1976 |
0.21 |
2000 |
6 |
0.48 |
|
23 Mar |
61 |
32 |
75 |
2004 |
18 |
1975 |
1.13 |
2007 |
5 |
1.31 |
|
24 Mar |
61 |
31 |
77 |
1998 |
13 |
1982 |
0.18 |
1983 |
4 |
0.47 |
|
25 Mar |
62 |
31 |
77 |
2004 |
17 |
1969 |
0.05 |
2005 |
1 |
0.05 |
|
26 Mar |
60 |
32 |
77 |
1971 |
16 |
1970 |
0.55 |
1982 |
10 |
1.82 |
|
27 Mar |
59 |
32 |
77 |
1971, 1988 |
20 |
1975, 2009, 2016 |
0.39 |
1981 |
11 |
1.35 |
|
28 Mar |
57 |
31 |
75 |
1986, 2015 |
9 |
1975 |
0.41 |
1985 |
13 |
1.67 |
|
29 Mar |
57 |
30 |
76 |
1999, 2015 |
11 |
1975 |
0.25 |
1973 |
13 |
1.21 |
|
30 Mar |
59 |
30 |
77 |
1971 |
13 |
1987 |
0.34 |
1992 |
9 |
0.88 |
|
31 Mar |
62 |
31 |
79 |
1978 |
18 |
1995 |
0.32 |
2006 |
8 |
0.77 |
|
*Number of years between 1969 and 2016 in which measurable precipitation (equal to or greater than 0.01 inch) fell on the date. |
||||||||||
|
Table 4. Average High and Low Temperature, High and Low Temperature Extremes and Year(s) of Occurrence, Highest Recorded Precipitation and Year(s) of Occurrence, and Number of Years Precipitation Occurred on each April Date at the NMSU Agricultural Science Center at Farmington, NM, 1969–2016 |
||||||||||
|
Date |
Air Temperature (°F) |
Precipitation (inches) |
||||||||
|
Avg. High |
Avg. Low |
Highest Record |
Year(s) of Highest |
Lowest Record |
Year(s) of Lowest |
Highest |
Year(s) of Highest |
No. Years > 0* |
Total for |
|
|
1 Apr |
64 |
32 |
76 |
1996, 2002 |
18 |
1971, 1980 |
0.49 |
1986 |
10 |
1.38 |
|
2 Apr |
65 |
33 |
79 |
2011 |
16 |
1979 |
1.19 |
2004 |
10 |
2.57 |
|
3 Apr |
65 |
32 |
75 |
2002, 2005, 2006 |
19 |
1975 |
1.26 |
1997 |
8 |
2.10 |
|
4 Apr |
66 |
32 |
76 |
2002 |
20 |
1970 |
0.62 |
1997 |
7 |
1.20 |
|
5 Apr |
65 |
34 |
78 |
2002 |
19 |
1981 |
0.15 |
1984 |
5 |
0.25 |
|
6 Apr |
64 |
34 |
79 |
1991 |
19 |
2009 |
0.22 |
2002 |
6 |
0.60 |
|
7 Apr |
64 |
35 |
78 |
1978, 1989, 2005 |
25 |
1983, 2010, 2012 |
0.38 |
2004 |
7 |
0.64 |
|
8 Apr |
64 |
34 |
78 |
1977, 1989, 1996 |
18 |
1973, 1980 |
0.32 |
2016 |
6 |
0.86 |
|
9 Apr |
65 |
35 |
81 |
1977 |
20 |
1980 |
0.36 |
1978 |
6 |
0.88 |
|
10 Apr |
66 |
35 |
80 |
1972, 2012 |
21 |
1988, 1999, 2011 |
0.21 |
1979 |
6 |
0.53 |
|
11 Apr |
66 |
35 |
79 |
1998, 2012 |
20 |
1997 |
0.20 |
2009 |
7 |
0.56 |
|
12 Apr |
67 |
35 |
80 |
1992, 2006 |
19 |
1997 |
0.49 |
1975 |
7 |
0.90 |
|
13 Apr |
67 |
34 |
80 |
1992, 2002, 2006 |
18 |
1974 |
0.12 |
1975 |
5 |
0.23 |
|
14 Apr |
66 |
36 |
78 |
2002 |
20 |
1974 |
0.04 |
1988 |
2 |
0.06 |
|
15 Apr |
65 |
36 |
80 |
1990, 2008 |
21 |
1983 |
0.32 |
2016 |
9 |
0.83 |
|
16 Apr |
66 |
36 |
81 |
1994 |
20 |
1999 |
0.22 |
1988 |
7 |
0.61 |
|
17 Apr |
68 |
37 |
80 |
1987, 1994, 2001 |
23 |
1983 |
0.30 |
2015 |
6 |
0.53 |
|
18 Apr |
68 |
38 |
81 |
2001 |
23 |
1978, 1986, 1998, 2013 |
0.50 |
1970 |
9 |
1.52 |
|
19 Apr |
69 |
36 |
85 |
1989 |
21 |
1986, 2013 |
0.30 |
1995 |
5 |
0.50 |
|
20 Apr |
69 |
35 |
85 |
1989 |
24 |
1973, 1982 |
0.39 |
1995 |
6 |
0.73 |
|
21 Apr |
70 |
36 |
85 |
1989 |
25 |
1987 |
0.63 |
1985 |
9 |
2.60 |
|
22 Apr |
68 |
38 |
85 |
2006 |
27 |
1970, 2002 |
0.17 |
1988 |
6 |
0.57 |
|
23 Apr |
68 |
38 |
84 |
2006, 2012 |
25 |
1970, 2008 |
0.56 |
1997 |
10 |
2.18 |
|
24 Apr |
71 |
39 |
85 |
1996, 2012 |
24 |
2008 |
0.38 |
1997 |
6 |
1.33 |
|
25 Apr |
70 |
39 |
80 |
1981 |
21 |
2008 |
0.16 |
2011 |
8 |
0.35 |
|
26 Apr |
69 |
38 |
81 |
2000 |
18 |
1984 |
0.37 |
1998 |
9 |
0.86 |
|
27 Apr |
64 |
37 |
85 |
2000 |
18 |
2008 |
0.29 |
1984 |
7 |
0.61 |
|
28 Apr |
65 |
39 |
84 |
1992, 2000 |
27 |
1970, 1991 |
0.78 |
1985 |
7 |
1.04 |
|
29 Apr |
65 |
39 |
86 |
1992 |
20 |
1996 |
0.07 |
1990 |
5 |
0.20 |
|
30 Apr |
66 |
38 |
85 |
1992 |
24 |
1970, 1975 |
0.19 |
1990 |
9 |
1.24 |
|
*Number of years between 1969 and 2016 in which measurable precipitation (equal to or greater than 0.01 inch) fell on the date. |
||||||||||
|
Table 5. Average High and Low Temperature, High and Low Temperature Extremes and Year(s) of Occurrence, Highest Recorded Precipitation and Year(s) of Occurrence, and Number of Years Precipitation Occurred on each May Date at the NMSU Agricultural Science Center at Farmington, NM, 1969–2016 |
||||||||||
|
Date |
Air Temperature (°F) |
Precipitation (inches) |
||||||||
|
Avg. High |
Avg. Low |
Highest Record |
Year(s) of Highest |
Lowest Record |
Year(s) of Lowest |
Highest |
Year(s) of Highest |
No. Years > 0* |
Total for |
|
|
1 May |
69 |
40 |
85 |
2001 |
24 |
2008 |
0.51 |
1990 |
13 |
1.94 |
|
2 May |
69 |
39 |
82 |
1986, 2000 |
15 |
2008 |
0.37 |
2009 |
8 |
1.17 |
|
3 May |
72 |
40 |
85 |
2000 |
20 |
2008 |
0.40 |
1999 |
5 |
0.95 |
|
4 May |
74 |
42 |
86 |
2000 |
25 |
2008 |
0.38 |
1982 |
3 |
0.59 |
|
5 May |
72 |
42 |
87 |
2000 |
30 |
1991 |
0.44 |
1978 |
10 |
1.67 |
|
6 May |
71 |
42 |
84 |
1989, 1996, 2000 |
25 |
1975 |
0.56 |
1969 |
14 |
1.99 |
|
7 May |
71 |
41 |
89 |
1989 |
23 |
1975 |
0.32 |
1976 |
8 |
0.96 |
|
8 May |
72 |
41 |
86 |
1989 |
27 |
1984 |
0.09 |
1971 |
7 |
0.22 |
|
9 May |
73 |
42 |
86 |
1974, 1989 |
31 |
1971 |
1.19 |
1992 |
4 |
1.32 |
|
10 May |
74 |
43 |
87 |
2004 |
29 |
2003 |
0.12 |
1979 |
4 |
0.18 |
|
11 May |
75 |
43 |
86 |
1996 |
29 |
1979 |
0.57 |
1994 |
5 |
0.75 |
|
12 May |
73 |
43 |
90 |
1996 |
27 |
2010 |
0.20 |
1982 |
5 |
0.68 |
|
13 May |
76 |
43 |
90 |
1984 |
28 |
2008 |
0.08 |
2012 |
4 |
0.15 |
|
14 May |
77 |
45 |
89 |
1984 |
29 |
1985 |
0.22 |
1977 |
3 |
0.36 |
|
15 May |
77 |
47 |
88 |
1996 |
31 |
1983, 1998 |
0.24 |
2008 |
5 |
0.57 |
|
16 May |
77 |
47 |
87 |
1988, 1996 |
36 |
1982 |
0.25 |
2015 |
4 |
0.56 |
|
17 May |
76 |
46 |
89 |
2003, 2006 |
27 |
1983 |
0.25 |
1981 |
3 |
0.41 |
|
18 May |
77 |
46 |
90 |
1996 |
31 |
1983 |
0.86 |
1988 |
5 |
1.40 |
|
19 May |
78 |
47 |
90 |
2006 |
32 |
1983 |
0.70 |
2001 |
8 |
1.40 |
|
20 May |
77 |
47 |
94 |
2005 |
28 |
1974 |
0.30 |
2007 |
8 |
0.98 |
|
21 May |
78 |
47 |
90 |
2005 |
32 |
1974 |
0.38 |
1997 |
9 |
1.00 |
|
22 May |
78 |
47 |
92 |
2005 |
35 |
1975, 2002 |
0.09 |
1975 |
11 |
0.45 |
|
23 May |
78 |
46 |
93 |
2005 |
34 |
1975 |
0.50 |
1999 |
7 |
1.62 |
|
24 May |
77 |
47 |
93 |
2005 |
33 |
1971 |
0.19 |
1994 |
6 |
0.39 |
|
25 May |
78 |
46 |
92 |
2006 |
27 |
1980 |
0.53 |
1994 |
7 |
1.07 |
|
26 May |
79 |
47 |
90 |
2001 |
30 |
1980 |
0.24 |
1973 |
5 |
0.39 |
|
27 May |
81 |
47 |
93 |
2003 |
35 |
1987 |
0.29 |
1981 |
1 |
0.29 |
|
28 May |
82 |
49 |
94 |
2000, 2003 |
34 |
1973 |
0.20 |
1995 |
5 |
0.42 |
|
29 May |
80 |
49 |
97 |
2000 |
38 |
2006 |
0.25 |
1981 |
6 |
0.72 |
|
30 May |
80 |
48 |
95 |
2002, 2003 |
34 |
1971 |
0.00 |
n/a |
0 |
0.00 |
|
31 May |
82 |
48 |
98 |
2002 |
34 |
1988 |
0.24 |
1991 |
4 |
0.48 |
|
*Number of years between 1969 and 2016 in which measurable precipitation (equal to or greater than 0.01 inch) fell on the date. |
||||||||||
|
Table 6. Average High and Low Temperature, High and Low Temperature Extremes and Year(s) of Occurrence, Highest Recorded Precipitation and Year(s) of Occurrence, and Number of Years Precipitation Occurred on each June Date at the NMSU Agricultural Science Center at Farmington, NM, 1969–2016 |
||||||||||
|
Date |
Air Temperature (°F) |
Precipitation (inches) |
||||||||
|
Avg. High |
Avg. Low |
Highest Record |
Year(s) of Highest |
Lowest Record |
Year(s) of Lowest |
Highest |
Year(s) of Highest |
No. Years > 0* |
Total for |
|
|
1 June |
83 |
49 |
96 |
2003 |
38 |
1971, 1980, 1988 |
0.10 |
1991 |
3 |
0.17 |
|
2 June |
83 |
20 |
92 |
2004, 2006 |
35 |
1990 |
0.10 |
1973 |
5 |
0.23 |
|
3 June |
84 |
50 |
94 |
2004 |
41 |
1989 |
0.19 |
1986 |
3 |
0.44 |
|
4 June |
84 |
51 |
95 |
2006 |
37 |
2005 |
0.43 |
1973 |
5 |
0.70 |
|
5 June |
83 |
51 |
95 |
2006 |
32 |
1999 |
0.50 |
2015 |
3 |
0.62 |
|
6 June |
84 |
52 |
99 |
2006 |
38 |
1982 |
0.33 |
1970 |
3 |
0.78 |
|
7 June |
84 |
51 |
96 |
2006 |
38 |
2007 |
0.36 |
1997 |
6 |
0.46 |
|
8 June |
83 |
52 |
95 |
2002, 2016 |
38 |
1974, 2007 |
0.22 |
2006 |
7 |
0.58 |
|
9 June |
84 |
51 |
95 |
1985, 2016 |
36 |
1979 |
0.14 |
2015 |
7 |
0.47 |
|
10 June |
84 |
51 |
96 |
1985, 2013 |
39 |
1979, 1995 |
0.10 |
1975 |
4 |
0.24 |
|
11 June |
84 |
52 |
93 |
1981, 1994, 2006 |
38 |
1975 |
0.44 |
1970 |
4 |
1.11 |
|
12 June |
85 |
51 |
95 |
2006 |
40 |
2008 |
0.10 |
2007, 2010 |
3 |
0.26 |
|
13 June |
85 |
52 |
96 |
2006 |
41 |
2008 |
0.06 |
2009 |
3 |
0.12 |
|
14 June |
86 |
52 |
96 |
1974, 2006 |
36 |
1983, 2001 |
0.30 |
1996 |
5 |
0.97 |
|
15 June |
87 |
52 |
97 |
1974 |
37 |
1981 |
0.39 |
1984 |
3 |
0.50 |
|
16 June |
88 |
54 |
95 |
1985, 2007 |
36 |
1981 |
0.05 |
1999 |
4 |
0.11 |
|
17 June |
87 |
55 |
95 |
1974, 2001 |
44 |
1992 |
0.14 |
1969 |
5 |
0.32 |
|
18 June |
89 |
54 |
98 |
1989 |
38 |
1995 |
0.02 |
1994 |
1 |
0.02 |
|
19 June |
89 |
54 |
99 |
2006 |
40 |
1998 |
0.02 |
1999 |
2 |
0.03 |
|
20 June |
90 |
55 |
101 |
1974, 2002, 2005, 2016 |
41 |
1973 |
0.09 |
1999 |
3 |
0.18 |
|
21 June |
89 |
55 |
99 |
2005, 2016 |
44 |
2000 |
0.13 |
1996 |
2 |
0.18 |
|
22 June |
90 |
56 |
99 |
1988 |
42 |
1989 |
0.07 |
1976 |
2 |
0.12 |
|
23 June |
90 |
57 |
98 |
1981, 1990 |
46 |
1995 |
0.17 |
1983 |
3 |
0.29 |
|
24 June |
90 |
56 |
98 |
1981 |
42 |
1976 |
0.21 |
1986 |
5 |
0.48 |
|
25 June |
90 |
58 |
100 |
1981, 1990, 1994 |
43 |
1976 |
0.35 |
1969 |
6 |
0.76 |
|
26 June |
90 |
58 |
100 |
1990 |
40 |
1975 |
0.34 |
1969 |
6 |
0.79 |
|
27 June |
90 |
58 |
99 |
1990, 2013 |
39 |
1985 |
0.15 |
1996 |
6 |
0.31 |
|
28 June |
91 |
59 |
99 |
1980, 1990, 2013 |
45 |
1985 |
0.08 |
2004 |
2 |
0.15 |
|
29 June |
91 |
59 |
99 |
1998 |
51 |
2003 |
0.07 |
1980 |
4 |
0.13 |
|
30 June |
92 |
59 |
103 |
1990 |
51 |
1970 |
0.44 |
1981 |
6 |
0.81 |
|
*Number of years between 1969 and 2016 in which measurable precipitation (equal to or greater than 0.01 inch) fell on the date. |
||||||||||
|
Table 7. Average High and Low Temperature, High and Low Temperature Extremes and Year(s) of Occurrence, Highest Recorded Precipitation and Year(s) of Occurrence, and Number of Years Precipitation Occurred on each July Date at the NMSU Agricultural Science Center at Farmington, NM, 1969–2016 |
||||||||||
|
Date |
Air Temperature (°F) |
Precipitation (inches) |
||||||||
|
Avg. High |
Avg. Low |
Highest Record |
Year(s) of |
Lowest Record |
Year(s) of Lowest |
Highest Recorded |
Year(s) of Highest |
No. Years > 0* |
Total for |
|
|
1 July |
91 |
59 |
99 |
1998, 1999, 2002 |
51 |
2011 |
0.31 |
2008 |
6 |
1.22 |
|
2 July |
92 |
59 |
100 |
2002 |
47 |
1982, 1992 |
0.19 |
1979 |
3 |
0.40 |
|
3 July |
92 |
59 |
98 |
1989, 2007 |
49 |
1992 |
0.10 |
1995 |
5 |
0.41 |
|
4 July |
91 |
59 |
100 |
1989 |
45 |
1969, 1995 |
0.10 |
1986 |
5 |
0.28 |
|
5 July |
91 |
59 |
102 |
1989 |
43 |
1969 |
0.25 |
2006 |
5 |
0.36 |
|
6 July |
92 |
60 |
103 |
1989 |
44 |
1969 |
0.39 |
2006 |
3 |
0.63 |
|
7 July |
90 |
61 |
100 |
1989 |
53 |
1980, 1982 |
0.40 |
2012 |
13 |
1.15 |
|
8 July |
91 |
60 |
100 |
1989, 1995 |
46 |
1993 |
0.56 |
1999 |
13 |
2.98 |
|
9 July |
90 |
60 |
99 |
1976, 2003 |
50 |
1999 |
0.52 |
1999 |
13 |
1.55 |
|
10 July |
91 |
60 |
100 |
1976, 2003 |
53 |
1979, 1982, 2003 |
0.44 |
2001 |
7 |
0.84 |
|
11 July |
91 |
60 |
100 |
2003 |
52 |
1979 |
0.42 |
2007 |
12 |
1.20 |
|
12 July |
91 |
60 |
101 |
2005 |
55 |
1979, 2011 |
0.39 |
1992 |
9 |
1.11 |
|
13 July |
92 |
60 |
101 |
2003 |
52 |
1979 |
0.20 |
1981, 1984 |
9 |
0.70 |
|
14 July |
92 |
60 |
102 |
2003 |
51 |
1992 |
0.80 |
1974 |
10 |
1.83 |
|
15 July |
92 |
61 |
103 |
2003 |
53 |
1992, 1995 |
0.27 |
2013 |
9 |
0.85 |
|
16 July |
91 |
62 |
99 |
1971, 2005 |
54 |
1990, 1992, 1999, 2015 |
0.35 |
1979 |
15 |
1.98 |
|
17 July |
91 |
61 |
100 |
2005, 2006 |
55 |
1992, 1993 |
0.59 |
2000 |
13 |
1.70 |
|
18 July |
91 |
61 |
99 |
1989, 2005 |
50 |
1993 |
0.26 |
1977 |
11 |
1.16 |
|
19 July |
91 |
61 |
100 |
1998, 2005 |
51 |
1987 |
0.78 |
1986 |
10 |
1.66 |
|
20 July |
91 |
61 |
102 |
2005 |
54 |
1973, 1995 |
0.69 |
1986 |
8 |
1.53 |
|
21 July |
91 |
62 |
103 |
2005 |
55 |
1996 |
0.80 |
1986 |
13 |
1.57 |
|
22 July |
91 |
61 |
101 |
2003 |
53 |
1991, 1993 |
0.39 |
1986 |
10 |
1.63 |
|
23 July |
90 |
61 |
99 |
2005 |
50 |
1995 |
0.22 |
1989 |
8 |
0.69 |
|
24 July |
90 |
62 |
99 |
2005 |
54 |
1979, 1986, 2000 |
0.53 |
1998 |
15 |
2.49 |
|
25 July |
90 |
60 |
97 |
2003 |
44 |
1981 |
0.19 |
1983, 1999 |
12 |
1.03 |
|
26 July |
90 |
60 |
97 |
2003 |
45 |
1981 |
0.27 |
2011 |
14 |
1.45 |
|
27 July |
90 |
60 |
97 |
1995, 2016 |
54 |
1993 |
0.43 |
1989 |
16 |
1.26 |
|
28 July |
90 |
60 |
100 |
1995 |
49 |
1981 |
0.36 |
1982 |
13 |
1.28 |
|
29 July |
91 |
61 |
101 |
1995 |
52 |
2004 |
0.42 |
1983 |
9 |
0.84 |
|
30 July |
91 |
61 |
100 |
1972 |
55 |
1975, 1996 |
0.56 |
1988 |
14 |
2.17 |
|
31 July |
91 |
61 |
99 |
2002 |
52 |
2000 |
1.16 |
1989 |
9 |
1.41 |
|
*Number of years between 1969 and 2016 in which measurable precipitation (equal to or greater than 0.01 inch) fell on the date. |
||||||||||
|
Table 8. Average High and Low Temperature, High and Low Temperature Extremes and Year(s) of Occurrence, Highest Recorded Precipitation and Year(s) of Occurrence, and Number of Years Precipitation Occurred on each August Date at the NMSU Agricultural Science Center at Farmington, NM, 1969–2016 |
||||||||||
|
Date |
Air Temperature (°F) |
Precipitation (inches) |
||||||||
|
Avg. High |
Avg. Low |
Highest Record |
Year(s) of Highest |
Lowest Record |
Year(s) of Lowest |
Highest |
Year(s) of Highest |
No. Years > 0* |
Total for |
|
|
1 Aug |
90 |
61 |
98 |
1972 |
55 |
1977 |
0.80 |
2010 |
11 |
1.95 |
|
2 Aug |
89 |
61 |
99 |
1970 |
51 |
1975 |
0.36 |
1982 |
11 |
1.54 |
|
3 Aug |
89 |
61 |
98 |
1977 |
49 |
1975 |
0.66 |
1999 |
11 |
1.54 |
|
4 Aug |
89 |
61 |
97 |
1994 |
53 |
1975 |
0.68 |
2006 |
10 |
1.74 |
|
5 Aug |
89 |
60 |
99 |
1983 |
52 |
1976, 1996 |
0.70 |
2005 |
14 |
2.28 |
|
6 Aug |
89 |
60 |
98 |
2003 |
53 |
1990, 1996 |
0.35 |
2013 |
14 |
1.72 |
|
7 Aug |
89 |
61 |
97 |
1995 |
54 |
1991, 1996 |
0.24 |
2015 |
12 |
1.27 |
|
8 Aug |
89 |
60 |
96 |
2000 |
52 |
2009 |
0.09 |
1994 |
5 |
0.24 |
|
9 Aug |
90 |
60 |
97 |
1969, 1998, 2000 |
48 |
2009 |
0.30 |
1984 |
4 |
0.34 |
|
10 Aug |
89 |
60 |
98 |
2003 |
52 |
1974, 1996 |
0.32 |
1985 |
13 |
1.27 |
|
11 Aug |
89 |
60 |
98 |
2003 |
54 |
1999, 2013 |
0.21 |
1988 |
11 |
0.80 |
|
12 Aug |
89 |
60 |
97 |
1973 |
49 |
1999 |
1.13 |
1977 |
10 |
1.55 |
|
13 Aug |
89 |
60 |
96 |
1970, 1996, 2003, 2007 |
49 |
1981 |
0.57 |
1990 |
11 |
1.64 |
|
14 Aug |
88 |
60 |
96 |
1973, 1996 |
49 |
1981 |
0.59 |
1999 |
10 |
1.72 |
|
15 Aug |
88 |
58 |
96 |
1973 |
48 |
1978 |
0.62 |
1983 |
9 |
1.66 |
|
16 Aug |
88 |
59 |
94 |
1986, 1994, 2007 |
49 |
1981 |
0.51 |
1984 |
11 |
1.75 |
|
17 Aug |
88 |
58 |
96 |
1986, 1994 |
51 |
2009 |
0.20 |
1989 |
9 |
0.50 |
|
18 Aug |
88 |
58 |
98 |
2002 |
51 |
1979 |
0.41 |
1983 |
10 |
0.81 |
|
19 Aug |
87 |
58 |
97 |
2002 |
48 |
1979 |
0.63 |
1987 |
11 |
2.31 |
|
20 Aug |
86 |
58 |
94 |
1986 |
48 |
1980 |
1.10 |
1998 |
17 |
4.11 |
|
21 Aug |
87 |
58 |
94 |
1986, 2003 |
41 |
1980 |
0.51 |
1985 |
12 |
1.92 |
|
22 Aug |
87 |
59 |
95 |
2007 |
53 |
2000 |
0.38 |
2010 |
14 |
1.22 |
|
23 Aug |
86 |
59 |
93 |
1973, 1988 |
52 |
1979, 1981, 2001 |
0.86 |
1987 |
15 |
4.37 |
|
24 Aug |
85 |
58 |
95 |
2011 |
48 |
1989 |
0.79 |
1988 |
11 |
1.93 |
|
25 Aug |
86 |
58 |
96 |
2002 |
48 |
1989, 1992 |
1.10 |
1982 |
13 |
2.61 |
|
26 Aug |
86 |
58 |
94 |
1969, 2001, 2002 |
48 |
1992 |
0.60 |
2015 |
12 |
1.73 |
|
27 Aug |
86 |
57 |
95 |
1970 |
46 |
1978, 1992 |
0.83 |
1993 |
10 |
1.83 |
|
28 Aug |
86 |
57 |
95 |
1969 |
46 |
1978 |
0.16 |
1993 |
4 |
0.32 |
|
29 Aug |
86 |
58 |
97 |
1969 |
49 |
1987, 2014 |
0.66 |
1986 |
5 |
0.95 |
|
30 Aug |
87 |
58 |
95 |
1985 |
49 |
1975 |
0.63 |
2000 |
10 |
1.25 |
|
31 Aug |
86 |
57 |
94 |
1995 |
49 |
1973 |
0.74 |
1997 |
10 |
1.39 |
|
*Number of years between 1969 and 2016 in which measurable precipitation (equal to or greater than 0.01 inch) fell on the date. |
||||||||||
|
Table 9. Average High and Low Temperature, High and Low Temperature Extremes and Year(s) of Occurrence, Highest Recorded Precipitation and Year(s) of Occurrence, and Number of Years Precipitation Occurred on each September Date at the NMSU Agricultural Science Center at Farmington, NM, 1969–2016 |
||||||||||
|
Date |
Air Temperature (°F) |
Precipitation (inches) |
||||||||
|
Avg. High |
Avg. Low |
Highest Record |
Year(s) of Highest |
Lowest Record |
Year(s) of Lowest |
Highest |
Year(s) of Highest |
No. Years > 0* |
Total for |
|
|
1 Sep |
86 |
58 |
97 |
1995 |
47 |
1980, 1981 |
0.28 |
2011 |
7 |
0.54 |
|
2 Sep |
86 |
57 |
94 |
1995 |
44 |
1973 |
0.48 |
1994 |
5 |
0.76 |
|
3 Sep |
86 |
57 |
94 |
1995 |
40 |
1973 |
0.40 |
2004 |
4 |
0.65 |
|
4 Sep |
85 |
57 |
95 |
1995 |
43 |
1973 |
0.44 |
1981 |
8 |
1.17 |
|
5 Sep |
84 |
56 |
91 |
1976, 1977, 1995, 2011 |
41 |
2004 |
0.44 |
1991 |
8 |
1.09 |
|
6 Sep |
84 |
56 |
93 |
1977 |
44 |
2004 |
1.93 |
1970 |
6 |
2.59 |
|
7 Sep |
84 |
55 |
94 |
1979 |
45 |
1970, 1999 |
1.10 |
1995 |
11 |
2.28 |
|
8 Sep |
82 |
55 |
92 |
1979 |
40 |
2001 |
1.57 |
2002 |
12 |
3.91 |
|
9 Sep |
82 |
55 |
94 |
1979 |
36 |
2001 |
0.61 |
2003 |
13 |
2.94 |
|
10 Sep |
81 |
55 |
91 |
1974, 1990 |
46 |
2010 |
1.42 |
2002 |
14 |
4.10 |
|
11 Sep |
81 |
54 |
91 |
1990 |
42 |
1986 |
0.58 |
1982 |
15 |
1.90 |
|
12 Sep |
80 |
52 |
95 |
1969 |
37 |
1985 |
1.20 |
2015 |
17 |
4.10 |
|
13 Sep |
80 |
52 |
93 |
1969, 1990 |
40 |
1985, 1989 |
0.64 |
1982 |
10 |
1.76 |
|
14 Sep |
80 |
51 |
93 |
1990, 2000 |
36 |
1989 |
0.44 |
2006 |
10 |
1.24 |
|
15 Sep |
79 |
51 |
92 |
2000 |
40 |
1987, 1988 |
0.66 |
1997 |
9 |
1.37 |
|
16 Sep |
80 |
51 |
92 |
2000 |
39 |
1991 |
0.21 |
1990, 2007 |
6 |
0.73 |
|
17 Sep |
80 |
51 |
92 |
2000 |
38 |
2006 |
0.26 |
1978, 2013 |
10 |
0.84 |
|
18 Sep |
78 |
50 |
88 |
1998, 2010 |
28 |
1971 |
0.57 |
1985 |
10 |
1.99 |
|
19 Sep |
78 |
49 |
89 |
2010 |
29 |
1996 |
0.85 |
2004 |
8 |
1.40 |
|
20 Sep |
78 |
49 |
90 |
1998, 2005 |
33 |
1978 |
1.20 |
1969 |
13 |
3.23 |
|
21 Sep |
77 |
48 |
86 |
2000, 2001 |
30 |
1983 |
0.22 |
1997 |
7 |
0.39 |
|
22 Sep |
77 |
48 |
88 |
1993 |
31 |
2009 |
0.52 |
2010 |
12 |
1.74 |
|
23 Sep |
75 |
48 |
87 |
2001 |
31 |
2006 |
0.72 |
1986 |
8 |
1.14 |
|
24 Sep |
76 |
47 |
87 |
1998 |
33 |
2000 |
1.19 |
1978 |
5 |
1.35 |
|
25 Sep |
77 |
47 |
88 |
2001 |
33 |
2000 |
0.58 |
1976 |
7 |
1.87 |
|
26 Sep |
78 |
48 |
88 |
2005 |
34 |
1970 |
0.40 |
1976 |
5 |
0.58 |
|
27 Sep |
78 |
48 |
89 |
2001 |
34 |
1996 |
0.74 |
2014 |
7 |
1.69 |
|
28 Sep |
77 |
47 |
89 |
2001 |
31 |
1996 |
0.69 |
1990 |
9 |
2.41 |
|
29 Sep |
76 |
47 |
88 |
2001 |
28 |
1999 |
0.39 |
1971 |
6 |
1.41 |
|
30 Sep |
77 |
46 |
88 |
2010 |
31 |
1985 |
0.32 |
1997 |
4 |
0.75 |
|
*Number of years between 1969 and 2016 in which measurable precipitation (equal to or greater than 0.01 inch) fell on the date. |
||||||||||
|
Table 10. Average High and Low Temperature, High and Low Temperature Extremes and Year(s) of Occurrence, Highest Recorded Precipitation and Year(s) of Occurrence, and Number of Years Precipitation Occurred on each October Date at the NMSU Agricultural Science Center at Farmington, NM, 1969–2016 |
||||||||||
|
Date |
Air Temperature (°F) |
Precipitation (inches) |
||||||||
|
Avg. High |
Avg. Low |
Highest Record |
Year(s) of Highest |
Lowest Record |
Year(s) of Lowest |
Highest |
Year(s) of Highest |
No. Years > 0* |
Total for |
|
|
1 Oct |
76 |
47 |
88 |
1987, 2015 |
31 |
1985 |
0.21 |
1983 |
8 |
0.81 |
|
2 Oct |
75 |
46 |
84 |
2010 |
28 |
2009 |
0.83 |
1981 |
9 |
2.50 |
|
3 Oct |
74 |
45 |
83 |
1988, 2005, 2012 |
32 |
1971 |
0.64 |
1969 |
9 |
1.65 |
|
4 Oct |
71 |
44 |
83 |
2006 |
32 |
2002 |
0.59 |
2011 |
14 |
2.52 |
|
5 Oct |
72 |
43 |
85 |
1999 |
30 |
1969 |
0.40 |
2015 |
12 |
1.53 |
|
6 Oct |
71 |
43 |
84 |
1975 |
27 |
1998 |
0.53 |
1993 |
11 |
2.01 |
|
7 Oct |
70 |
43 |
83 |
1979 |
28 |
2007 |
0.64 |
1972 |
8 |
1.03 |
|
8 Oct |
69 |
42 |
82 |
1980 |
28 |
1992 |
0.51 |
2006 |
7 |
1.16 |
|
9 Oct |
70 |
42 |
81 |
2003 |
28 |
1970 |
0.32 |
2000 |
9 |
1.26 |
|
10 Oct |
71 |
43 |
82 |
1991, 1999 |
28 |
1982 |
0.42 |
2013 |
6 |
1.28 |
|
11 Oct |
71 |
42 |
84 |
1999 |
28 |
2001 |
0.46 |
1986 |
7 |
1.16 |
|
12 Oct |
69 |
42 |
82 |
1991 |
28 |
1982, 2008 |
0.19 |
1974 |
6 |
0.73 |
|
13 Oct |
69 |
41 |
80 |
1979, 1989, 1998, 1999 |
23 |
1997 |
0.18 |
1972 |
7 |
0.57 |
|
14 Oct |
69 |
40 |
80 |
1998, 1999, 2015 |
27 |
1975, 2008 |
0.35 |
2006 |
4 |
0.77 |
|
15 Oct |
69 |
39 |
79 |
1979, 2011, 2015 |
28 |
1975 |
0.23 |
1980, 1994 |
5 |
0.57 |
|
16 Oct |
68 |
40 |
80 |
1991 |
23 |
1984 |
0.39 |
1994 |
10 |
1.42 |
|
17 Oct |
67 |
40 |
79 |
1973 |
21 |
1999 |
0.26 |
1993 |
10 |
1.22 |
|
18 Oct |
67 |
39 |
78 |
1973, 2003 |
20 |
1999 |
0.36 |
1972 |
6 |
0.80 |
|
19 Oct |
67 |
39 |
80 |
2003 |
24 |
1976 |
0.89 |
1990 |
5 |
1.52 |
|
20 Oct |
67 |
39 |
78 |
1973, 1975, 1992 |
28 |
1995, 1999 |
0.88 |
1978 |
8 |
1.55 |
|
21 Oct |
64 |
39 |
80 |
2003 |
26 |
1990, 1996 |
1.16 |
1979 |
9 |
2.00 |
|
22 Oct |
63 |
38 |
80 |
2003 |
16 |
1996 |
1.47 |
1969 |
12 |
2.88 |
|
23 Oct |
64 |
37 |
80 |
1973 |
22 |
2008 |
0.37 |
2000 |
9 |
1.66 |
|
24 Oct |
64 |
36 |
75 |
1989, 2011 |
17 |
1980 |
0.40 |
2000 |
10 |
1.05 |
|
25 Oct |
64 |
37 |
77 |
1988, 2005, 2014 |
22 |
1980 |
0.78 |
1998 |
12 |
1.90 |
|
26 Oct |
61 |
35 |
79 |
1977 |
19 |
1997 |
0.74 |
2011 |
10 |
2.49 |
|
27 Oct |
62 |
36 |
75 |
1985, 1990, 2001, 2007 |
21 |
1997 |
0.65 |
1974 |
9 |
2.25 |
|
28 Oct |
61 |
36 |
79 |
2001, 2016 |
21 |
1970 |
0.63 |
2002 |
12 |
1.97 |
|
29 Oct |
60 |
35 |
77 |
2001 |
21 |
1970, 1982 |
0.61 |
1987 |
11 |
1.86 |
|
30 Oct |
60 |
34 |
78 |
2001 |
15 |
1989 |
0.18 |
1998 |
6 |
0.73 |
|
31 Oct |
59 |
34 |
72 |
1988, 2001, 2008, 2014 |
19 |
1999 |
0.27 |
1986 |
9 |
0.91 |
|
*Number of years between 1969 and 2016 in which measurable precipitation (equal to or greater than 0.01 inch) fell on the date. |
||||||||||
|
Table 11. Average High and Low Temperature, High and Low Temperature Extremes and Year(s) of Occurrence, Highest Recorded Precipitation and Year(s) of Occurrence, and Number of Years Precipitation Occurred on each November Date at the NMSU Agricultural Science Center at Farmington, NM, 1969–2016 |
||||||||||
|
Date |
Air Temperature (°F) |
Precipitation (inches) |
||||||||
|
Avg. High |
Avg. Low |
Highest Record |
Year(s) of Highest |
Lowest Record |
Year(s) of Lowest |
Highest |
Year(s) of Highest |
No. Years > 0* |
Total for |
|
|
1 Nov |
59 |
33 |
74 |
2008, 2014 |
15 |
1972 |
0.65 |
1986 |
7 |
1.08 |
|
2 Nov |
59 |
32 |
74 |
2008 |
14 |
1989 |
0.39 |
1990 |
6 |
0.91 |
|
3 Nov |
58 |
32 |
75 |
2001 |
11 |
1991 |
0.79 |
1978 |
8 |
1.77 |
|
4 Nov |
59 |
32 |
74 |
1977, 2001 |
14 |
1992 |
0.49 |
2016 |
8 |
0.99 |
|
5 Nov |
59 |
33 |
71 |
1975, 1977, 1999, 2009 |
20 |
1992 |
0.52 |
1987 |
4 |
0.84 |
|
6 Nov |
59 |
32 |
75 |
1999 |
15 |
1993, 2013 |
0.48 |
1986 |
5 |
1.23 |
|
7 Nov |
59 |
32 |
74 |
1999 |
13 |
2008 |
0.59 |
1977 |
7 |
1.64 |
|
8 Nov |
58 |
34 |
71 |
1980, 1999 |
17 |
2000 |
0.61 |
1998 |
10 |
1.99 |
|
9 Nov |
57 |
33 |
73 |
1980 |
18 |
1986 |
0.23 |
2012 |
8 |
0.66 |
|
10 Nov |
57 |
32 |
74 |
2005 |
16 |
1986 |
0.70 |
2002 |
12 |
1.44 |
|
11 Nov |
55 |
32 |
71 |
1973, 1999 |
19 |
1986, 1995 |
0.54 |
1994 |
11 |
1.96 |
|
12 Nov |
55 |
31 |
72 |
1973 |
12 |
1975 |
0.71 |
2003 |
7 |
1.68 |
|
13 Nov |
55 |
30 |
69 |
1999 |
15 |
2000 |
0.25 |
1970 |
9 |
0.72 |
|
14 Nov |
54 |
29 |
70 |
1999 |
17 |
1982, 2010 |
0.35 |
1991 |
7 |
1.07 |
|
15 Nov |
53 |
29 |
69 |
1999 |
16 |
1980, 1985 |
0.40 |
1991 |
7 |
0.94 |
|
16 Nov |
52 |
28 |
68 |
1975, 1981, 1999 |
16 |
2005 |
0.53 |
1991 |
4 |
1.17 |
|
17 Nov |
53 |
27 |
73 |
1975 |
12 |
2000, 2014 |
0.48 |
1983 |
6 |
1.26 |
|
18 Nov |
52 |
27 |
69 |
2008 |
10 |
2000 |
0.37 |
1986 |
7 |
0.80 |
|
19 Nov |
51 |
26 |
71 |
2007 |
8 |
1985 |
0.08 |
2004 |
6 |
0.26 |
|
20 Nov |
51 |
26 |
64 |
2007 |
13 |
1980, 1985 |
0.20 |
2016 |
9 |
0.92 |
|
21 Nov |
51 |
27 |
64 |
2006 |
16 |
1993 |
0.47 |
2013 |
7 |
0.99 |
|
22 Nov |
50 |
27 |
65 |
2006 |
11 |
1975 |
0.25 |
2001 |
8 |
0.76 |
|
23 Nov |
49 |
26 |
63 |
1981, 1998 |
9 |
1999 |
0.44 |
2000 |
3 |
0.64 |
|
24 Nov |
48 |
24 |
66 |
1981 |
8 |
1979 |
0.21 |
1978 |
9 |
0.71 |
|
25 Nov |
49 |
25 |
64 |
1970 |
6 |
2010 |
0.54 |
1978 |
7 |
1.65 |
|
26 Nov |
47 |
25 |
64 |
1995 |
7 |
1975, 1992, 2010 |
0.20 |
1996 |
9 |
0.47 |
|
27 Nov |
45 |
24 |
67 |
1998 |
8 |
1993 |
0.43 |
2008 |
6 |
0.69 |
|
28 Nov |
44 |
22 |
63 |
1999 |
4 |
1976 |
0.41 |
1991 |
9 |
1.16 |
|
29 Nov |
44 |
22 |
65 |
1998 |
1 |
1976 |
0.35 |
1996 |
9 |
0.83 |
|
30 Nov |
45 |
22 |
62 |
1999 |
4 |
2006 |
0.38 |
2007 |
2 |
0.55 |
|
*Number of years between 1969 and 2016 in which measurable precipitation (equal to or greater than 0.01 inch) fell on the date. |
||||||||||
|
Table 12. Average High and Low Temperature, High and Low Temperature Extremes and Year(s) of Occurrence, Highest Recorded Precipitation and Year(s) of Occurrence, and Number of Years Precipitation Occurred on each December Date at the NMSU Agricultural Science Center at Farmington, NM, 1969–2016 |
||||||||||
|
Date |
Air Temperature (°F) |
Precipitation (inches) |
||||||||
|
Avg. High |
Avg. Low |
Highest Record |
Year(s) of Highest |
Lowest Record |
Year(s) of Lowest |
Highest |
Year(s) of Highest |
No. Years > 0* |
Total for all Years |
|
|
1 Dec |
46 |
22 |
67 |
1999 |
8 |
1996 |
0.19 |
2002 |
5 |
0.41 |
|
2 Dec |
46 |
24 |
61 |
1995 |
5 |
1991 |
0.18 |
1997 |
4 |
0.25 |
|
3 Dec |
46 |
23 |
59 |
2001, 2010 |
3 |
1991 |
0.07 |
2014 |
4 |
0.18 |
|
4 Dec |
46 |
23 |
63 |
1980 |
1 |
2009 |
0.46 |
2014 |
8 |
1.06 |
|
5 Dec |
45 |
22 |
61 |
1995 |
6 |
2005 |
0.48 |
1986 |
9 |
1.91 |
|
6 Dec |
45 |
21 |
58 |
1995 |
2 |
1972 |
0.21 |
1986 |
6 |
0.41 |
|
7 Dec |
45 |
22 |
63 |
1977 |
-1 |
1978 |
0.25 |
1997 |
11 |
0.84 |
|
8 Dec |
44 |
22 |
61 |
1970 |
-8 |
1978 |
0.25 |
2008 |
7 |
0.70 |
|
9 Dec |
42 |
20 |
58 |
1977 |
-9 |
1978 |
0.14 |
1982 |
6 |
0.48 |
|
10 Dec |
43 |
20 |
59 |
1977 |
-2 |
1978 |
0.14 |
1982 |
6 |
0.48 |
|
11 Dec |
44 |
20 |
63 |
1977 |
-2 |
1978 |
0.38 |
1991 |
5 |
0.97 |
|
12 Dec |
43 |
21 |
57 |
1995, 2014 |
1 |
1978 |
0.40 |
1984 |
9 |
1.10 |
|
13 Dec |
44 |
22 |
57 |
2004 |
8 |
1978 |
0.12 |
2014 |
9 |
0.46 |
|
14 Dec |
41 |
21 |
59 |
2010 |
6 |
1972 |
0.17 |
1984 |
9 |
0.65 |
|
15 Dec |
41 |
18 |
56 |
1977 |
1 |
1987 |
0.22 |
2016 |
10 |
0.94 |
|
16 Dec |
41 |
19 |
56 |
1998, 2016 |
1 |
1987 |
0.18 |
2002 |
7 |
0.59 |
|
17 Dec |
42 |
19 |
55 |
1970, 1980 |
4 |
1992 |
0.12 |
1995 |
8 |
0.44 |
|
18 Dec |
43 |
20 |
58 |
1980 |
3 |
1996 |
0.33 |
1978 |
9 |
1.50 |
|
19 Dec |
42 |
21 |
55 |
1969, 1998, 2003, 2013 |
8 |
1996 |
0.09 |
2011 |
5 |
0.19 |
|
20 Dec |
42 |
21 |
56 |
1981 |
1 |
1992 |
0.11 |
1983 |
6 |
0.29 |
|
21 Dec |
41 |
20 |
56 |
1969 |
-2 |
1992 |
0.13 |
2003 |
9 |
0.63 |
|
22 Dec |
40 |
20 |
55 |
1994 |
2 |
1990, 1992 |
0.45 |
2016 |
15 |
1.80 |
|
23 Dec |
40 |
20 |
53 |
1969, 2005 |
-12 |
1990 |
0.17 |
1994 |
9 |
0.58 |
|
24 Dec |
39 |
18 |
57 |
1971 |
-16 |
1990 |
0.14 |
2016 |
6 |
0.41 |
|
25 Dec |
39 |
18 |
57 |
1971 |
-15 |
1990 |
0.18 |
1983 |
5 |
0.52 |
|
26 Dec |
39 |
17 |
59 |
2005 |
-8 |
1990 |
0.47 |
1979 |
7 |
1.05 |
|
27 Dec |
39 |
18 |
55 |
1980 |
-6 |
1990 |
0.18 |
1979 |
5 |
0.41 |
|
28 Dec |
41 |
19 |
56 |
2004 |
5 |
1990 |
0.26 |
2006 |
9 |
0.74 |
|
29 Dec |
40 |
19 |
60 |
2004 |
1 |
1988 |
0.31 |
2001 |
11 |
1.30 |
|
30 Dec |
40 |
19 |
55 |
2011 |
-5 |
1990 |
0.28 |
1973 |
9 |
0.81 |
|
31 Dec |
39 |
18 |
55 |
1996 |
-8 |
1990 |
0.07 |
1973 |
5 |
0.22 |
|
*Number of years between 1969 and 2016 in which measurable precipitation (equal to or greater than 0.01 inch) fell on the date. |
||||||||||
|
Table 13a. Average (Avg.) and Maximum (Max.) Recorded Wind Run in Miles per 24-hour Day (MPD) and Average (Avg.) Miles per Hour (MPH) for each Day from January 1 to June 30 at the NMSU Agricultural Science Center at Farmington, NM, 1980–2016 |
||||||||||||||||||
|
Day |
January |
February* |
March |
April |
May |
June |
||||||||||||
|
MPD |
MPH |
MPD |
MPH |
MPD |
MPH |
MPD |
MPH |
MPD |
MPH |
MPD |
MPH |
|||||||
|
Avg. |
Max. |
Avg. |
Avg. |
Max. |
Avg. |
Avg. |
Max. |
Avg. |
Avg. |
Max. |
Avg. |
Avg. |
Max. |
Avg. |
Avg. |
Max. |
Avg. |
|
|
1 |
100 |
237 |
4.2 |
111 |
242 |
4.6 |
124 |
246 |
5.2 |
151 |
268 |
6.3 |
159 |
594 |
6.6 |
127 |
309 |
5.3 |
|
2 |
96 |
231 |
4.0 |
117 |
242 |
4.9 |
145 |
282 |
6.0 |
167 |
324 |
7.0 |
154 |
571 |
6.4 |
115 |
217 |
4.8 |
|
3 |
111 |
319 |
4.6 |
115 |
255 |
4.8 |
118 |
235 |
4.9 |
155 |
321 |
6.5 |
122 |
256 |
5.1 |
119 |
182 |
5.0 |
|
4 |
106 |
274 |
4.4 |
103 |
242 |
4.3 |
144 |
375 |
6.0 |
145 |
282 |
6.0 |
132 |
270 |
5.5 |
120 |
189 |
5.0 |
|
5 |
95 |
247 |
3.9 |
111 |
267 |
4.6 |
147 |
462 |
6.1 |
151 |
318 |
6.3 |
134 |
303 |
5.6 |
122 |
238 |
5.1 |
|
6 |
102 |
230 |
4.3 |
104 |
210 |
4.3 |
137 |
282 |
5.7 |
153 |
292 |
6.4 |
132 |
371 |
5.5 |
122 |
269 |
5.1 |
|
7 |
90 |
179 |
3.8 |
111 |
206 |
4.6 |
141 |
301 |
5.9 |
152 |
306 |
6.3 |
135 |
206 |
5.6 |
117 |
212 |
4.9 |
|
8 |
94 |
182 |
3.9 |
112 |
224 |
4.7 |
135 |
311 |
5.6 |
150 |
336 |
6.3 |
136 |
330 |
5.7 |
120 |
229 |
5.0 |
|
9 |
101 |
216 |
4.2 |
103 |
183 |
4.3 |
128 |
260 |
5.3 |
139 |
239 |
5.8 |
130 |
226 |
5.4 |
112 |
241 |
4.7 |
|
10 |
109 |
203 |
4.6 |
134 |
373 |
5.6 |
118 |
207 |
4.9 |
154 |
355 |
6.4 |
143 |
316 |
6.0 |
110 |
207 |
4.6 |
|
11 |
104 |
216 |
4.3 |
114 |
271 |
4.8 |
144 |
356 |
6.0 |
154 |
285 |
6.4 |
147 |
266 |
6.1 |
108 |
274 |
4.5 |
|
12 |
115 |
266 |
4.8 |
120 |
237 |
5.0 |
122 |
239 |
5.1 |
151 |
315 |
6.3 |
134 |
403 |
5.6 |
112 |
190 |
4.7 |
|
13 |
117 |
284 |
4.9 |
121 |
239 |
5.0 |
128 |
242 |
5.3 |
137 |
358 |
5.7 |
125 |
229 |
5.2 |
124 |
259 |
5.2 |
|
14 |
106 |
222 |
4.4 |
145 |
352 |
6.0 |
133 |
280 |
5.5 |
144 |
279 |
6.0 |
129 |
239 |
5.4 |
119 |
201 |
5.0 |
|
15 |
103 |
289 |
4.3 |
122 |
338 |
5.1 |
137 |
238 |
5.7 |
147 |
304 |
6.1 |
127 |
188 |
5.3 |
117 |
264 |
4.9 |
|
16 |
106 |
252 |
4.4 |
133 |
282 |
5.6 |
132 |
265 |
5.5 |
150 |
353 |
6.2 |
125 |
222 |
5.2 |
118 |
208 |
4.9 |
|
17 |
111 |
473 |
4.6 |
122 |
214 |
5.1 |
171 |
406 |
7.1 |
149 |
282 |
6.2 |
118 |
200 |
4.9 |
105 |
198 |
4.4 |
|
18 |
96 |
215 |
4.0 |
132 |
222 |
5.5 |
156 |
343 |
6.5 |
165 |
304 |
6.9 |
117 |
200 |
4.9 |
109 |
228 |
4.6 |
|
19 |
104 |
212 |
4.3 |
140 |
500 |
5.8 |
132 |
268 |
5.5 |
150 |
260 |
6.2 |
132 |
350 |
5.5 |
116 |
196 |
4.8 |
|
20 |
103 |
253 |
4.3 |
133 |
368 |
5.5 |
126 |
289 |
5.2 |
145 |
243 |
6.0 |
125 |
251 |
5.2 |
110 |
190 |
4.6 |
|
21 |
115 |
400 |
4.8 |
116 |
212 |
4.8 |
142 |
258 |
5.9 |
134 |
222 |
5.6 |
128 |
268 |
5.3 |
111 |
241 |
4.6 |
|
22 |
103 |
261 |
4.3 |
134 |
289 |
5.6 |
134 |
236 |
5.6 |
136 |
219 |
5.7 |
127 |
198 |
5.3 |
109 |
169 |
4.5 |
|
23 |
103 |
215 |
4.3 |
130 |
284 |
5.4 |
144 |
328 |
6.0 |
139 |
369 |
5.8 |
119 |
216 |
4.9 |
107 |
182 |
4.4 |
|
24 |
110 |
220 |
4.6 |
135 |
268 |
5.6 |
134 |
295 |
5.6 |
153 |
378 |
6.4 |
123 |
221 |
5.1 |
114 |
194 |
4.8 |
|
25 |
121 |
244 |
5.0 |
126 |
241 |
5.3 |
140 |
302 |
5.9 |
161 |
327 |
6.7 |
114 |
206 |
4.7 |
105 |
192 |
4.4 |
|
26 |
108 |
205 |
4.5 |
119 |
238 |
4.9 |
165 |
417 |
6.9 |
146 |
294 |
6.1 |
126 |
259 |
5.3 |
110 |
228 |
4.6 |
|
27 |
119 |
233 |
4.9 |
121 |
307 |
5.0 |
155 |
458 |
6.5 |
120 |
257 |
5.0 |
119 |
224 |
5.0 |
107 |
184 |
4.5 |
|
28 |
110 |
229 |
4.6 |
125 |
264 |
5.2 |
146 |
306 |
6.1 |
144 |
403 |
6.0 |
119 |
195 |
4.9 |
118 |
206 |
4.9 |
|
29 |
126 |
309 |
5.2 |
128 |
218 |
5.3 |
147 |
335 |
6.1 |
148 |
281 |
6.2 |
122 |
256 |
5.1 |
105 |
168 |
4.4 |
|
30 |
116 |
238 |
4.8 |
159 |
295 |
6.6 |
154 |
401 |
6.4 |
121 |
214 |
5.0 |
109 |
203 |
4.5 |
|||
|
31 |
113 |
197 |
4.7 |
149 |
390 |
6.2 |
114 |
214 |
4.7 |
|||||||||
|
Mean |
107 |
167 |
4.5 |
122 |
255 |
5.3 |
140 |
307 |
5.8 |
148 |
306 |
6.2 |
129 |
273 |
5.4 |
114 |
216 |
4.7 |
|
*Wind data shown for February 29 reflect summaries of 10 (leap) years only. |
||||||||||||||||||
|
Table 13b. Average (Avg.) and Maximum (Max.) Recorded Wind Run in Miles per 24-hour Day (MPD) and Average (Avg.) Miles per Hour (MPH) for each Day from July 1 to December 30 at the NMSU Agricultural Science Center at Farmington, NM, 1980–2016 |
||||||||||||||||||
|
Day |
July |
August |
September |
October |
November |
December |
||||||||||||
|
MPD |
MPH |
MPD |
MPH |
MPD |
MPH |
MPD |
MPH |
MPD |
MPH |
MPD |
MPH |
|||||||
|
Avg. |
Max. |
Avg. |
Avg. |
Max. |
Avg. |
Avg. |
Max. |
Avg. |
Avg. |
Max. |
Avg. |
Avg. |
Max. |
Avg. |
Avg. |
Max. |
Avg. |
|
|
1 |
106 |
182 |
4.4 |
104 |
185 |
4.3 |
99 |
196 |
4.1 |
100 |
157 |
4.2 |
99 |
193 |
4.1 |
109 |
216 |
4.6 |
|
2 |
111 |
228 |
4.6 |
100 |
168 |
4.2 |
94 |
171 |
3.9 |
107 |
165 |
4.5 |
96 |
233 |
4.0 |
108 |
279 |
4.5 |
|
3 |
109 |
208 |
4.5 |
98 |
177 |
4.1 |
93 |
184 |
3.9 |
103 |
211 |
4.3 |
83 |
148 |
3.5 |
97 |
196 |
4.0 |
|
4 |
104 |
177 |
4.3 |
102 |
199 |
4.2 |
99 |
215 |
4.1 |
106 |
298 |
4.4 |
104 |
291 |
4.3 |
89 |
194 |
3.7 |
|
5 |
111 |
182 |
4.6 |
100 |
205 |
4.2 |
88 |
151 |
3.7 |
102 |
198 |
4.2 |
113 |
214 |
4.7 |
100 |
202 |
4.2 |
|
6 |
109 |
188 |
4.5 |
102 |
172 |
4.2 |
94 |
194 |
3.9 |
106 |
208 |
4.4 |
93 |
191 |
3.9 |
94 |
172 |
3.9 |
|
7 |
99 |
196 |
4.1 |
96 |
188 |
4.0 |
110 |
195 |
4.6 |
109 |
246 |
4.5 |
104 |
196 |
4.3 |
116 |
255 |
4.8 |
|
8 |
111 |
209 |
4.6 |
93 |
160 |
3.9 |
103 |
204 |
4.3 |
101 |
215 |
4.2 |
100 |
232 |
4.2 |
96 |
222 |
4.0 |
|
9 |
103 |
189 |
4.3 |
102 |
185 |
4.3 |
100 |
192 |
4.2 |
103 |
175 |
4.3 |
116 |
300 |
4.8 |
105 |
252 |
4.4 |
|
10 |
96 |
151 |
4.0 |
110 |
188 |
4.6 |
100 |
176 |
4.2 |
101 |
181 |
4.2 |
115 |
252 |
4.8 |
88 |
181 |
3.7 |
|
11 |
101 |
159 |
4.2 |
101 |
172 |
4.2 |
102 |
366 |
4.2 |
105 |
230 |
4.4 |
101 |
220 |
4.2 |
93 |
189 |
3.9 |
|
12 |
94 |
158 |
3.9 |
95 |
208 |
4.0 |
98 |
214 |
4.1 |
107 |
250 |
4.5 |
98 |
260 |
4.1 |
116 |
230 |
4.8 |
|
13 |
102 |
210 |
4.3 |
108 |
206 |
4.5 |
96 |
176 |
4.0 |
108 |
261 |
4.5 |
98 |
179 |
4.1 |
108 |
244 |
4.5 |
|
14 |
103 |
196 |
4.3 |
97 |
159 |
4.0 |
97 |
190 |
4.0 |
101 |
220 |
4.2 |
115 |
304 |
4.8 |
118 |
306 |
4.9 |
|
15 |
110 |
194 |
4.6 |
107 |
178 |
4.5 |
106 |
201 |
4.4 |
98 |
195 |
4.1 |
113 |
337 |
4.7 |
113 |
273 |
4.7 |
|
16 |
104 |
146 |
4.3 |
94 |
173 |
3.9 |
97 |
191 |
4.0 |
96 |
195 |
4.1 |
113 |
337 |
4.7 |
113 |
273 |
4.7 |
|
17 |
102 |
166 |
4.3 |
102 |
214 |
4.3 |
94 |
181 |
3.9 |
108 |
249 |
4.5 |
108 |
271 |
4.5 |
107 |
297 |
4.5 |
|
18 |
109 |
169 |
4.5 |
97 |
183 |
4.0 |
103 |
196 |
4.3 |
103 |
188 |
4.3 |
98 |
259 |
4.1 |
99 |
241 |
4.1 |
|
19 |
101 |
175 |
4.2 |
98 |
192 |
4.1 |
95 |
189 |
4.0 |
112 |
212 |
4.7 |
100 |
335 |
4.2 |
105 |
283 |
4.4 |
|
20 |
104 |
201 |
4.3 |
97 |
186 |
4.1 |
97 |
185 |
4.1 |
109 |
259 |
4.5 |
107 |
204 |
4.5 |
96 |
308 |
4.0 |
|
21 |
103 |
232 |
4.3 |
92 |
163 |
3.8 |
105 |
188 |
4.4 |
103 |
226 |
4.3 |
101 |
229 |
4.2 |
110 |
322 |
4.6 |
|
22 |
98 |
184 |
4.1 |
95 |
180 |
4.0 |
100 |
204 |
4.1 |
99 |
240 |
4.1 |
113 |
218 |
4.7 |
107 |
260 |
4.5 |
|
23 |
98 |
150 |
4.1 |
95 |
196 |
3.9 |
96 |
208 |
4.0 |
95 |
202 |
3.9 |
109 |
238 |
4.5 |
114 |
339 |
4.7 |
|
24 |
99 |
162 |
4.1 |
104 |
244 |
4.3 |
92 |
164 |
3.8 |
91 |
188 |
3.8 |
105 |
206 |
4.4 |
111 |
274 |
4.6 |
|
25 |
103 |
175 |
4.3 |
91 |
157 |
3.8 |
93 |
157 |
3.9 |
97 |
203 |
4.1 |
104 |
297 |
4.4 |
98 |
259 |
4.1 |
|
26 |
108 |
173 |
4.5 |
87 |
146 |
3.6 |
100 |
238 |
4.2 |
107 |
224 |
4.5 |
119 |
292 |
5.0 |
91 |
231 |
3.8 |
|
27 |
97 |
147 |
4.1 |
96 |
162 |
4.0 |
103 |
203 |
4.3 |
101 |
174 |
4.2 |
109 |
370 |
4.6 |
103 |
287 |
4.3 |
|
28 |
101 |
165 |
4.2 |
100 |
222 |
4.2 |
102 |
324 |
4.2 |
99 |
179 |
4.1 |
116 |
225 |
4.8 |
103 |
283 |
4.3 |
|
29 |
109 |
232 |
4.5 |
95 |
153 |
4.0 |
106 |
203 |
4.4 |
114 |
246 |
4.8 |
118 |
258 |
4.9 |
87 |
216 |
3.6 |
|
30 |
102 |
161 |
4.3 |
98 |
173 |
4.1 |
104 |
219 |
4.3 |
99 |
177 |
4.1 |
115 |
262 |
4.8 |
84 |
179 |
3.5 |
|
31 |
97 |
186 |
4.1 |
98 |
206 |
4.1 |
103 |
291 |
4.3 |
108 |
260 |
4.5 |
||||||
|
Mean |
103 |
182 |
4.3 |
99 |
184 |
4.3 |
99 |
203 |
4.1 |
103 |
215 |
4.3 |
106 |
247 |
4.4 |
102 |
249 |
4.3 |
|
Table 14a. Average Maximum (Max.), Average Minimum (Min.), and Average (Avg.) Relative Humidity ([Max. + Min.] / 2) for each Day from January 1 to June 30 at the NMSU Agricultural Science Center at Farmington, NM, 1980–2016 |
||||||||||||||||||
|
Day |
January |
February* |
March |
April |
May |
June |
||||||||||||
|
Max. |
Min. |
Avg. |
Max. |
Min. |
Avg. |
Max. |
Min. |
Avg. |
Max. |
Min. |
Avg. |
Max. |
Min. |
Avg. |
Max. |
Min. |
Avg. |
|
|
1 |
85 |
41 |
63 |
89 |
42 |
65 |
80 |
31 |
55 |
67 |
17 |
42 |
72 |
19 |
46 |
49 |
11 |
30 |
|
2 |
85 |
41 |
63 |
87 |
39 |
63 |
79 |
26 |
53 |
71 |
21 |
46 |
72 |
22 |
47 |
51 |
12 |
32 |
|
3 |
87 |
45 |
66 |
86 |
35 |
60 |
77 |
23 |
50 |
76 |
20 |
48 |
67 |
19 |
43 |
51 |
13 |
32 |
|
4 |
86 |
44 |
65 |
88 |
36 |
62 |
75 |
23 |
49 |
73 |
19 |
46 |
66 |
16 |
41 |
56 |
11 |
34 |
|
5 |
90 |
47 |
68 |
85 |
34 |
59 |
71 |
21 |
46 |
66 |
20 |
43 |
61 |
14 |
38 |
55 |
13 |
34 |
|
6 |
88 |
44 |
66 |
85 |
33 |
59 |
70 |
22 |
46 |
68 |
20 |
44 |
59 |
15 |
37 |
53 |
11 |
32 |
|
7 |
85 |
44 |
64 |
84 |
31 |
57 |
76 |
26 |
51 |
65 |
21 |
43 |
63 |
16 |
40 |
48 |
13 |
31 |
|
8 |
87 |
43 |
65 |
84 |
36 |
60 |
80 |
25 |
53 |
66 |
19 |
42 |
61 |
16 |
38 |
51 |
13 |
32 |
|
9 |
87 |
41 |
64 |
87 |
36 |
62 |
78 |
21 |
49 |
64 |
22 |
43 |
61 |
17 |
39 |
59 |
12 |
36 |
|
10 |
85 |
43 |
64 |
85 |
37 |
61 |
76 |
24 |
50 |
67 |
19 |
43 |
63 |
14 |
39 |
58 |
13 |
36 |
|
11 |
88 |
38 |
63 |
81 |
36 |
59 |
76 |
22 |
49 |
63 |
20 |
42 |
58 |
14 |
36 |
53 |
11 |
32 |
|
12 |
85 |
40 |
62 |
81 |
34 |
57 |
74 |
24 |
49 |
64 |
18 |
41 |
61 |
17 |
39 |
51 |
12 |
31 |
|
13 |
85 |
40 |
63 |
84 |
31 |
58 |
73 |
22 |
47 |
68 |
18 |
43 |
63 |
15 |
39 |
55 |
12 |
34 |
|
14 |
84 |
39 |
62 |
85 |
31 |
58 |
72 |
19 |
45 |
60 |
15 |
38 |
61 |
15 |
38 |
53 |
13 |
33 |
|
15 |
83 |
37 |
60 |
83 |
31 |
57 |
73 |
18 |
46 |
58 |
16 |
37 |
63 |
15 |
39 |
52 |
11 |
32 |
|
16 |
87 |
42 |
65 |
82 |
31 |
56 |
73 |
18 |
45 |
62 |
15 |
39 |
67 |
15 |
41 |
49 |
11 |
30 |
|
17 |
85 |
41 |
63 |
76 |
26 |
51 |
71 |
21 |
46 |
64 |
17 |
40 |
63 |
17 |
40 |
50 |
11 |
30 |
|
18 |
85 |
39 |
62 |
79 |
28 |
54 |
73 |
21 |
47 |
65 |
17 |
41 |
64 |
15 |
39 |
50 |
11 |
30 |
|
19 |
88 |
36 |
62 |
83 |
26 |
55 |
69 |
23 |
46 |
63 |
17 |
40 |
61 |
16 |
39 |
49 |
11 |
30 |
|
20 |
87 |
39 |
63 |
81 |
30 |
56 |
68 |
18 |
43 |
59 |
18 |
38 |
63 |
15 |
39 |
52 |
12 |
32 |
|
21 |
85 |
40 |
62 |
80 |
28 |
54 |
69 |
20 |
45 |
68 |
18 |
43 |
62 |
15 |
39 |
49 |
12 |
31 |
|
22 |
84 |
41 |
62 |
79 |
28 |
53 |
67 |
20 |
44 |
66 |
20 |
43 |
59 |
15 |
37 |
49 |
11 |
30 |
|
23 |
84 |
40 |
62 |
80 |
25 |
52 |
61 |
19 |
40 |
70 |
18 |
44 |
61 |
17 |
39 |
50 |
11 |
31 |
|
24 |
83 |
37 |
60 |
77 |
26 |
51 |
66 |
20 |
43 |
70 |
22 |
46 |
59 |
16 |
37 |
50 |
13 |
31 |
|
25 |
85 |
39 |
62 |
75 |
29 |
52 |
64 |
19 |
41 |
67 |
19 |
43 |
60 |
15 |
37 |
50 |
14 |
32 |
|
26 |
87 |
41 |
64 |
73 |
24 |
49 |
72 |
22 |
47 |
75 |
16 |
46 |
57 |
14 |
36 |
58 |
15 |
37 |
|
27 |
86 |
38 |
62 |
77 |
25 |
51 |
74 |
20 |
47 |
67 |
18 |
42 |
55 |
13 |
34 |
56 |
15 |
35 |
|
28 |
83 |
39 |
61 |
82 |
33 |
57 |
66 |
21 |
43 |
66 |
16 |
41 |
58 |
13 |
35 |
57 |
13 |
35 |
|
29 |
81 |
36 |
58 |
88 |
23 |
55 |
73 |
20 |
47 |
69 |
17 |
43 |
59 |
14 |
36 |
57 |
14 |
36 |
|
30 |
82 |
39 |
60 |
72 |
19 |
45 |
71 |
19 |
45 |
55 |
14 |
34 |
59 |
14 |
36 |
|||
|
31 |
87 |
39 |
63 |
69 |
18 |
44 |
59 |
12 |
35 |
|||||||||
|
Mean |
85 |
40 |
61 |
82 |
31 |
57 |
72 |
21 |
47 |
67 |
18 |
43 |
62 |
16 |
39 |
53 |
12 |
33 |
|
*Humidity data shown for February 29 reflect summaries of 10 (leap) years only. |
||||||||||||||||||
|
Table 14b. Average Maximum (Max.), Average Minimum (Min.), and Average (Avg.) Relative Humidity ([Max. + Min.] / 2) for each Day from July 1 to December 31 at the NMSU Agricultural Science Center at Farmington, NM, 1980–2016 |
||||||||||||||||||
|
Day |
July |
August |
September |
October |
November |
December |
||||||||||||
|
Max. |
Min. |
Avg. |
Max. |
Min. |
Avg. |
Max. |
Min. |
Avg. |
Max. |
Min. |
Avg. |
Max. |
Min. |
Avg. |
Max. |
Min. |
Avg. |
|
|
1 |
58 |
14 |
36 |
75 |
21 |
48 |
74 |
23 |
59 |
68 |
22 |
45 |
75 |
27 |
51 |
80 |
35 |
57 |
|
2 |
61 |
14 |
37 |
76 |
24 |
50 |
72 |
22 |
47 |
70 |
27 |
48 |
73 |
26 |
49 |
82 |
35 |
59 |
|
3 |
61 |
15 |
38 |
74 |
23 |
49 |
73 |
24 |
48 |
73 |
26 |
50 |
73 |
26 |
49 |
82 |
33 |
57 |
|
4 |
57 |
14 |
36 |
72 |
22 |
47 |
73 |
24 |
49 |
75 |
25 |
50 |
72 |
28 |
50 |
81 |
31 |
56 |
|
5 |
57 |
17 |
37 |
74 |
22 |
48 |
75 |
23 |
49 |
71 |
25 |
48 |
72 |
26 |
49 |
85 |
39 |
62 |
|
6 |
58 |
16 |
37 |
75 |
21 |
48 |
75 |
24 |
50 |
75 |
24 |
50 |
73 |
24 |
48 |
83 |
36 |
60 |
|
7 |
64 |
21 |
42 |
75 |
20 |
47 |
74 |
23 |
49 |
77 |
26 |
51 |
70 |
25 |
47 |
85 |
36 |
61 |
|
8 |
69 |
19 |
44 |
72 |
20 |
46 |
76 |
25 |
50 |
76 |
25 |
51 |
74 |
29 |
52 |
87 |
39 |
63 |
|
9 |
70 |
22 |
46 |
67 |
19 |
43 |
77 |
26 |
52 |
71 |
24 |
47 |
74 |
30 |
52 |
84 |
40 |
62 |
|
10 |
70 |
20 |
45 |
70 |
21 |
45 |
79 |
28 |
54 |
72 |
24 |
48 |
78 |
31 |
54 |
84 |
37 |
61 |
|
11 |
69 |
18 |
43 |
71 |
20 |
46 |
82 |
27 |
54 |
71 |
21 |
46 |
81 |
35 |
58 |
83 |
38 |
60 |
|
12 |
67 |
18 |
42 |
73 |
21 |
47 |
82 |
25 |
54 |
73 |
21 |
47 |
82 |
34 |
58 |
85 |
43 |
64 |
|
13 |
68 |
19 |
44 |
76 |
22 |
49 |
81 |
28 |
54 |
72 |
20 |
46 |
84 |
37 |
60 |
85 |
39 |
62 |
|
14 |
73 |
18 |
45 |
78 |
23 |
51 |
82 |
25 |
54 |
75 |
21 |
48 |
83 |
33 |
58 |
86 |
39 |
63 |
|
15 |
66 |
17 |
42 |
75 |
22 |
48 |
73 |
23 |
48 |
74 |
24 |
49 |
81 |
32 |
56 |
87 |
43 |
65 |
|
16 |
70 |
18 |
44 |
73 |
21 |
47 |
74 |
22 |
48 |
73 |
21 |
47 |
77 |
33 |
55 |
87 |
45 |
66 |
|
17 |
72 |
19 |
45 |
70 |
21 |
45 |
71 |
23 |
47 |
73 |
24 |
48 |
79 |
31 |
55 |
87 |
44 |
65 |
|
18 |
72 |
18 |
45 |
71 |
19 |
45 |
79 |
26 |
52 |
73 |
23 |
48 |
78 |
29 |
53 |
85 |
44 |
64 |
|
19 |
73 |
18 |
46 |
71 |
22 |
47 |
72 |
23 |
47 |
74 |
24 |
49 |
76 |
27 |
52 |
86 |
42 |
64 |
|
20 |
72 |
18 |
45 |
79 |
24 |
51 |
75 |
23 |
49 |
75 |
24 |
49 |
76 |
28 |
52 |
85 |
41 |
63 |
|
21 |
68 |
18 |
43 |
80 |
23 |
51 |
73 |
22 |
47 |
74 |
27 |
51 |
78 |
30 |
54 |
90 |
45 |
68 |
|
22 |
71 |
19 |
45 |
79 |
22 |
51 |
73 |
21 |
47 |
74 |
29 |
52 |
82 |
32 |
57 |
87 |
43 |
65 |
|
23 |
71 |
19 |
45 |
77 |
25 |
51 |
73 |
23 |
48 |
76 |
27 |
52 |
80 |
33 |
56 |
89 |
45 |
67 |
|
24 |
69 |
19 |
44 |
77 |
23 |
50 |
73 |
20 |
47 |
71 |
24 |
27 |
80 |
32 |
56 |
86 |
41 |
64 |
|
25 |
73 |
19 |
46 |
76 |
23 |
50 |
68 |
20 |
44 |
80 |
26 |
53 |
79 |
30 |
54 |
88 |
44 |
66 |
|
26 |
74 |
20 |
47 |
73 |
27 |
50 |
69 |
22 |
46 |
77 |
31 |
54 |
78 |
30 |
54 |
88 |
41 |
65 |
|
27 |
72 |
20 |
46 |
73 |
25 |
49 |
69 |
18 |
44 |
76 |
29 |
53 |
77 |
32 |
55 |
87 |
45 |
66 |
|
28 |
73 |
19 |
46 |
78 |
24 |
51 |
68 |
22 |
45 |
74 |
31 |
53 |
84 |
33 |
58 |
86 |
43 |
64 |
|
29 |
72 |
19 |
46 |
71 |
21 |
46 |
68 |
23 |
45 |
77 |
28 |
53 |
82 |
36 |
59 |
88 |
43 |
64 |
|
30 |
76 |
22 |
49 |
69 |
20 |
45 |
66 |
22 |
44 |
74 |
27 |
50 |
82 |
36 |
59 |
89 |
46 |
68 |
|
31 |
75 |
23 |
49 |
72 |
23 |
48 |
75 |
27 |
51 |
89 |
52 |
70 |
||||||
|
Mean |
68 |
18 |
43 |
74 |
22 |
48 |
74 |
23 |
47 |
74 |
25 |
49 |
78 |
30 |
54 |
86 |
41 |
63 |
|
Table 15. Average Daily Global Solar Radiation in Langleys/Day (gram calories per square centimeter per day) as Measured with Pyranometers at the NMSU Agricultural Science Center at Farmington, NM, 1976–2016* |
||||||||||||
|
Day |
Jan |
Feb** |
Mar |
Apr |
May |
June |
July |
Aug |
Sep |
Oct |
Nov |
Dec |
|
1 |
207 |
262 |
338 |
445 |
541 |
652 |
646 |
565 |
487 |
422 |
301 |
231 |
|
2 |
197 |
262 |
370 |
459 |
563 |
669 |
637 |
551 |
526 |
400 |
300 |
206 |
|
3 |
199 |
279 |
369 |
488 |
560 |
647 |
652 |
559 |
499 |
389 |
281 |
227 |
|
4 |
211 |
266 |
357 |
494 |
582 |
637 |
644 |
549 |
500 |
369 |
274 |
218 |
|
5 |
187 |
295 |
387 |
496 |
566 |
655 |
645 |
549 |
495 |
395 |
289 |
202 |
|
6 |
196 |
302 |
372 |
516 |
579 |
656 |
635 |
578 |
497 |
382 |
294 |
203 |
|
7 |
209 |
295 |
368 |
511 |
592 |
665 |
604 |
553 |
498 |
386 |
277 |
208 |
|
8 |
224 |
277 |
388 |
528 |
593 |
628 |
596 |
574 |
483 |
387 |
257 |
217 |
|
9 |
220 |
288 |
409 |
510 |
578 |
635 |
599 |
587 |
458 |
382 |
245 |
220 |
|
10 |
212 |
301 |
392 |
506 |
592 |
666 |
626 |
547 |
454 |
381 |
274 |
213 |
|
11 |
215 |
300 |
398 |
523 |
627 |
657 |
630 |
573 |
465 |
384 |
242 |
214 |
|
12 |
222 |
306 |
387 |
523 |
614 |
655 |
624 |
565 |
461 |
374 |
256 |
195 |
|
13 |
241 |
320 |
419 |
534 |
578 |
668 |
597 |
543 |
454 |
381 |
245 |
206 |
|
14 |
235 |
287 |
400 |
548 |
596 |
673 |
637 |
528 |
450 |
376 |
253 |
203 |
|
15 |
220 |
310 |
421 |
544 |
572 |
665 |
633 |
530 |
477 |
367 |
256 |
203 |
|
16 |
224 |
304 |
431 |
544 |
569 |
668 |
614 |
539 |
460 |
355 |
252 |
196 |
|
17 |
220 |
308 |
405 |
546 |
597 |
670 |
626 |
543 |
461 |
324 |
256 |
204 |
|
18 |
239 |
310 |
440 |
563 |
570 |
673 |
628 |
538 |
446 |
349 |
267 |
198 |
|
19 |
229 |
301 |
418 |
552 |
583 |
661 |
615 |
535 |
461 |
357 |
256 |
198 |
|
20 |
242 |
299 |
425 |
577 |
579 |
664 |
619 |
512 |
459 |
350 |
253 |
212 |
|
21 |
238 |
312 |
452 |
543 |
578 |
659 |
603 |
525 |
440 |
314 |
224 |
182 |
|
22 |
240 |
330 |
441 |
532 |
617 |
693 |
600 |
520 |
426 |
328 |
230 |
183 |
|
23 |
240 |
334 |
449 |
517 |
586 |
677 |
594 |
520 |
443 |
342 |
238 |
199 |
|
24 |
236 |
328 |
464 |
506 |
584 |
657 |
587 |
497 |
446 |
325 |
238 |
206 |
|
25 |
230 |
347 |
462 |
528 |
600 |
641 |
587 |
501 |
459 |
307 |
222 |
197 |
|
26 |
241 |
338 |
435 |
550 |
617 |
634 |
569 |
519 |
453 |
324 |
214 |
198 |
|
27 |
260 |
331 |
455 |
597 |
653 |
656 |
584 |
516 |
442 |
305 |
237 |
199 |
|
28 |
247 |
329 |
414 |
548 |
644 |
628 |
559 |
519 |
434 |
314 |
226 |
212 |
|
29 |
259 |
389 |
448 |
552 |
639 |
609 |
584 |
528 |
418 |
311 |
224 |
195 |
|
30 |
237 |
468 |
619 |
635 |
634 |
578 |
525 |
447 |
322 |
228 |
199 |
|
|
31 |
239 |
469 |
652 |
571 |
489 |
300 |
189 |
|||||
|
Total |
7,017 |
8,910 |
12,850 |
15,897 |
18,434 |
19,651 |
18,925 |
16,676 |
13,899 |
11,003 |
7,611 |
6,333 |
|
Mean |
226 |
307 |
415 |
530 |
595 |
655 |
610 |
538 |
463 |
355 |
254 |
204 |
|
*Solar radiation was measured in Langleys per day (Ly d-1) at the National Weather Service installation (WS-1) from 1972 through 2011. Solar radiation was then measured in megajoules per square meter per day (MJ m-2 d-1) at the New Mexico Climate Center weather station (WS-2) from 2012 to 2016, and converted to Langleys per day (MJ m-2 d-1 × 23.89 = Ly d-1). |
||||||||||||
|
Table 16. Average Daily Pan Evaporation in Inches (PAN) from April 1 to October 31 for Number of Years Indicated (N) at the NMSU Agricultural Science Center at Farmington, NM, 1972–2016 |
||||||||||||||
|
April |
May |
June |
July |
August |
September |
October |
||||||||
|
Day |
PAN |
N |
PAN |
N |
PAN |
N |
PAN |
N |
PAN |
N |
PAN |
N |
PAN |
N |
|
1 |
0.25 |
26 |
0.31 |
41 |
0.40 |
44 |
0.48 |
40 |
0.39 |
43 |
0.33 |
44 |
0.24 |
44 |
|
2 |
0.26 |
28 |
0.29 |
41 |
0.44 |
44 |
0.44 |
40 |
0.38 |
44 |
0.34 |
45 |
0.25 |
43 |
|
3 |
0.26 |
33 |
0.31 |
41 |
0.40 |
44 |
0.46 |
40 |
0.38 |
45 |
0.33 |
45 |
0.25 |
43 |
|
4 |
0.23 |
36 |
0.33 |
42 |
0.42 |
44 |
0.45 |
40 |
0.41 |
45 |
0.30 |
45 |
0.22 |
43 |
|
5 |
0.26 |
36 |
0.33 |
42 |
0.42 |
44 |
0.46 |
40 |
0.38 |
45 |
0.33 |
45 |
0.20 |
44 |
|
6 |
0.27 |
36 |
0.34 |
42 |
0.41 |
43 |
0.46 |
40 |
0.38 |
44 |
0.31 |
45 |
0.22 |
44 |
|
7 |
0.26 |
36 |
0.34 |
42 |
0.42 |
44 |
0.42 |
40 |
0.34 |
44 |
0.31 |
45 |
0.22 |
44 |
|
8 |
0.29 |
36 |
0.33 |
43 |
0.43 |
44 |
0.42 |
40 |
0.39 |
45 |
0.31 |
45 |
0.20 |
43 |
|
9 |
0.27 |
36 |
0.32 |
43 |
0.39 |
44 |
0.39 |
40 |
0.38 |
45 |
0.29 |
45 |
0.22 |
39 |
|
10 |
0.23 |
36 |
0.36 |
43 |
0.41 |
44 |
0.45 |
39 |
0.38 |
45 |
0.28 |
45 |
0.21 |
40 |
|
11 |
0.28 |
36 |
0.37 |
42 |
0.44 |
44 |
0.42 |
39 |
0.38 |
45 |
0.27 |
44 |
0.22 |
40 |
|
12 |
0.26 |
36 |
0.36 |
42 |
0.45 |
44 |
0.43 |
39 |
0.38 |
45 |
0.30 |
45 |
0.20 |
40 |
|
13 |
0.26 |
36 |
0.35 |
53 |
0.44 |
44 |
0.40 |
40 |
0.36 |
45 |
0.26 |
45 |
0.23 |
39 |
|
14 |
0.29 |
35 |
0.36 |
43 |
0.46 |
44 |
0.44 |
40 |
0.37 |
45 |
0.29 |
45 |
0.18 |
40 |
|
15 |
0.34 |
36 |
0.34 |
43 |
0.45 |
44 |
0.43 |
40 |
0.37 |
45 |
0.26 |
45 |
0.20 |
39 |
|
16 |
0.29 |
37 |
0.36 |
44 |
0.44 |
44 |
0.42 |
39 |
0.37 |
45 |
0.29 |
45 |
0.20 |
38 |
|
17 |
0.27 |
37 |
0.35 |
44 |
0.46 |
45 |
0.39 |
40 |
0.36 |
45 |
0.28 |
44 |
0.20 |
38 |
|
18 |
0.30 |
37 |
0.36 |
44 |
0.45 |
45 |
0.42 |
40 |
0.36 |
45 |
0.28 |
44 |
0.20 |
37 |
|
19 |
0.32 |
37 |
0.33 |
44 |
0.47 |
45 |
0.39 |
40 |
0.34 |
45 |
0.28 |
45 |
0.19 |
39 |
|
20 |
0.32 |
37 |
0.36 |
44 |
0.44 |
44 |
0.45 |
40 |
0.34 |
45 |
0.26 |
45 |
0.18 |
37 |
|
21 |
0.29 |
37 |
0.37 |
44 |
0.44 |
44 |
0.40 |
40 |
0.33 |
45 |
0.28 |
44 |
0.15 |
35 |
|
22 |
0.29 |
37 |
0.35 |
44 |
0.50 |
44 |
0.41 |
40 |
0.33 |
45 |
0.26 |
45 |
0.15 |
36 |
|
23 |
0.30 |
39 |
0.35 |
44 |
0.46 |
44 |
0.40 |
40 |
0.33 |
45 |
0.24 |
45 |
0.17 |
35 |
|
24 |
0.28 |
39 |
0.40 |
44 |
0.45 |
45 |
0.42 |
39 |
0.34 |
45 |
0.25 |
44 |
0.16 |
36 |
|
25 |
0.28 |
39 |
0.35 |
44 |
0.43 |
45 |
0.39 |
40 |
0.34 |
45 |
0.26 |
42 |
0.14 |
33 |
|
26 |
0.28 |
39 |
0.37 |
44 |
0.46 |
45 |
0.37 |
40 |
0.31 |
45 |
0.27 |
43 |
0.14 |
35 |
|
27 |
0.27 |
41 |
0.40 |
43 |
0.44 |
45 |
0.39 |
40 |
0.33 |
45 |
0.26 |
45 |
0.15 |
36 |
|
28 |
0.31 |
42 |
0.41 |
44 |
0.46 |
45 |
0.38 |
40 |
0.33 |
45 |
0.26 |
45 |
0.13 |
35 |
|
29 |
0.32 |
42 |
0.38 |
44 |
0.44 |
45 |
0.38 |
40 |
0.33 |
45 |
0.26 |
45 |
0.14 |
35 |
|
30 |
0.33 |
40 |
0.39 |
44 |
0.47 |
44 |
0.41 |
40 |
0.35 |
44 |
0.28 |
45 |
0.14 |
34 |
|
31 |
0.43 |
44 |
0.39 |
38 |
0.32 |
45 |
0.12 |
7 |
||||||
|
Total |
7.40 |
10.78 |
12.97 |
12.88 |
11.04 |
8.43 |
5.09 |
|||||||
|
Mean |
0.28 |
0.35 |
0.44 |
0.42 |
0.36 |
0.28 |
0.19 |
|||||||
|
Table 17a. Average Maximum (Max.), Average Minimum (Min.), and Average (Avg.) Soil Temperature ([Max + Min] / 2) for each Day from January 1 to June 30 at the NMSU Agricultural Science Center at Farmington, NM, 2001–2016 |
||||||||||||||||||
|
Day |
January |
February* |
March |
April |
May |
June |
||||||||||||
|
Max. |
Min. |
Avg. |
Max. |
Min. |
Avg. |
Max. |
Min. |
Avg. |
Max. |
Min. |
Avg. |
Max. |
Min. |
Avg. |
Max. |
Min. |
Avg. |
|
|
1 |
31 |
28 |
29 |
35 |
31 |
33 |
45 |
35 |
40 |
61 |
46 |
54 |
71 |
53 |
62 |
84 |
66 |
75 |
|
2 |
31 |
28 |
29 |
34 |
31 |
32 |
44 |
35 |
40 |
61 |
47 |
54 |
70 |
53 |
62 |
85 |
67 |
76 |
|
3 |
31 |
27 |
29 |
35 |
30 |
32 |
46 |
35 |
41 |
61 |
45 |
53 |
71 |
53 |
62 |
85 |
69 |
77 |
|
4 |
31 |
27 |
29 |
35 |
30 |
33 |
47 |
36 |
42 |
61 |
47 |
54 |
71 |
53 |
62 |
84 |
69 |
77 |
|
5 |
31 |
27 |
29 |
35 |
30 |
33 |
47 |
37 |
42 |
62 |
47 |
55 |
74 |
55 |
64 |
84 |
69 |
76 |
|
6 |
30 |
27 |
29 |
36 |
30 |
33 |
48 |
36 |
42 |
62 |
47 |
55 |
74 |
55 |
64 |
84 |
69 |
76 |
|
7 |
31 |
27 |
29 |
36 |
31 |
33 |
50 |
38 |
44 |
61 |
46 |
54 |
74 |
56 |
65 |
85 |
69 |
77 |
|
8 |
31 |
28 |
30 |
37 |
31 |
34 |
51 |
38 |
44 |
63 |
47 |
55 |
74 |
57 |
65 |
86 |
69 |
78 |
|
9 |
31 |
28 |
30 |
37 |
31 |
34 |
49 |
37 |
43 |
64 |
48 |
56 |
74 |
57 |
65 |
86 |
69 |
78 |
|
10 |
31 |
28 |
30 |
37 |
32 |
34 |
50 |
38 |
44 |
64 |
48 |
56 |
74 |
57 |
65 |
85 |
70 |
77 |
|
11 |
32 |
29 |
30 |
37 |
31 |
34 |
51 |
39 |
45 |
62 |
49 |
55 |
75 |
58 |
66 |
86 |
69 |
78 |
|
12 |
32 |
28 |
30 |
36 |
32 |
34 |
52 |
39 |
45 |
63 |
48 |
56 |
75 |
58 |
66 |
84 |
69 |
77 |
|
13 |
32 |
28 |
30 |
37 |
32 |
35 |
53 |
40 |
46 |
65 |
49 |
57 |
76 |
58 |
67 |
83 |
68 |
76 |
|
14 |
32 |
28 |
30 |
39 |
33 |
36 |
54 |
41 |
47 |
67 |
49 |
58 |
76 |
59 |
68 |
84 |
68 |
76 |
|
15 |
32 |
28 |
30 |
39 |
33 |
36 |
55 |
41 |
48 |
67 |
51 |
59 |
77 |
61 |
69 |
86 |
69 |
78 |
|
16 |
31 |
28 |
30 |
40 |
33 |
37 |
55 |
41 |
47 |
66 |
50 |
58 |
77 |
61 |
69 |
86 |
71 |
78 |
|
17 |
31 |
27 |
29 |
41 |
34 |
37 |
56 |
41 |
49 |
67 |
52 |
59 |
77 |
62 |
69 |
88 |
72 |
80 |
|
18 |
31 |
28 |
29 |
42 |
34 |
38 |
56 |
43 |
49 |
67 |
51 |
59 |
79 |
62 |
71 |
88 |
72 |
80 |
|
19 |
32 |
28 |
30 |
43 |
35 |
39 |
56 |
42 |
49 |
67 |
50 |
58 |
79 |
62 |
71 |
90 |
72 |
81 |
|
20 |
33 |
29 |
31 |
44 |
35 |
39 |
55 |
42 |
48 |
69 |
51 |
60 |
79 |
62 |
71 |
89 |
72 |
80 |
|
21 |
33 |
29 |
31 |
43 |
35 |
39 |
56 |
42 |
49 |
67 |
53 |
60 |
80 |
62 |
71 |
89 |
72 |
80 |
|
22 |
32 |
30 |
31 |
44 |
24 |
29 |
57 |
43 |
50 |
68 |
52 |
60 |
80 |
61 |
71 |
89 |
73 |
81 |
|
23 |
32 |
29 |
30 |
43 |
35 |
39 |
58 |
44 |
51 |
69 |
53 |
61 |
79 |
62 |
70 |
90 |
74 |
82 |
|
24 |
33 |
30 |
31 |
43 |
35 |
39 |
58 |
43 |
50 |
69 |
51 |
60 |
77 |
61 |
69 |
91 |
75 |
83 |
|
25 |
33 |
30 |
31 |
43 |
35 |
39 |
59 |
44 |
51 |
69 |
52 |
60 |
79 |
62 |
70 |
91 |
75 |
83 |
|
26 |
34 |
30 |
32 |
44 |
35 |
39 |
59 |
43 |
51 |
69 |
52 |
61 |
81 |
63 |
72 |
90 |
75 |
83 |
|
27 |
33 |
30 |
32 |
44 |
35 |
40 |
58 |
43 |
50 |
69 |
53 |
61 |
81 |
64 |
73 |
90 |
74 |
82 |
|
28 |
35 |
30 |
33 |
43 |
34 |
39 |
60 |
42 |
51 |
71 |
53 |
62 |
82 |
64 |
73 |
91 |
75 |
83 |
|
29 |
34 |
31 |
33 |
44 |
35 |
39 |
58 |
44 |
51 |
70 |
54 |
62 |
83 |
65 |
74 |
91 |
75 |
83 |
|
30 |
34 |
31 |
32 |
59 |
44 |
52 |
70 |
55 |
63 |
82 |
65 |
74 |
91 |
75 |
83 |
|||
|
31 |
34 |
31 |
32 |
58 |
44 |
51 |
83 |
65 |
74 |
|||||||||
|
Mean |
32 |
29 |
30 |
39 |
33 |
36 |
54 |
40 |
47 |
66 |
50 |
58 |
77 |
60 |
68 |
87 |
71 |
79 |
|
*Soil temperature data shown for February 29 reflect summaries of 4 (leap) years only. |
||||||||||||||||||
|
Table 17b. Average Maximum (Max.), Average Minimum (Min.), and Average (Avg.) Soil Temperature ([Max + Min] / 2) for each Day from July 1 to December 31 at the NMSU Agricultural Science Center at Farmington, NM, 2001–2016 |
||||||||||||||||||
|
Day |
July |
August |
September |
October |
November |
December |
||||||||||||
|
Max. |
Min. |
Avg. |
Max. |
Min. |
Avg. |
Max. |
Min. |
Avg. |
Max. |
Min. |
Avg. |
Max. |
Min. |
Avg. |
Max. |
Min. |
Avg. |
|
|
1 |
93 |
75 |
84 |
95 |
76 |
86 |
90 |
73 |
81 |
76 |
60 |
68 |
56 |
44 |
50 |
38 |
32 |
35 |
|
2 |
93 |
75 |
84 |
95 |
76 |
86 |
90 |
73 |
81 |
74 |
60 |
67 |
56 |
44 |
50 |
39 |
33 |
36 |
|
3 |
93 |
75 |
84 |
94 |
75 |
85 |
89 |
73 |
81 |
75 |
59 |
67 |
55 |
43 |
49 |
39 |
33 |
36 |
|
4 |
94 |
76 |
85 |
94 |
75 |
85 |
87 |
72 |
80 |
73 |
59 |
66 |
55 |
43 |
49 |
39 |
33 |
36 |
|
5 |
95 |
76 |
85 |
93 |
76 |
84 |
86 |
71 |
78 |
72 |
57 |
64 |
55 |
42 |
49 |
37 |
30 |
33 |
|
6 |
94 |
77 |
86 |
93 |
75 |
84 |
87 |
71 |
79 |
69 |
57 |
63 |
53 |
42 |
47 |
35 |
30 |
33 |
|
7 |
94 |
77 |
86 |
93 |
75 |
84 |
86 |
69 |
78 |
69 |
54 |
61 |
54 |
42 |
48 |
36 |
30 |
33 |
|
8 |
93 |
77 |
85 |
91 |
74 |
82 |
84 |
68 |
76 |
68 |
54 |
61 |
53 |
42 |
47 |
36 |
31 |
33 |
|
9 |
94 |
76 |
85 |
93 |
74 |
83 |
83 |
67 |
75 |
67 |
52 |
60 |
53 |
43 |
48 |
36 |
30 |
33 |
|
10 |
94 |
75 |
85 |
94 |
74 |
84 |
81 |
67 |
74 |
68 |
52 |
60 |
53 |
42 |
48 |
34 |
30 |
32 |
|
11 |
94 |
75 |
84 |
95 |
76 |
86 |
81 |
66 |
73 |
66 |
52 |
59 |
52 |
42 |
47 |
34 |
30 |
32 |
|
12 |
96 |
75 |
85 |
94 |
76 |
85 |
82 |
65 |
74 |
67 |
51 |
59 |
50 |
41 |
46 |
34 |
30 |
32 |
|
13 |
96 |
76 |
86 |
94 |
76 |
85 |
82 |
66 |
74 |
66 |
51 |
59 |
50 |
41 |
45 |
34 |
30 |
32 |
|
14 |
97 |
76 |
87 |
93 |
76 |
84 |
83 |
66 |
74 |
65 |
49 |
57 |
48 |
40 |
44 |
34 |
30 |
32 |
|
15 |
97 |
77 |
87 |
93 |
74 |
84 |
81 |
66 |
73 |
65 |
50 |
58 |
48 |
38 |
43 |
35 |
29 |
32 |
|
16 |
97 |
78 |
87 |
91 |
74 |
83 |
81 |
65 |
73 |
65 |
50 |
58 |
46 |
37 |
42 |
33 |
29 |
31 |
|
17 |
99 |
79 |
89 |
92 |
73 |
82 |
80 |
65 |
72 |
66 |
51 |
58 |
46 |
37 |
42 |
33 |
29 |
31 |
|
18 |
98 |
78 |
88 |
92 |
73 |
83 |
78 |
63 |
71 |
63 |
52 |
58 |
47 |
36 |
42 |
33 |
29 |
31 |
|
19 |
98 |
79 |
89 |
92 |
74 |
83 |
79 |
61 |
70 |
63 |
50 |
56 |
47 |
37 |
42 |
33 |
29 |
31 |
|
20 |
98 |
79 |
89 |
92 |
74 |
73 |
79 |
61 |
70 |
63 |
50 |
56 |
47 |
37 |
42 |
33 |
29 |
31 |
|
21 |
96 |
80 |
88 |
91 |
74 |
82 |
78 |
63 |
71 |
63 |
50 |
56 |
47 |
37 |
42 |
33 |
30 |
31 |
|
22 |
96 |
80 |
88 |
91 |
73 |
82 |
78 |
61 |
70 |
62 |
49 |
55 |
46 |
36 |
41 |
33 |
30 |
32 |
|
23 |
96 |
80 |
88 |
90 |
74 |
82 |
76 |
61 |
68 |
60 |
47 |
53 |
45 |
35 |
40 |
33 |
29 |
31 |
|
24 |
96 |
79 |
88 |
90 |
73 |
82 |
77 |
59 |
68 |
59 |
46 |
52 |
43 |
34 |
38 |
33 |
29 |
31 |
|
25 |
97 |
78 |
88 |
90 |
73 |
82 |
79 |
60 |
69 |
60 |
47 |
53 |
40 |
33 |
37 |
33 |
28 |
30 |
|
26 |
95 |
77 |
86 |
91 |
74 |
83 |
79 |
60 |
70 |
58 |
46 |
52 |
40 |
33 |
37 |
32 |
27 |
30 |
|
27 |
95 |
78 |
86 |
91 |
74 |
82 |
79 |
62 |
71 |
57 |
45 |
51 |
40 |
33 |
36 |
32 |
27 |
30 |
|
28 |
96 |
77 |
86 |
89 |
72 |
81 |
79 |
62 |
71 |
57 |
45 |
51 |
38 |
32 |
35 |
32 |
27 |
30 |
|
29 |
93 |
76 |
85 |
90 |
72 |
81 |
78 |
63 |
70 |
56 |
44 |
50 |
39 |
32 |
35 |
33 |
27 |
30 |
|
30 |
96 |
75 |
85 |
89 |
73 |
81 |
75 |
61 |
68 |
56 |
44 |
50 |
38 |
33 |
36 |
33 |
28 |
30 |
|
31 |
96 |
77 |
86 |
90 |
73 |
81 |
56 |
44 |
50 |
33 |
28 |
30 |
||||||
|
Mean |
96 |
77 |
86 |
92 |
74 |
83 |
82 |
65 |
73 |
65 |
51 |
58 |
48 |
38 |
43 |
34 |
30 |
32 |
|
Table 18. Frost Dates and Number of Consecutive Frost-free Days at the NMSU Agricultural Science Center at Farmington, NM, 1969–2016 |
||||||
|
Less than or equal to 32°F |
Less than or equal to 28°F |
|||||
|
Year |
Last spring frost (date) |
First fall frost (date) |
Frost-free period (days) |
Last spring killing frost (date) |
First fall killing frost (date) |
Killing-frost-free period (days) |
|
1969 |
Apr 27 |
Oct 5 |
161 |
Apr 26 |
Oct 6 |
163 |
|
1970 |
May 2 |
Oct 8 |
159 |
May 1 |
Oct 9 |
161 |
|
1971 |
May 9 |
Sep 18a |
132 |
Apr 27 |
Sep 18a |
144a |
|
1972 |
May 2 |
Oct 30 |
181 |
Apr 27 |
Oct 31 |
187 |
|
1973 |
May 2 |
Oct 11 |
162 |
May 2 |
Oct 27 |
178 |
|
1974 |
May 21 |
Oct 30 |
162 |
May 20 |
Nov 4 |
168 |
|
1975 |
May 8 |
Oct 14 |
159 |
May 7 |
Oct 14 |
160 |
|
1976 |
Apr 27 |
Oct 7 |
163 |
Apr 27 |
Oct 19 |
175 |
|
1977 |
Apr 21 |
Oct 31 |
193b |
Apr 5 |
Nov 2 |
211 |
|
1978 |
May 6 |
Oct 26 |
173 |
May 6 |
Nov 13 |
191 |
|
1979 |
May 12 |
Oct 21 |
162 |
Apr 20 |
Oct 22 |
185 |
|
1980 |
May 26 |
Oct 16 |
143 |
May 25b |
Oct 17 |
145 |
|
1981 |
May 9 |
Oct 16 |
160 |
Apr 5 |
Oct 17 |
195 |
|
1982 |
May 6 |
Oct 6 |
153 |
Apr 21 |
Oct 10 |
172 |
|
1983 |
May 19 |
Sep 21 |
125 |
May 17 |
Nov 9 |
176 |
|
1984 |
May 8 |
Oct 15 |
160 |
May 8 |
Oct 16 |
161 |
|
1985 |
May 14 |
Sep 30 |
139 |
Apr 1 |
Nov 1 |
214 |
|
1986 |
Apr 27 |
Oct 12 |
168 |
Apr 27 |
Oct 13 |
169 |
|
1987 |
Apr 21 |
Oct 19 |
181 |
Apr 21 |
Nov 11 |
204 |
|
1988 |
May 7 |
Nov 12b |
189 |
Apr 11 |
Nov 16 |
219 |
|
1989 |
Apr 30 |
Oct 18 |
171 |
Mar 21 |
Oct 27 |
220b |
|
1990 |
Apr 10a |
Oct 9 |
182 |
Mar 31 |
Oct 21 |
204 |
|
1991 |
May 5 |
Oct 28 |
176 |
Mar 29 |
Oct 29 |
214 |
|
1992 |
Apr 21 |
Oct 8 |
170 |
Mar 19a |
Oct 8 |
203 |
|
1993 |
May 9 |
Oct 19 |
163 |
Apr 20 |
Oct 27 |
190 |
|
1994 |
Apr 30 |
Oct 17 |
170 |
Apr 8 |
Oct 31 |
206 |
|
1995 |
Apr 25 |
Oct 6 |
164 |
Apr 18 |
Oct 6 |
171 |
|
1996 |
Apr 30 |
Sep 19 |
142 |
Apr 29 |
Oct 18 |
172 |
|
1997 |
May 2 |
Oct 13 |
164 |
May 2 |
Oct 13 |
164 |
|
1998 |
May 15 |
Oct 6 |
144 |
Apr 19 |
Oct 6 |
170 |
|
1999 |
June 5b |
Sep 28 |
115a |
Apr 16 |
Sep 29 |
166 |
|
2000 |
May 12 |
Oct 14 |
155 |
Apr 3 |
Nov 2 |
213 |
|
2001 |
Apr 23 |
Oct 11 |
171 |
Apr 13 |
Oct 11 |
181 |
|
2002 |
Apr 22 |
Oct 4 |
165 |
Apr 22 |
Nov 4 |
196 |
|
2003 |
May 11 |
Oct 27 |
169 |
Apr 8 |
Oct 27 |
202 |
|
2004 |
May 1 |
Oct 23 |
175 |
Mar 29 |
Oct 30 |
215 |
|
2005 |
Apr 22 |
Oct 31 |
192 |
Apr 21 |
Nov 15 |
208 |
|
2006 |
Apr 20 |
Sep 23 |
156 |
Apr 19 |
Oct 22 |
186 |
|
2007 |
May 7 |
Oct 19 |
165 |
Apr 19 |
Oct 22 |
187 |
|
2008 |
May 14 |
Oct 12 |
151 |
May 13 |
Oct 12 |
152 |
|
2009 |
Apr 27 |
Sep 22 |
148 |
Apr 16 |
Oct 2 |
169 |
|
2010 |
May 12 |
Oct 26 |
167 |
May 12 |
Oct 26 |
167 |
|
2011 |
May 3 |
Oct 8 |
158 |
May 2 |
Oct 25 |
176 |
|
2012 |
Apr 15 |
Oct 28 |
196 |
Apr 16 |
Oct 25 |
192 |
|
2013 |
May 4 |
Oct 5 |
154 |
May 3 |
Oct 17 |
167 |
|
2014 |
May 14 |
Nov 3 |
173 |
May 13 |
Nov 4 |
175 |
|
2015 |
May 10 |
Oct 28 |
171 |
Apr 17 |
Nov 6 |
203 |
|
2016 |
May 19 |
Oct 20 |
154 |
May 3 |
Nov 18b |
199 |
|
Mean |
May 5 |
Oct 14 |
163 |
Apr 22 |
Oct 23 |
184 |
|
aEarliest date (or shortest frost-free period). |
||||||
|
Table 19. Average Daily Maximum Temperature (°F) in each Month at the NMSU Agricultural Science Center at |
|||||||||||||
|
Year |
Jan |
Feb |
Mar |
Apr |
May |
June |
July |
Aug |
Sep |
Oct |
Nov |
Dec |
Mean |
|
1969 |
41.9 |
46.0 |
50.3 |
69.3 |
78.3 |
83.3 |
90.8 |
89.9 |
83.2 |
62.3 |
50.9 |
44.7 |
65.9 |
|
1970 |
43.0 |
54.3 |
52.3 |
59.8 |
77.7 |
84.3 |
91.3 |
90.9 |
78.1 |
62.8 |
54.8 |
44.2 |
66.1 |
|
1971 |
42.6 |
48.3 |
59.4 |
66.4 |
73.5 |
87.2 |
92.8 |
86.8 |
79.5 |
65.1 |
51.2 |
38.7 |
66.0 |
|
1972 |
43.1 |
53.7 |
65.8 |
69.5 |
77.5 |
86.4 |
93.3 |
86.5 |
79.8 |
63.1 |
45.7a |
36.8 |
66.8 |
|
1973 |
32.4 |
42.3 |
49.5a |
59.1 |
73.5 |
84.0 |
90.3 |
90.2 |
78.8 |
70.3 |
56.7 |
41.4 |
64.0 |
|
1974 |
34.0 |
40.1a |
61.6 |
64.5 |
80.2 |
90.6 |
89.3 |
88.1 |
80.4 |
67.2 |
52.2 |
38.6 |
65.6 |
|
1975 |
36.7 |
44.0 |
52.5 |
60.1 |
71.4 |
84.7 |
88.9 |
87.9 |
78.5 |
70.2 |
53.1 |
42.2 |
64.2 |
|
1976 |
41.3 |
53.9 |
56.4 |
68.0 |
75.7 |
86.6 |
92.3 |
88.0 |
79.0 |
65.3 |
53.1 |
44.7 |
67.0 |
|
1977 |
33.7 |
50.6 |
53.4 |
68.7 |
73.7 |
90.2 |
90.2 |
88.8 |
81.4 |
70.5 |
54.2 |
46.7 |
66.8 |
|
1978 |
41.2 |
44.4 |
57.9 |
64.7 |
69.5a |
85.2 |
90.3 |
85.7 |
78.1 |
69.6 |
51.2 |
32.5a |
64.2 |
|
1979 |
31.2a |
42.2 |
51.9 |
65.1 |
71.5 |
84.3 |
90.2 |
86.4 |
84.4 |
71.0 |
46.3 |
43.1 |
64.0 |
|
1980 |
40.7 |
49.8 |
52.8 |
64.6 |
72.5 |
89.8 |
92.9 |
87.0 |
79.4 |
65.2 |
54.5 |
50.5b |
66.6 |
|
1981 |
48.6 |
52.1 |
53.0 |
70.8 |
73.1 |
88.4 |
90.0 |
87.2 |
80.1 |
64.5 |
57.2 |
45.7 |
67.6 |
|
1982 |
40.5 |
41.3 |
54.4 |
63.5 |
71.6 |
84.1 |
88.9 |
84.5 |
77.7 |
64.1 |
50.2 |
40.7 |
63.5a |
|
1983 |
40.1 |
46.9 |
53.1 |
58.7a |
72.5 |
82.0 |
89.5 |
89.5 |
82.0 |
67.9 |
51.8 |
42.9 |
64.7 |
|
1984 |
40.9 |
48.3 |
55.3 |
61.0 |
80.5 |
83.6 |
91.1 |
87.3 |
79.9 |
57.7a |
54.2 |
45.3 |
65.4 |
|
1985 |
40.0 |
45.3 |
54.8 |
68.1 |
75.4 |
87.9 |
90.5 |
89.5 |
75.2 |
66.4 |
50.8 |
42.9 |
65.6 |
|
1986 |
49.2 |
51.4 |
60.7 |
64.5 |
75.3 |
84.6 |
86.3a |
88.4 |
74.2a |
64.5 |
50.0 |
43.5 |
66.0 |
|
1987 |
40.1 |
46.9 |
52.3 |
68.7 |
74.0 |
87.3 |
89.8 |
85.8 |
79.7 |
70.6 |
50.4 |
39.7 |
65.4 |
|
1988 |
35.5 |
47.7 |
55.9 |
66.1 |
74.1 |
88.1 |
91.4 |
86.7 |
79.6 |
73.1b |
52.4 |
42.4 |
66.1 |
|
1989 |
38.5 |
45.7 |
63.3 |
72.9b |
79.5 |
86.4 |
92.7 |
86.5 |
83.4 |
67.5 |
55.6 |
45.3 |
68.1 |
|
1990 |
40.3 |
47.0 |
58.4 |
66.9 |
74.0 |
90.9 |
89.3 |
86.5 |
81.5 |
67.7 |
53.5 |
34.6 |
65.9 |
|
1991 |
35.1 |
48.7 |
53.3 |
64.9 |
75.5 |
84.1 |
89.8 |
88.0 |
79.4 |
69.9 |
48.4 |
37.4 |
64.5 |
|
1992 |
38.5 |
50.5 |
57.2 |
71.6 |
75.6 |
84.2 |
86.6 |
86.5 |
81.0 |
71.4 |
47.1 |
35.9 |
65.5 |
|
1993 |
43.9 |
47.9 |
59.0 |
66.9 |
76.6 |
85.7 |
90.8 |
84.1 |
79.5 |
65.2 |
50.2 |
42.8 |
66.1 |
|
1994 |
45.6 |
46.6 |
61.4 |
66.1 |
77.3 |
90.6 |
93.0 |
90.7 |
80.8 |
65.5 |
49.1 |
45.6 |
67.7 |
|
1995 |
42.6 |
57.5b |
57.9 |
61.7 |
71.4 |
83.6 |
90.9 |
90.4 |
80.2 |
69.5 |
58.4 |
46.3 |
67.5 |
|
1996 |
45.1 |
53.6 |
59.0 |
68.1 |
81.7 |
87.6 |
91.6 |
88.3 |
75.9 |
5.4 |
52.3 |
43.8 |
67.7 |
|
1997 |
38.9 |
47.7 |
64.0 |
61.4 |
77.4 |
86.0 |
89.5 |
86.8 |
82.1 |
67.0 |
53.6 |
41.6 |
66.3 |
|
1998 |
44.5 |
45.9 |
56.9 |
63.0 |
78.2 |
85.7 |
90.3 |
90.0 |
85.7b |
67.2 |
55.7 |
45.2 |
67.3 |
|
1999 |
49.9 |
54.4 |
64.3 |
63.2 |
73.3 |
86.1 |
88.6 |
84.1a |
79.2 |
72.2 |
62.5b |
43.5 |
68.4 |
|
2000 |
46.2 |
53.7 |
55.5 |
70.8 |
82.3b |
89.0 |
92.5 |
91.0 |
83.6 |
65.2 |
45.8 |
44.6 |
68.3 |
|
2001 |
40.9 |
48.6 |
58.2 |
68.3 |
79.5 |
89.1 |
91.3 |
88.4 |
85.4 |
71.8 |
57.5 |
42.9 |
68.5 |
|
2002 |
44.3 |
49.9 |
57.6 |
72.5 |
79.5 |
92.7b |
93.9 |
89.8 |
79.2 |
64.8 |
52.8 |
42.5 |
68.3 |
|
2003 |
51.5b |
47.6 |
57.4 |
66.6 |
79.4 |
87.7 |
97.2b |
91.2b |
81.5 |
72.9 |
51.6 |
45.5 |
69.2b |
|
2004 |
41.0 |
44.9 |
66.5b |
65.0 |
80.3 |
88.8 |
91.4 |
87.8 |
77.8 |
66.2 |
50.7 |
44.3 |
67.1 |
|
2005 |
47.9 |
49.0 |
55.7 |
67.8 |
78.7 |
86.5 |
96.5 |
87.3 |
82.3 |
68.2 |
56.5 |
44.6 |
68.4 |
|
2006 |
46.2 |
52.2 |
56.0 |
71.0 |
82.1 |
91.7 |
91.3 |
85.5 |
74.4 |
63.6 |
55.9 |
42.4 |
67.7 |
|
2007 |
38.0 |
48.3 |
51.3 |
66.8 |
74.3 |
88.6 |
92.4 |
90.2 |
81.0 |
69.3 |
58.3 |
38.4 |
67.2 |
|
2008 |
34.4 |
43.9 |
57.4 |
65.5 |
73.0 |
85.5 |
89.9 |
87.3 |
80.3 |
68.2 |
55.2 |
39.7 |
65.0 |
|
2009 |
42.3 |
50.8 |
58.7 |
64.4 |
77.7 |
81.4a |
91.6 |
88.1 |
79.9 |
62.5 |
55.1 |
35.8 |
65.7 |
|
2010 |
35.6 |
42.6 |
54.9 |
64.7 |
73.7 |
87.7 |
89.9 |
84.7 |
81.9 |
68.3 |
51.1 |
46.5 |
65.1 |
|
2011 |
35.5 |
44.4 |
59.8 |
63.5 |
71.5 |
87.4 |
91.4 |
89.7 |
78.3 |
65.1 |
50.9 |
39.6 |
64.8 |
|
2012 |
45.3 |
46.3 |
60.5 |
69.9 |
79.2 |
90.7 |
89.4 |
89.0 |
80.9 |
69.3 |
57.6 |
41.1 |
68.3 |
|
2013 |
35.1 |
43.3 |
59.8 |
65.2 |
75.0 |
90.3 |
89.8 |
86.4 |
79.0 |
63.4 |
51.8 |
38.3 |
64.8 |
|
2014 |
46.4 |
52.3 |
58.5 |
65.0 |
74.7 |
87.5 |
91.8 |
85.6 |
81.7 |
69.4 |
54.7 |
42.6 |
67.5 |
|
2015 |
41.6 |
52.2 |
62.6 |
65.6 |
70.4 |
96.6 |
86.7 |
88.2 |
82.7 |
70.4 |
52.3 |
40.5 |
66.7 |
|
2016 |
39.2 |
51.9 |
60.6 |
65.3 |
73.5 |
91.6 |
91.2 |
84.0 |
79.0 |
72.3 |
54.9 |
43.6 |
67.3 |
|
Mean |
41.1 |
48.3 |
57.5 |
66.0 |
75.8 |
87.0 |
90.9 |
87.7 |
80.1 |
67.3 |
52.9 |
42.1 |
66.4 |
|
aLowest average daily maximum temperature for month or year during 48-year period. |
|||||||||||||
|
Table 20. Average Daily Mean Temperature (°F) Recorded in each Month at the NMSU Agricultural Science Center at Farmington, NM, 1969–2016 |
|||||||||||||
|
Year |
Jan |
Feb |
Mar |
Apr |
May |
June |
July |
Aug |
Sep |
Oct |
Nov |
Dec |
Mean |
|
1969 |
33.5 |
35.0 |
37.4a |
52.3 |
63.0 |
67.3 |
75.7 |
75.9 |
69.1 |
50.4 |
39.3 |
33.4 |
52.7 |
|
1970 |
31.3 |
40.5 |
39.2 |
44.5a |
60.5 |
68.5 |
76.5 |
76.3b |
63.6 |
49.4 |
42.2 |
33.1 |
52.1 |
|
1971 |
29.6 |
33.9 |
42.7 |
49.6 |
57.5 |
70.6 |
76.8 |
73.4 |
63.5 |
51.7 |
39.6 |
29.6 |
51.5 |
|
1972 |
30.3 |
38.1 |
48.3 |
52.5 |
60.2 |
70.6 |
77.6 |
73.2 |
66.5 |
54.0 |
36.5 |
26.1 |
52.8 |
|
1973 |
22.2a |
33.9 |
39.2 |
45.6 |
58.6 |
67.8 |
74.9 |
74.9 |
63.6 |
55.2 |
43.7 |
30.2 |
50.8 |
|
1974 |
23.8 |
28.7a |
47.3 |
48.6 |
63.2 |
73.9 |
75.1 |
73.4 |
65.2 |
55.6 |
40.4 |
28.0 |
51.9 |
|
1975 |
25.6 |
33.4 |
40.1 |
45.7 |
55.4a |
66.6 |
74.5 |
72.4 |
64.3 |
54.6 |
38.5 |
30.5 |
50.1a |
|
1976 |
28.7 |
40.8 |
40.9 |
52.3 |
60.2 |
69.8 |
77.3 |
73.4 |
66.4 |
51.3 |
39.5 |
30.7 |
52.6 |
|
1977 |
24.6 |
36.5 |
39.3 |
53.7 |
59.0 |
74.4 |
76.2 |
75.1 |
68.2 |
56.4 |
42.8 |
36.2 |
53.5 |
|
1978 |
33.3 |
34.4 |
45.6 |
51.5 |
56.0 |
69.3 |
75.5 |
71.4 |
64.9 |
56.2 |
41.9 |
23.8 |
52.0 |
|
1979 |
23.5 |
31.9 |
39.8 |
49.7 |
57.5 |
67.2 |
74.0 |
71.6 |
68.5 |
55.4 |
35.4 |
31.5 |
50.5 |
|
1980 |
33.4 |
38.7 |
39.9 |
48.6 |
56.9 |
70.9 |
76.0 |
72.4 |
64.6 |
50.3 |
40.8 |
37.2 |
52.5 |
|
1981 |
34.3 |
37.6 |
41.1 |
55.0 |
58.3 |
71.1 |
74.0 |
71.5 |
64.9 |
51.0 |
43.7 |
33.6 |
53.0 |
|
1982 |
29.5 |
31.3 |
42.2 |
49.0 |
57.2 |
67.4 |
73.5 |
72.0 |
64.9 |
49.6 |
39.5 |
31.5 |
50.6 |
|
1983 |
30.7 |
36.6 |
42.1 |
44.7 |
56.7 |
66.4a |
74.0 |
75.3 |
37.2 |
54.5 |
40.2 |
33.6 |
51.8 |
|
1984 |
28.6 |
34.3 |
41.1 |
47.2 |
63.8 |
68.5 |
76.1 |
73.5 |
65.8 |
47.0a |
41.8 |
34.9 |
51.9 |
|
1985 |
30.0 |
32.1 |
43.3 |
52.9 |
60.4 |
70.7 |
75.5 |
74.2 |
61.4 |
53.8 |
39.8 |
31.2 |
52.1 |
|
1986 |
36.1 |
38.8 |
46.8 |
51.5 |
59.5 |
69.6 |
72.5 |
73.9 |
61.9 |
52.1 |
39.7 |
32.7 |
52.9 |
|
1987 |
29.0 |
35.7 |
39.2 |
53.6 |
59.4 |
70.1 |
73.2 |
71.4 |
64.5 |
55.4 |
39.1 |
29.2 |
51.6 |
|
1988 |
24.0 |
36.0 |
40.6 |
51.1 |
49.1 |
71.9 |
76.0 |
71.4 |
64.0 |
57.9 |
40.8 |
30.8 |
52.1 |
|
1989 |
27.1 |
34.9 |
48.8 |
56.4 |
63.2 |
70.2 |
78.0 |
72.3 |
68.7 |
54.0 |
40.8 |
30.8 |
53.8 |
|
1990 |
29.1 |
36.1 |
46.5 |
53.9 |
59.5 |
74.9b |
75.9 |
73.2 |
68.8 |
53.8 |
42.2 |
23.0a |
53.1 |
|
1991 |
25.6 |
36.9 |
41.6 |
49.3 |
59.5 |
68.4 |
74.6 |
73.6 |
65.3 |
54.8 |
37.9 |
29.4 |
51.4 |
|
1992 |
28.2 |
38.8 |
44.7 |
56.0 |
62.0 |
68.3 |
71.8a |
72.2 |
65.6 |
55.8 |
34.6a |
25.7 |
52.0 |
|
1993 |
35.0 |
37.9 |
44.2 |
51.2 |
60.8 |
68.6 |
73.8 |
70.8 |
64.0 |
51.5 |
37.7 |
31.4 |
52.2 |
|
1994 |
32.3 |
35.5 |
46.4 |
51.9 |
61.6 |
73.2 |
76.7 |
76.0 |
65.6 |
52.2 |
38.0 |
34.7 |
53.6 |
|
1995 |
33.3 |
43.4b |
44.5 |
48.2 |
57.1 |
66.7 |
74.5 |
75.7 |
66.2 |
53.3 |
43.8 |
34.5 |
53.4 |
|
1996 |
32.0 |
40.5 |
43.8 |
51.3 |
64.2 |
70.8 |
75.9 |
72.9 |
61.2 |
51.6 |
40.0 |
32.4 |
56.0 |
|
1997 |
28.9 |
35.7 |
46.2 |
46.7 |
61.5 |
69.8 |
74.0 |
73.0 |
68.1 |
51.9 |
40.6 |
30.8 |
52.3 |
|
1998 |
33.4 |
35.2 |
42.5 |
48.0 |
61.3 |
67.2 |
76.1 |
74.4 |
69.8b |
53.4 |
42.2 |
32.0 |
53.0 |
|
1999 |
35.4 |
39.1 |
47.8 |
48.7 |
58.3 |
68.1 |
73.9 |
70.5a |
62.8 |
54.2 |
45.4b |
29.3 |
52.8 |
|
2000 |
34.1 |
40.7 |
42.1 |
54.7 |
63.3 |
71.4 |
75.2 |
74.6 |
68.0 |
53.6 |
35.5 |
33.9 |
53.9 |
|
2001 |
31.1 |
37.1 |
45.3 |
53.9 |
63.4 |
71.7 |
76.9 |
73.8 |
69.5 |
56.9 |
44.7 |
30.7 |
54.6 |
|
2002 |
31.4 |
33.7 |
41.7 |
56.7b |
62.7 |
74.7 |
77.6 |
73.7 |
64.9 |
52.0 |
39.7 |
32.1 |
53.4 |
|
2003 |
38.2b |
35.7 |
43.9 |
51.0 |
62.9 |
70.5 |
80.4b |
76.3 |
65.7 |
58.2b |
40.3 |
33.5 |
54.7b |
|
2004 |
29.9 |
33.3 |
50.8b |
51.8 |
63.4 |
71.7 |
75.3 |
72.7 |
64.3 |
53.3 |
40.1 |
32.5 |
53.3 |
|
2005 |
38.1 |
39.8 |
42.7 |
52.5 |
62.7 |
69.1 |
79.2 |
73.0 |
68.2 |
55.7 |
43.0 |
31.7 |
54.6 |
|
2006 |
33.5 |
36.7 |
43.4 |
55.0 |
65.2b |
74.5 |
77.5 |
72.6 |
60.9a |
51.7 |
43.3 |
31.2 |
53.8 |
|
2007 |
27.2 |
36.9 |
46.4 |
52.5 |
61.1 |
72.1 |
77.4 |
76.2 |
66.9 |
54.4 |
43.2 |
32.0 |
53.9 |
|
2008 |
23.9 |
33.8 |
42.1 |
46.5 |
56.4 |
69.8 |
75.3 |
73.9 |
65.8 |
54.0 |
43.3 |
30.9 |
51.3 |
|
2009 |
32.2 |
38.0 |
45.0 |
49.3 |
63.5 |
67.8 |
77.0 |
73.1 |
66.4 |
59.4 |
42.7 |
25.9 |
52.5 |
|
2010 |
26.3 |
33.5 |
41.7 |
50.7 |
57.7 |
71.5 |
75.8 |
71.9 |
67.4 |
55.5 |
38.5 |
37.3b |
52.3 |
|
2011 |
24.5 |
31.8 |
45.3 |
49.8 |
56.8 |
71.1 |
76.4 |
75.7 |
65.2 |
52.2 |
39.9 |
29.7 |
51.5 |
|
2012 |
32.3 |
34.5 |
45.4 |
54.5 |
62.9 |
74.1 |
75.5 |
75.1 |
66.7 |
54.5 |
43.9 |
31.0 |
54.2 |
|
2013 |
24.2 |
31.8 |
44.5 |
50.4 |
59.7 |
73.1 |
76.5 |
73.1 |
66.8 |
49.7 |
40.6 |
27.9 |
51.5 |
|
2014 |
32.2 |
38.9 |
44.3 |
50.2 |
59.6 |
70.9 |
77.3 |
72.0 |
68.7 |
56.3 |
41.5 |
34.0 |
53.8 |
|
2015 |
32.7 |
39.7 |
48.1 |
51.0 |
57.5 |
71.8 |
73.4 |
74.1 |
68.4 |
58.1 |
40.3 |
29.5 |
53.7 |
|
2016 |
29.3 |
38.2 |
45.3 |
51.0 |
59.1 |
75.9 |
76.0 |
71.4 |
65.2 |
58.2 |
44.5 |
33.8 |
54.0 |
|
Mean |
30.1 |
36.4 |
43.6 |
50.9 |
60.2 |
70.4 |
75.7 |
73.5 |
65.8 |
53.6 |
40.7 |
31.2 |
52.7 |
|
aLowest average daily mean temperature for month or year during 48-year period. |
|||||||||||||
|
Table 21. Average Daily Minimum Temperature (°F) Recorded in each Month at the NMSU Agricultural Science Center at Farmington, NM, 1969–2016 |
|||||||||||||
|
Year |
Jan |
Feb |
Mar |
Apr |
May |
June |
July |
Aug |
Sep |
Oct |
Nov |
Dec |
Mean |
|
1969 |
25.1 |
24.0 |
24.5a |
35.2 |
47.8 |
51.3 |
60.7 |
61.9 |
54.9 |
38.5 |
27.6 |
22.1 |
39.5 |
|
1970 |
19.5 |
26.6 |
26.2 |
29.2 |
43.2 |
52.7 |
61.7 |
61.6 |
49.0 |
35.9 |
29.6 |
22.1 |
38.1 |
|
1971 |
16.5 |
19.5 |
26.0 |
32.8 |
41.4 |
54.0 |
60.7 |
60.0 |
47.5 |
38.3 |
28.0 |
20.5 |
37.1 |
|
1972 |
17.5 |
22.5 |
30.8 |
35.5 |
42.9 |
54.7 |
61.8 |
59.9 |
53.2 |
45.0b |
27.2 |
15.4 |
38.9 |
|
1973 |
12.0a |
25.5 |
29.0 |
32.0 |
43.6 |
51.5 |
59.5 |
59.6 |
48.5 |
40.0 |
30.7 |
18.9 |
37.6 |
|
1974 |
13.7 |
17.3a |
32.9 |
32.8 |
46.2 |
57.1 |
60.8 |
58.8 |
50.0 |
44.0 |
28.5 |
17.4 |
38.3 |
|
1975 |
14.5 |
22.9 |
27.7 |
31.3 |
39.5a |
48.6a |
60.1 |
56.8 |
50.0 |
39.0 |
23.9 |
18.9 |
36.1a |
|
1976 |
16.2 |
27.7 |
25.4 |
36.5 |
44.7 |
53.0 |
62.4 |
58.8 |
53.8 |
37.4 |
25.8 |
16.7 |
38.2 |
|
1977 |
15.5 |
22.3 |
25.2 |
38.7 |
44.4 |
58.5 |
62.2 |
61.4 |
54.9 |
42.2 |
31.4 |
25.6 |
10.2 |
|
1978 |
25.4 |
24.5 |
33.4 |
38.3 |
42.5 |
53.4 |
60.7 |
57.1 |
51.6 |
42.7 |
32.5 |
15.0 |
39.8 |
|
1979 |
15.8 |
21.6 |
27.6 |
34.3 |
43.5 |
50.2 |
57.9 |
56.7 |
52.7 |
39.9 |
24.5 |
19.9 |
37.0 |
|
1980 |
26.1 |
27.7 |
27.0 |
32.6 |
41.3 |
52.0 |
59.2 |
57.7 |
49.7 |
35.4 |
27.1 |
23.8 |
38.3 |
|
1981 |
20.0 |
23.0 |
29.2 |
39.2 |
43.5 |
53.7 |
57.9 |
55.9a |
49.6 |
37.5 |
30.3 |
21.5 |
38.5 |
|
1982 |
18.4 |
21.4 |
29.9 |
34.4 |
42.8 |
50.7 |
58.0 |
59.5 |
52.1 |
35.2a |
28.9 |
22.2 |
37.8 |
|
1983 |
21.4 |
26.3 |
31.0 |
30.6 |
40.8 |
50.7 |
58.4 |
61.1 |
52.4 |
41.2 |
28.6 |
24.3 |
38.9 |
|
1984 |
16.3 |
20.3 |
26.9 |
33.4 |
47.1 |
53.4 |
61.1 |
59.8 |
51.7 |
36.4 |
29.5 |
24.6 |
38.4 |
|
1985 |
19.9 |
18.9 |
31.9 |
37.6 |
45.5 |
53.5 |
60.5 |
58.9 |
47.6 |
41.2 |
28.9 |
19.4 |
38.7 |
|
1986 |
23.1 |
26.3 |
32.8 |
38.5 |
43.7 |
54.5 |
58.7 |
59.5 |
49.6 |
39.7 |
29.4 |
21.9 |
39.8 |
|
1987 |
18.0 |
24.6 |
26.1 |
38.5 |
44.8 |
52.9 |
56.5a |
56.9 |
49.3 |
40.2 |
27.7 |
18.7 |
37.9 |
|
1988 |
12.4 |
24.3 |
25.2 |
36.0 |
44.0 |
55.8 |
60.7 |
60.2 |
48.4 |
42.7 |
29.3 |
19.2 |
38.2 |
|
1989 |
15.6 |
24.1 |
34.3 |
39.9 |
46.9 |
53.9 |
63.2 |
58.0 |
53.9 |
40.5 |
26.1 |
16.3 |
39.4 |
|
1990 |
17.9 |
25.3 |
34.6 |
40.9b |
45.1 |
58.9 |
62.6 |
59.8 |
56.0b |
39.9 |
31.0 |
11.4a |
40.3 |
|
1991 |
16.2 |
25.0 |
30.0 |
33.7 |
43.5 |
52.7 |
59.4 |
59.2 |
51.2 |
39.7 |
27.3 |
21.4 |
38.3 |
|
1992 |
17.9 |
27.0 |
32.3 |
40.3 |
48.3 |
52.3 |
57.0 |
57.8 |
50.1 |
40.3 |
22.0a |
15.5 |
38.4 |
|
1993 |
26.0 |
27.9 |
29.5 |
35.5 |
44.9 |
51.5 |
56.7 |
57.6 |
47.4 |
27.8 |
25.2 |
20.0 |
38.4 |
|
1994 |
19.0 |
23.8 |
31.4 |
37.6 |
45.9 |
55.8 |
60.3 |
61.2 |
50.3 |
38.9 |
27.0 |
23.8 |
39.6 |
|
1995 |
24.0 |
29.3 |
31.1 |
34.7 |
42.8 |
49.8 |
58.1 |
61.0 |
52.1 |
37.0 |
29.2 |
22.7 |
39.3 |
|
1996 |
18.8 |
27.5 |
28.5 |
34.4 |
46.7 |
53.9 |
60.2 |
57.5 |
46.5 |
37.8 |
27.7 |
21.1 |
38.4 |
|
1997 |
19.0 |
23.7 |
28.4 |
31.9 |
45.6 |
53.6 |
58.5 |
59.3 |
54.2 |
36.8 |
2.7 |
20.1 |
38.2 |
|
1998 |
22.3 |
24.4 |
38.1 |
32.9 |
44.5 |
48.8 |
62.0 |
58.7 |
53.9 |
39.6 |
28.8 |
18.7 |
38.6 |
|
1999 |
20.9 |
23.8 |
31.3 |
34.2 |
43.3 |
50.1 |
59.2 |
57.0 |
46.3a |
36.2 |
28.3 |
15.0 |
37.1 |
|
2000 |
22.0 |
27.7 |
28.7 |
38.6 |
44.3 |
53.8 |
57.8 |
58.2 |
52.4 |
42.0 |
25.2 |
23.1 |
39.5 |
|
2001 |
21.3 |
25.6 |
32.4 |
39.6 |
47.4 |
54.2 |
62.6 |
59.2 |
53.6 |
42.0 |
31.9 |
18.6 |
40.7 |
|
2002 |
18.5 |
17.5 |
25.7 |
40.8 |
45.9 |
56.7 |
61.3 |
57.6 |
50.7 |
39.2 |
26.5 |
21.6 |
38.5 |
|
2003 |
24.9 |
23.9 |
30.5 |
35.4 |
46.5 |
53.4 |
63.6 |
61.5 |
49.9 |
43.5 |
29.0 |
21.6 |
40.3 |
|
2004 |
18.8 |
21.8 |
35.1b |
38.7 |
46.5 |
54.6 |
59.1 |
57.6 |
50.8 |
40.5 |
29.5 |
20.7 |
39.5 |
|
2005 |
28.4b |
30.5b |
29.7 |
37.0 |
46.6 |
51.7 |
62.0 |
58.8 |
54.0 |
43.2 |
29.4 |
18.7 |
40.9b |
|
2006 |
20.7 |
21.2 |
30.7 |
39.0 |
48.3 |
57.2 |
63.7b |
59.7 |
47.5 |
39.8 |
30.7 |
20.0 |
39.9 |
|
2007 |
16.5 |
25.5 |
31.5 |
38.2 |
47.8 |
55.7 |
62.3 |
62.2b |
52.9 |
39.5 |
28.2 |
25.5 |
40.5 |
|
2008 |
13.4 |
23.7 |
26.9 |
27.5a |
39.8 |
54.1 |
60.7 |
60.4 |
51.3 |
39.9 |
31.5 |
22.1 |
37.6 |
|
2009 |
22.2 |
25.1 |
31.4 |
34.1 |
49.3b |
54.3 |
62.3 |
58.1 |
52.8 |
36.3 |
30.2 |
15.9 |
39.3 |
|
2010 |
17.0 |
24.3 |
28.4 |
36.6 |
41.6 |
55.4 |
61.6 |
59.1 |
52.9 |
42.7 |
25.9 |
28.0b |
39.5 |
|
2011 |
13.5 |
19.2 |
30.8 |
36.1 |
42.1 |
54.7 |
61.4 |
61.7 |
52.2 |
39.4 |
28.9 |
19.8 |
38.3 |
|
2012 |
19.3 |
22.8 |
30.3 |
39.1 |
46.6 |
57.5 |
61.6 |
61.3 |
52.5 |
39.6 |
30.3 |
20.8 |
40.1 |
|
2013 |
13.2 |
20.4 |
29.3 |
35.6 |
44.5 |
55.9 |
63.2 |
59.8 |
54.7 |
36.0 |
29.4 |
17.4 |
38.3 |
|
2014 |
18.0 |
25.6 |
30.0 |
35.4 |
44.6 |
54.3 |
62.8 |
58.5 |
55.6 |
43.2 |
28.3 |
25.4 |
40.1 |
|
2015 |
23.7 |
27.2 |
33.6 |
36.4 |
44.6 |
57.0 |
60.1 |
60.0 |
54.0 |
45.7 |
28.3 |
18.6 |
40.8 |
|
2016 |
19.5 |
24.4 |
30.1 |
36.7 |
44.7 |
60.2b |
60.8 |
58.9 |
51.4 |
44.1 |
34.1b |
23.9 |
40.7 |
|
Mean |
19.1 |
24.1 |
29.6 |
35.8 |
44.6 |
53.8 |
60.5 |
59.2 |
51.4 |
39.9 |
28.5 |
20.3 |
38.9 |
|
aLowest average daily minimum temperature for month or year during 48-year period. |
|||||||||||||
|
Table 22. Highest Temperature (°F) Recorded in each Month and Year at the NMSU Agricultural Science Center at Farmington, NM, 1969–2016 |
|||||||||||||
|
Year |
Jan |
Feb |
Mar |
Apr |
May |
June |
July |
Aug |
Sep |
Oct |
Nov |
Dec |
Highest |
|
1969 |
57 |
61 |
74 |
82 |
89 |
96 |
96 |
97 |
95 |
78 |
63 |
56 |
97 |
|
1970 |
56 |
65 |
65 |
72 |
86 |
98 |
98 |
99 |
90 |
76 |
64 |
61 |
99 |
|
1971 |
60 |
64 |
77 |
77 |
84 |
97 |
101 |
91 |
90 |
76 |
70 |
57 |
101 |
|
1972 |
61 |
66 |
76 |
78 |
86 |
94 |
100 |
98 |
89 |
82 |
57 |
52 |
100 |
|
1973 |
47 |
61 |
63 |
76 |
85 |
98 |
99 |
97 |
88 |
81 |
73 |
65 |
99 |
|
1974 |
45 |
60 |
72 |
75 |
93 |
99 |
95 |
94 |
93 |
83 |
64 |
56 |
99 |
|
1975 |
61 |
58 |
65 |
77 |
85 |
96 |
95 |
95 |
89 |
84 |
73 |
57 |
96 |
|
1976 |
54 |
68 |
71 |
77 |
86 |
98 |
100 |
93 |
94 |
78 |
70 |
55 |
100 |
|
1977 |
46 |
65 |
69 |
81 |
91 |
98 |
97 |
98 |
93 |
82 |
74 |
63 |
98 |
|
1978 |
53 |
59 |
79 |
78 |
88 |
95 |
95 |
94 |
90 |
83 |
67 |
47 |
95 |
|
1979 |
46 |
60 |
62 |
78 |
82 |
96 |
97 |
96 |
94 |
83 |
60 |
54 |
97 |
|
1980 |
59 |
64 |
67 |
81 |
86 |
99 |
97 |
97 |
88 |
84 |
73 |
63 |
99 |
|
1981 |
60 |
67 |
71 |
84 |
84 |
100 |
98 |
96 |
87 |
74 |
68 |
56 |
100 |
|
1982 |
60 |
64 |
67 |
76 |
82 |
93 |
97 |
95 |
91 |
79 |
64 |
53 |
97 |
|
1983 |
53 |
63 |
68 |
83 |
89 |
92 |
96 |
99 |
93 |
74 |
70 |
50 |
99 |
|
1984 |
51 |
60 |
69 |
79 |
93 |
94 |
95 |
93 |
89 |
75 |
68 |
54 |
95 |
|
1985 |
50 |
60 |
70 |
79 |
85 |
95 |
100 |
95 |
91 |
75 |
68 |
51 |
100 |
|
1986 |
64 |
70 |
75 |
79 |
85 |
94 |
96 |
96 |
88 |
75 |
60 |
55 |
96 |
|
1987 |
56 |
61 |
69 |
81 |
82 |
93 |
98 |
93 |
89 |
83 |
66 |
58 |
98 |
|
1988 |
49 |
62 |
77 |
78 |
87 |
99 |
96 |
93 |
93 |
83 |
70 |
56 |
99 |
|
1989 |
50 |
67 |
81 |
85 |
90 |
98 |
103 |
92 |
91 |
81 |
67 |
53 |
103 |
|
1990 |
56 |
64 |
74 |
80 |
86 |
103 |
98 |
94 |
93 |
79 |
68 |
55 |
103 |
|
1991 |
44 |
58 |
67 |
79 |
85 |
94 |
97 |
93 |
91 |
82 |
67 |
47 |
97 |
|
1992 |
54 |
65 |
67 |
86 |
85 |
92 |
95 |
95 |
89 |
83 |
61 |
49 |
95 |
|
1993 |
58 |
61 |
72 |
81 |
89 |
96 |
96 |
96 |
88 |
84 |
61 |
56 |
96 |
|
1994 |
58 |
63 |
74 |
81 |
92 |
100 |
97 |
97 |
89 |
80 |
70 |
55 |
100 |
|
1995 |
53 |
68 |
74 |
77 |
82 |
92 |
101 |
97 |
97 |
83 |
68 |
64 |
101 |
|
1996 |
56 |
65 |
71 |
82 |
90 |
93 |
96 |
96 |
90 |
83 |
66 |
57 |
96 |
|
1997 |
58 |
60 |
75 |
76 |
91 |
93 |
98 |
92 |
91 |
84 |
68 |
54 |
98 |
|
1998 |
56 |
62 |
77 |
80 |
87 |
100 |
100 |
97 |
90 |
80 |
67 |
60 |
100 |
|
1999 |
62 |
65 |
75 |
78 |
85 |
94 |
99 |
91 |
89 |
85 |
75 |
67 |
99 |
|
2000 |
66 |
66 |
70 |
85 |
97 |
94 |
97 |
97 |
93 |
83 |
57 |
55 |
97 |
|
2001 |
51 |
62 |
70 |
81 |
90 |
97 |
99 |
94 |
93 |
81 |
75 |
59 |
99 |
|
2002 |
59 |
63 |
74 |
81 |
98 |
97 |
100 |
98 |
90 |
77 |
63 |
55 |
100 |
|
2003 |
59 |
59 |
74 |
78 |
95 |
96 |
103 |
98 |
92 |
87 |
64 |
62 |
103 |
|
2004 |
51 |
62 |
82 |
78 |
89 |
96 |
99 |
97 |
91 |
78 |
67 |
60 |
99 |
|
2005 |
57 |
57 |
68 |
80 |
94 |
98 |
103 |
95 |
89 |
83 |
74 |
59 |
103 |
|
2006 |
57 |
67 |
71 |
85 |
92 |
99 |
100 |
92 |
87 |
83 |
69 |
54 |
100 |
|
2007 |
56 |
64 |
76 |
83 |
85 |
95 |
98 |
96 |
89 |
80 |
71 |
53 |
98 |
|
2008 |
51 |
61 |
70 |
81 |
87 |
93 |
95 |
97 |
87 |
81 |
74 |
53 |
97 |
|
2009 |
53 |
69 |
73 |
78 |
88 |
92 |
96 |
96 |
88 |
77 |
72 |
49 |
96 |
|
2010 |
44 |
50 |
75 |
78 |
90 |
98 |
98 |
94 |
89 |
86 |
71 |
59 |
98 |
|
2011 |
50 |
63 |
72 |
79 |
87 |
96 |
97 |
95 |
88 |
81 |
68 |
56 |
97 |
|
2012 |
53 |
59 |
78 |
85 |
87 |
98 |
97 |
95 |
90 |
83 |
70 |
60 |
98 |
|
2013 |
54 |
58 |
74 |
82 |
87 |
99 |
97 |
92 |
91 |
77 |
68 |
55 |
99 |
|
2014 |
60 |
66 |
69 |
78 |
91 |
96 |
97 |
92 |
91 |
77 |
74 |
57 |
97 |
|
2015 |
58 |
66 |
78 |
79 |
86 |
98 |
97 |
94 |
88 |
88 |
71 |
57 |
98 |
|
2016 |
57 |
66 |
73 |
82 |
85 |
101 |
97 |
94 |
88 |
79 |
68 |
56 |
101 |
|
Highest |
66 |
70 |
82 |
86 |
98 |
103 |
103 |
99 |
97 |
88 |
75 |
67 |
103 |
|
Table 23. Lowest Temperature (°F) Recorded in each Month and Year at the NMSU Agricultural Science Center at Farmington, NM, 1969–2016 |
|||||||||||||
|
Year |
Jan |
Feb |
Mar |
Apr |
May |
June |
July |
Aug |
Sep |
Oct |
Nov |
Dec |
Lowest |
|
1969 |
9 |
12 |
13 |
27 |
37 |
44 |
43 |
52 |
46 |
26 |
14 |
7 |
7 |
|
1970 |
0 |
15 |
11 |
20 |
27 |
39 |
53 |
54 |
34 |
21 |
18 |
14 |
0 |
|
1971 |
-18 |
5 |
6 |
17 |
31 |
38 |
54 |
54 |
28 |
18 |
17 |
4 |
-18 |
|
1972 |
2 |
2 |
14 |
24 |
30 |
47 |
56 |
54 |
37 |
22 |
15 |
2 |
2 |
|
1973 |
1 |
10 |
20 |
18 |
28 |
41 |
52 |
49 |
37 |
26 |
14 |
9 |
1 |
|
1974 |
-11 |
1 |
20 |
18 |
28 |
38 |
53 |
52 |
33 |
30 |
14 |
1 |
-11 |
|
1975 |
-2 |
9 |
9 |
19 |
23 |
38 |
55 |
49 |
40 |
20 |
7 |
6 |
-2 |
|
1976 |
-4 |
12 |
11 |
23 |
34 |
38 |
54 |
52 |
42 |
22 |
1 |
9 |
-4 |
|
1977 |
-2 |
13 |
12 |
21 |
33 |
51 |
57 |
54 |
46 |
32 |
20 |
10 |
-2 |
|
1978 |
12 |
0 |
20 |
26 |
28 |
45 |
51 |
46 |
33 |
31 |
18 |
-9 |
-9 |
|
1979 |
-8 |
5 |
17 |
16 |
29 |
36 |
51 |
48 |
42 |
23 |
6 |
9 |
-8 |
|
1980 |
14 |
18 |
13 |
18 |
27 |
36 |
53 |
41 |
37 |
17 |
12 |
11 |
11 |
|
1981 |
10 |
11 |
21 |
19 |
32 |
36 |
44 |
49 |
42 |
21 |
13 |
4 |
4 |
|
1982 |
-1 |
-3 |
19 |
22 |
30 |
38 |
47 |
54 |
38 |
21 |
17 |
6 |
-3 |
|
1983 |
9 |
20 |
22 |
20 |
27 |
36 |
45 |
55 |
30 |
35 |
11 |
10 |
9 |
|
1984 |
2 |
11 |
14 |
18 |
27 |
40 |
53 |
54 |
39 |
23 |
15 |
13 |
2 |
|
1985 |
6 |
-1 |
13 |
28 |
29 |
39 |
53 |
51 |
31 |
29 |
8 |
8 |
-1 |
|
1986 |
8 |
8 |
19 |
23 |
33 |
42 |
53 |
52 |
40 |
28 |
16 |
8 |
8 |
|
1987 |
2 |
8 |
9 |
24 |
35 |
43 |
50 |
47 |
40 |
30 |
14 |
1 |
1 |
|
1988 |
-3 |
16 |
9 |
21 |
30 |
38 |
54 |
54 |
33 |
36 |
12 |
1 |
-3 |
|
1989 |
4 |
-14 |
14 |
29 |
36 |
41 |
55 |
48 |
36 |
15 |
9 |
3 |
-14 |
|
1990 |
0 |
4 |
19 |
30 |
39 |
35 |
55 |
52 |
45 |
26 |
16 |
-16 |
-16 |
|
1991 |
-3 |
12 |
17 |
24 |
30 |
39 |
53 |
54 |
39 |
20 |
11 |
3 |
-3 |
|
1992 |
10 |
17 |
20 |
30 |
40 |
41 |
47 |
46 |
37 |
28 |
7 |
-2 |
-2 |
|
1993 |
10 |
18 |
15 |
24 |
32 |
39 |
46 |
52 |
38 |
17 |
8 |
8 |
8 |
|
1994 |
7 |
4 |
12 |
26 |
35 |
46 |
50 |
57 |
39 |
26 |
8 |
11 |
4 |
|
1995 |
12 |
21 |
18 |
24 |
34 |
38 |
45 |
55 |
36 |
24 |
13 |
9 |
9 |
|
1996 |
6 |
12 |
16 |
20 |
39 |
41 |
54 |
52 |
29 |
16 |
19 |
3 |
3 |
|
1997 |
-1 |
13 |
13 |
19 |
26 |
46 |
51 |
53 |
43 |
19 |
17 |
8 |
-1 |
|
1998 |
12 |
15 |
13 |
25 |
31 |
40 |
59 |
52 |
46 |
27 |
16 |
3 |
3 |
|
1999 |
11 |
7 |
21 |
20 |
30 |
32 |
50 |
49 |
28 |
19 |
9 |
3 |
3 |
|
2000 |
1 |
14 |
17 |
28 |
29 |
44 |
52 |
52 |
33 |
32 |
10 |
11 |
1 |
|
2001 |
10 |
8 |
21 |
24 |
34 |
36 |
57 |
52 |
36 |
28 |
13 |
8 |
8 |
|
2002 |
3 |
6 |
3 |
27 |
35 |
48 |
56 |
50 |
39 |
30 |
19 |
8 |
3 |
|
2003 |
17 |
8 |
22 |
24 |
29 |
46 |
53 |
57 |
41 |
28 |
12 |
7 |
7 |
|
2004 |
8 |
6 |
21 |
32 |
32 |
44 |
52 |
51 |
35 |
26 |
8 |
4 |
4 |
|
2005 |
19 |
18 |
20 |
20 |
34 |
37 |
56 |
53 |
42 |
30 |
16 |
-2 |
-2 |
|
2006 |
10 |
11 |
17 |
27 |
35 |
48 |
56 |
49 |
31 |
24 |
4 |
5 |
4 |
|
2007 |
4 |
3 |
9 |
24 |
32 |
38 |
56 |
56 |
33 |
19 |
14 |
12 |
3 |
|
2008 |
-7 |
4 |
17 |
18 |
15 |
40 |
54 |
53 |
41 |
22 |
13 |
7 |
-7 |
|
2009 |
15 |
12 |
21 |
19 |
43 |
44 |
56 |
48 |
31 |
22 |
12 |
1 |
1 |
|
2010 |
5 |
12 |
18 |
21 |
26 |
44 |
49 |
53 |
44 |
24 |
6 |
3 |
3 |
|
2011 |
-5 |
-6 |
19 |
21 |
26 |
46 |
51 |
57 |
44 |
27 |
19 |
4 |
-6 |
|
2012 |
7 |
16 |
13 |
25 |
37 |
45 |
57 |
55 |
45 |
24 |
16 |
22 |
7 |
|
2013 |
-6 |
11 |
13 |
21 |
28 |
40 |
57 |
52 |
33 |
27 |
15 |
19 |
-6 |
|
2014 |
8 |
14 |
18 |
25 |
27 |
46 |
58 |
48 |
41 |
35 |
12 |
19 |
8 |
|
2015 |
9 |
15 |
16 |
24 |
32 |
49 |
54 |
56 |
48 |
31 |
15 |
15 |
9 |
|
2016 |
8 |
8 |
20 |
25 |
35 |
50 |
54 |
49 |
37 |
31 |
12 |
27 |
8 |
|
Lowest in Month |
-18 |
-14 |
3 |
16 |
15 |
32 |
43 |
41 |
28 |
15 |
1 |
-16 |
-18 |
|
Table 24. Total Monthly Measurable Precipitation (inches) Recorded at the NMSU Agricultural Science Center at Farmington, NM, 1969–2016 |
|||||||||||||
|
Year |
Jan |
Feb |
Mar |
Apr |
May |
June |
July |
Aug |
Sep |
Oct |
Nov |
Dec |
Total for Year |
|
1969 |
0.85 |
0.31 |
0.21 |
0.30 |
1.13 |
1.00 |
0.69 |
0.47 |
2.07 |
2.88 |
0.38 |
0.29 |
10.58 |
|
1970 |
0.06 |
0.03 |
0.54 |
0.60 |
0.11 |
0.81 |
0.68 |
0.02 |
2.48 |
0.48 |
0.46 |
0.20 |
6.47 |
|
1971 |
0.18 |
0.09 |
0.05 |
0.11 |
0.41 |
0.00 |
0.31 |
1.72 |
1.13 |
1.08 |
0.77 |
0.16 |
6.01 |
|
1972 |
0.03 |
0.00 |
0.03 |
0.00 |
0.02 |
0.18 |
0.04 |
1.34 |
0.57 |
3.53a |
0.19 |
0.93 |
6.86 |
|
1973 |
0.28 |
0.17 |
1.82 |
1.54 |
0.65 |
0.95 |
0.27 |
0.61 |
1.49 |
0.35 |
0.30 |
0.37 |
8.80 |
|
1974 |
1.10 |
0.13 |
0.01 |
0.20 |
0.02 |
0.09 |
1.48 |
0.12 |
0.37 |
2.39 |
0.48 |
0.38 |
6.77 |
|
1975 |
0.11 |
0.61 |
1.52 |
0.78 |
0.35 |
0.13 |
0.84 |
0.24 |
0.80 |
0.14 |
0.22 |
0.20 |
5.94 |
|
1976 |
0.06 |
0.16 |
0.00 |
0.10 |
0.41 |
0.09 |
0.62 |
0.80 |
1.31 |
0.01 |
0.01 |
0.00 |
3.57b |
|
1977 |
0.42 |
0.00 |
0.00 |
0.03 |
0.29 |
0.04 |
1.03 |
1.41 |
0.38 |
0.30 |
0.62 |
0.63 |
5.15 |
|
1978 |
0.90 |
0.64 |
1.27 |
0.71 |
0.96 |
0.00 |
0.07 |
0.18 |
1.55 |
1.46 |
2.24 |
0.59 |
10.57 |
|
1979 |
0.88 |
0.19 |
0.46 |
0.28 |
0.58 |
0.43 |
1.40 |
0.49 |
0.08 |
1.37 |
0.97 |
0.73 |
7.86 |
|
1980 |
1.45 |
0.70 |
0.63 |
0.25 |
0.25 |
0.07 |
0.08 |
0.89 |
1.05 |
0.84 |
0.02 |
0.00 |
6.23 |
|
1981 |
0.00* |
0.30 |
1.76 |
0.21 |
1.05 |
0.60 |
0.90 |
0.28 |
0.69 |
0.89 |
0.36 |
0.10 |
7.14 |
|
1982 |
0.25 |
0.77 |
1.20 |
0.65 |
0.82 |
0.00 |
1.27 |
2.78 |
1.50 |
0.16 |
0.92 |
0.76 |
11.08 |
|
1983 |
0.94 |
0.77 |
1.76 |
0.39 |
0.05 |
0.35 |
1.67 |
0.72 |
0.69 |
0.36 |
0.91 |
0.67 |
9.28 |
|
1984 |
0.00 |
0.12 |
0.54 |
1.00 |
0.06 |
0.61 |
0.62 |
1.79 |
0.30 |
1.13 |
0.23 |
0.87 |
7.27 |
|
1985 |
0.39 |
0.13 |
1.74 |
1.76 |
0.29 |
0.01 |
1.38 |
0.43 |
1.31 |
1.21 |
0.52 |
0.22 |
9.39 |
|
1986 |
0.11 |
0.77 |
0.51 |
0.97 |
0.13 |
0.74 |
4.10a |
0.93 |
2.18 |
0.92 |
2.46a |
0.76 |
14.58a |
|
1987 |
0.10 |
1.75 |
0.66 |
0.04 |
0.64 |
0.02 |
0.28 |
1.17 |
0.27 |
1.20 |
1.52 |
0.59 |
8.24 |
|
1988 |
0.63 |
0.82 |
0.06 |
0.68 |
1.11 |
0.33 |
0.58 |
2.34 |
0.27 |
0.22 |
0.78 |
0.19 |
8.01 |
|
1989 |
1.19 |
0.56 |
0.06 |
0.00 |
0.00 |
0.00 |
2.40 |
0.46 |
0.14 |
0.51 |
0.00 |
0.00 |
5.32 |
|
1990 |
0.53 |
0.61 |
0.66 |
1.04 |
0.88 |
0.07 |
0.35 |
1.32 |
1.97 |
1.12 |
0.78 |
0.59 |
9.92 |
|
1991 |
0.59 |
0.42 |
0.51 |
0.01 |
0.51 |
0.45 |
0.37 |
0.56 |
1.38 |
0.38 |
2.24 |
0.84 |
8.26 |
|
1992 |
0.15 |
0.18 |
0.84 |
0.15 |
1.78a |
0.02 |
0.98 |
1.34 |
0.76 |
0.43 |
0.30 |
0.63 |
7.56 |
|
1993 |
2.18a |
1.13 |
0.49 |
0.28 |
0.38 |
0.04 |
0.03 |
2.06 |
0.84 |
1.25 |
0.47 |
0.15 |
9.30 |
|
1994 |
0.09 |
0.48 |
0.24 |
0.57 |
1.32 |
0.07 |
0.20 |
0.66 |
1.69 |
0.86 |
0.96 |
0.64 |
7.78 |
|
1995 |
0.57 |
0.36 |
1.23 |
1.29 |
0.89 |
0.14 |
0.12 |
1.88 |
2.04 |
0.16 |
0.08 |
0.39 |
9.15 |
|
1996 |
0.28 |
0.24 |
0.28 |
0.17 |
0.00 |
0.65 |
0.23 |
1.07 |
0.63 |
2.21 |
0.72 |
0.22 |
6.70 |
|
1997 |
1.03 |
0.51 |
0.00 |
2.88a |
0.82 |
0.62 |
1.28 |
1.86 |
1.94 |
0.43 |
0.67 |
0.80 |
12.84 |
|
1998 |
0.12 |
0.61 |
0.65 |
0.73 |
0.03 |
0.02 |
1.39 |
1.57 |
0.58 |
2.19 |
1.15 |
0.09 |
9.13 |
|
1999 |
0.11 |
0.05 |
0.13 |
1.33 |
1.14 |
0.44 |
2.51 |
3.01a |
0.23 |
0.01 |
0.06 |
0.18 |
9.20 |
|
2000 |
0.68 |
0.13 |
2.19a |
0.07 |
0.03 |
0.12 |
0.80 |
1.22 |
0.50 |
2.16 |
0.78 |
0.22 |
8.90 |
|
2001 |
0.44 |
0.80 |
1.37 |
0.67 |
0.87 |
0.03 |
0.87 |
0.98 |
0.24 |
0.24 |
0.48 |
0.55 |
7.54 |
|
2002 |
0.04 |
0.04 |
0.17 |
0.37 |
0.00 |
0.00 |
0.42 |
0.32 |
3.26 |
1.75 |
0.72 |
0.60 |
7.69 |
|
2003 |
0.08 |
1.34 |
0.44 |
0.02 |
0.16 |
0.00 |
0.11 |
1.24 |
0.87 |
0.72 |
1.03 |
0.31 |
6.32 |
|
2004 |
0.40 |
0.84 |
0.00 |
2.50 |
0.00 |
0.14 |
0.38 |
0.16 |
2.53 |
0.60 |
0.82 |
0.37 |
8.74 |
|
2005 |
1.12 |
1.78a |
0.36 |
0.85 |
0.55 |
0.11 |
0.52 |
1.84 |
0.48 |
0.92 |
0.06 |
0.10 |
8.69 |
|
2006 |
0.39 |
0.05 |
1.03 |
0.26 |
0.09 |
0.24 |
1.83 |
0.77 |
1.38 |
1.90 |
0.06 |
0.73 |
8.73 |
|
2007 |
0.62 |
0.43 |
1.65 |
0.39 |
1.69 |
0.10 |
0.68 |
0.81 |
0.74 |
0.11 |
0.59 |
0.61 |
8.42 |
|
2008 |
1.21 |
0.74 |
0.14 |
0.03 |
0.25 |
0.13 |
0.63 |
0.60 |
0.21 |
0.76 |
0.61 |
0.96 |
6.27 |
|
2009 |
0.38 |
0.44 |
0.35 |
0.28 |
0.78 |
0.47 |
0.15 |
0.27 |
0.09 |
0.68 |
0.32 |
0.42 |
4.63 |
|
2010 |
1.34 |
0.95 |
0.82 |
0.26 |
0.10 |
0.10 |
0.65 |
2.50 |
0.84 |
1.32 |
0.12 |
0.78 |
9.78 |
|
2011 |
0.03 |
0.18 |
0.34 |
1.09 |
0.86 |
0.01 |
0.65 |
0.05 |
1.02 |
1.86 |
0.55 |
0.30 |
6.94 |
|
2012 |
0.10 |
0.40 |
0.20 |
0.01 |
0.08 |
0.01 |
1.09 |
0.13 |
0.67 |
0.08 |
0.24 |
0.74 |
3.75 |
|
2013 |
0.83 |
0.07 |
0.14 |
0.49 |
0.23 |
0.02 |
0.52 |
1.34 |
3.29a |
0.66 |
0.91 |
0.14 |
8.64 |
|
2014 |
0.22 |
0.27 |
0.80 |
0.13 |
0.26 |
0.00 |
0.54 |
1.00 |
1.55 |
0.15 |
0.31 |
0.88 |
6.11 |
|
2015 |
1.22 |
1.14 |
0.10 |
0.61 |
1.70 |
1.80a |
0.96 |
1.09 |
0.51 |
1.10 |
0.89 |
0.65 |
11.77 |
|
2016 |
0.57 |
0.23 |
0.01 |
1.38 |
0.35 |
0.08 |
0.39 |
1.37 |
1.05 |
0.28 |
1.50 |
0.97a |
8.18 |
|
Mean for Month |
0.53 |
0.49 |
0.62 |
0.59 |
0.52 |
0.26 |
0.82 |
1.05 |
1.08 |
0.95 |
0.66 |
0.47 |
8.04 |
|
*Traces of precipitation less than 0.01 inch may have occurred in months showing 0.00 inches. |
|||||||||||||
|
Table 25. Total Number of Days in which Measurable Snow Was Recorded (D), Total Depth of Snow (TOT), and Average Depth (AVG) of Snow per Event in each Month at the NMSU Agricultural Science Center at Farmington, NM, 1987–2016 |
|||||||||||||||||||||
|
Year |
October |
November |
December |
January |
February |
March |
April |
||||||||||||||
|
D |
TOT |
AVG |
D |
TOT |
AVG |
D |
TOT |
AVG |
D |
TOT |
AVG |
D |
TOT |
AVG |
D |
TOT |
AVG |
D |
TOT |
AVG |
|
|
1987 |
0 |
- |
- |
1 |
2.0 |
2.0 |
2 |
19.0 |
9.5 |
0 |
- |
- |
5 |
21.3 |
4.3 |
2 |
3.0 |
1.5 |
0 |
- |
- |
|
1988 |
0 |
- |
- |
2 |
4.0 |
2.0 |
5 |
7.0 |
1.4 |
2 |
4.5 |
2.3 |
0 |
- |
- |
0 |
- |
- |
0 |
- |
- |
|
1989 |
0 |
- |
- |
0 |
- |
- |
0 |
- |
- |
3 |
9.5 |
3.2 |
4 |
8.5 |
2.1 |
1 |
2.0 |
2.0 |
0 |
- |
- |
|
1990 |
0 |
- |
- |
1 |
2.0 |
2.0 |
5 |
8.5 |
1.7 |
3 |
8.0 |
2.7 |
3 |
6.0 |
2.0 |
1 |
3.0 |
3.0 |
0 |
- |
- |
|
1991 |
1 |
2.0 |
2.0 |
5 |
10.0 |
2.0 |
3 |
1.8 |
0.6 |
2 |
3.0 |
1.5 |
0 |
- |
- |
2 |
4.5 |
2.3 |
0 |
- |
- |
|
1992 |
0 |
- |
- |
0 |
- |
- |
5 |
11.0 |
2.2 |
1 |
1.0 |
1.0 |
1 |
1.0 |
1.0 |
0 |
- |
- |
0 |
- |
- |
|
1993 |
0 |
- |
- |
0 |
- |
- |
0 |
- |
- |
0 |
- |
- |
2 |
2.0 |
1.0 |
1 |
0.3 |
0.3 |
0 |
- |
- |
|
1994 |
1 |
2.0 |
2.0 |
3 |
1.8 |
0.6 |
1 |
0.3 |
0.3 |
2 |
1.5 |
0.8 |
4 |
5.8 |
1.4 |
0 |
- |
- |
0 |
- |
- |
|
1995 |
0 |
- |
- |
0 |
- |
- |
4 |
1.5 |
0.4 |
4 |
4.0 |
1.0 |
0 |
- |
- |
0 |
- |
- |
0 |
- |
- |
|
1996 |
0 |
- |
- |
1 |
4.5 |
4.5 |
1 |
1.5 |
1.5 |
2 |
0.3 |
0.2 |
3 |
1.4 |
0.5 |
1 |
0.8 |
0.8 |
0 |
- |
- |
|
1997 |
1 |
2.0 |
2.0 |
0 |
- |
- |
2 |
4.0 |
2.0 |
4 |
8.3 |
2.1 |
5 |
4.8 |
1.0 |
0 |
- |
- |
0 |
- |
- |
|
1998 |
0 |
- |
- |
1 |
0.2 |
0.2 |
2 |
0.4 |
0.2 |
2 |
0.8 |
0.4 |
0 |
- |
- |
1 |
1.0 |
1.0 |
0 |
- |
- |
|
1999 |
0 |
- |
- |
1 |
0.4 |
0.4 |
1 |
1.0 |
1.0 |
0 |
- |
- |
0 |
- |
- |
1 |
1.5 |
1.5 |
1 |
2.0 |
2.0 |
|
2000 |
0 |
- |
- |
1 |
1.0 |
1.0 |
1 |
0.2 |
0.2 |
3 |
2.6 |
0.9 |
1 |
0.2 |
0.2 |
0 |
- |
- |
0 |
- |
- |
|
2001 |
0 |
- |
- |
0 |
- |
- |
3 |
1.9 |
0.6 |
6 |
5.6 |
0.9 |
2 |
6.8 |
3.4 |
1 |
1.0 |
1.0 |
2 |
1.2 |
0.6 |
|
2002 |
1 |
1.0 |
1.0 |
0 |
- |
- |
1 |
2.0 |
2.0 |
1 |
0.5 |
0.5 |
0 |
- |
- |
2 |
0.4 |
0.2 |
0 |
- |
- |
|
2003 |
0 |
- |
- |
1 |
0.8 |
0.8 |
0 |
- |
- |
0 |
- |
- |
3 |
3.0 |
1.0 |
1 |
2.0 |
2.0 |
0 |
- |
- |
|
2004 |
0 |
- |
- |
0 |
- |
- |
5 |
4.0 |
0.8 |
4 |
4.0 |
1.0 |
3 |
3.5 |
1.2 |
0 |
- |
- |
0 |
- |
- |
|
2005 |
0 |
- |
- |
0 |
- |
- |
1 |
0.4 |
0.4 |
3 |
2.2 |
0.7 |
2 |
1.0 |
0.5 |
1 |
0.1 |
0.1 |
0 |
- |
- |
|
2006 |
0 |
- |
- |
1 |
0.3 |
0.3 |
4 |
2.6 |
0.7 |
2 |
2.9 |
1.5 |
1 |
0.2 |
0.2 |
3 |
1.8 |
0.6 |
0 |
- |
- |
|
2007 |
0 |
- |
- |
1 |
0.3 |
0.3 |
4 |
1.0 |
0.3 |
5 |
5.4 |
1.1 |
1 |
0.3 |
0.3 |
0 |
- |
- |
0 |
- |
- |
|
2008 |
0 |
- |
- |
0 |
- |
- |
8 |
8.9 |
1.1 |
5 |
9.3 |
1.9 |
2 |
4.4 |
2.2 |
1 |
1.6 |
1.6 |
0 |
- |
- |
|
2009 |
2 |
3.4 |
1.7 |
1 |
0.5 |
0.5 |
4 |
3.2 |
0.8 |
4 |
4.0 |
1.0 |
2 |
4.0 |
2.0 |
4 |
0.8 |
0.2 |
0 |
- |
- |
|
2010 |
0 |
- |
- |
2 |
0.4 |
0.2 |
3 |
6.0 |
2.0 |
5 |
3.4 |
0.7 |
6 |
9.3 |
1.6 |
3 |
7.4 |
2.5 |
0 |
- |
- |
|
2011 |
0 |
- |
- |
1 |
0.5 |
0.5 |
7 |
1.8 |
0.3 |
1 |
1.0 |
1.0 |
0 |
- |
- |
0 |
- |
- |
0 |
- |
- |
|
2012 |
0 |
- |
- |
0 |
- |
- |
5 |
4.6 |
0.9 |
3 |
1.5 |
0.5 |
6 |
2.3 |
0.4 |
3 |
1.3 |
0.4 |
0 |
- |
- |
|
2013 |
0 |
- |
- |
2 |
0.7 |
0.4 |
3 |
1.7 |
0.6 |
4 |
1.4 |
0.4 |
3 |
1.1 |
0.4 |
0 |
- |
- |
0 |
- |
- |
|
2014 |
0 |
- |
- |
0 |
- |
- |
1 |
2.5 |
2.5 |
0 |
- |
- |
2 |
2.6 |
1.3 |
0 |
- |
- |
0 |
- |
- |
|
2015 |
0 |
- |
- |
0 |
- |
- |
6 |
3.0 |
0.5 |
2 |
2.1 |
1.1 |
4 |
2.1 |
0.5 |
1 |
0.6 |
0.6 |
1 |
1.0 |
1.0 |
|
2016 |
0 |
- |
- |
1 |
0.1 |
0.1 |
0 |
- |
- |
4 |
4.5 |
1.1 |
2 |
1.2 |
0.6 |
0 |
- |
- |
0 |
- |
- |
|
Mean |
1.2 |
2.1 |
1.7 |
1.5 |
1.7 |
1.0 |
3.3 |
3.8 |
1.3 |
3.1 |
3.7 |
1.2 |
2.9 |
4.0 |
1.3 |
1.7 |
1.8 |
1.2 |
1.3 |
1.4 |
1.2 |
|
Table 26. Total (TOT) and Average Daily (AVG) PAN Evaporation in Inches for each Month from April through October at the NMSU Agricultural Science Center at Farmington, NM, 1972–2016a |
||||||||||||||
|
Year |
April |
May |
June |
July |
August |
September |
Octoberb |
|||||||
|
TOT |
AVG |
TOT |
AVG |
TOT |
AVG |
TOT |
AVG |
TOT |
AVG |
TOT |
AVG |
TOT |
AVG |
|
|
1972 |
- |
- |
- |
- |
- |
- |
14.8 |
0.48 |
- |
- |
9.6 |
0.32 |
- |
- |
|
1973 |
- |
- |
- |
- |
- |
- |
11.5 |
0.37 |
10.7 |
0.35 |
- |
- |
- |
- |
|
1974 |
- |
- |
13.0 |
0.42 |
15.4 |
0.51 |
13.0 |
0.42 |
12.2 |
0.39 |
9.5 |
0.32 |
4.6 |
0.15 |
|
1975 |
- |
- |
9.4 |
0.30 |
12.1 |
0.40 |
12.1 |
0.39 |
12.6 |
0.41 |
8.0 |
0.27 |
7.3 |
0.24 |
|
1976 |
- |
- |
11.8 |
0.38 |
15.4 |
0.51 |
14.0 |
0.45 |
13.1 |
0.42 |
- |
- |
5.7 |
0.19 |
|
1977 |
9.1 |
0.30 |
12.1 |
0.39 |
15.1 |
0.50 |
13.1 |
0.42 |
12.2 |
0.39 |
9.5 |
0.32 |
- |
- |
|
1978 |
- |
- |
9.6 |
0.31 |
12.8 |
0.43 |
14.5 |
0.47 |
13.1 |
0.42 |
- |
- |
- |
- |
|
1979 |
8.3 |
0.28 |
8.6 |
0.28 |
- |
- |
- |
- |
10.6 |
0.34 |
9.5 |
0.32 |
- |
- |
|
1980 |
- |
- |
10.1 |
0.33 |
13.6 |
0.45 |
14.2 |
0.46 |
- |
- |
8.1 |
0.27 |
- |
- |
|
1981 |
7.9 |
0.26 |
9.5 |
0.30 |
13.1 |
0.44 |
- |
- |
- |
- |
7.7 |
0.26 |
- |
- |
|
1982 |
- |
- |
- |
- |
12.9 |
0.43 |
12.0 |
0.39 |
9.9 |
0.32 |
- |
- |
- |
- |
|
1983 |
- |
- |
- |
- |
11.6 |
0.39 |
12.2 |
0.39 |
11.2 |
0.36 |
8.7 |
0.29 |
- |
- |
|
1984 |
- |
- |
12.3 |
0.40 |
12.2 |
0.41 |
12.4 |
0.40 |
10.3 |
0.33 |
8.0 |
0.27 |
- |
- |
|
1985 |
- |
- |
9.0 |
0.29 |
12.4 |
0.41 |
12.6 |
0.41 |
11.6 |
0.37 |
6.8 |
0.23 |
- |
- |
|
1986 |
- |
- |
9.8 |
0.32 |
11.0 |
0.37 |
11.6 |
0.37 |
10.9 |
0.35 |
6.8 |
0.23 |
- |
- |
|
1987 |
- |
- |
- |
- |
11.5 |
0.38 |
- |
- |
- |
- |
8.4 |
0.28 |
- |
- |
|
1988 |
- |
- |
11.4 |
0.37 |
- |
- |
12.9 |
0.42 |
9.7 |
0.31 |
8.7 |
0.29 |
5.9 |
0.20 |
|
1989 |
- |
- |
12.3 |
0.40 |
12.6 |
0.42 |
- |
- |
11.0 |
0.36 |
9.3 |
0.31 |
- |
- |
|
1990 |
- |
- |
12.0 |
0.39 |
15.6 |
0.52 |
12.7 |
0.41 |
11.2 |
0.36 |
8.7 |
0.29 |
- |
- |
|
1991 |
9.1 |
0.30 |
11.5 |
0.37 |
11.2 |
0.37 |
12.7 |
0.41 |
11.2 |
0.36 |
8.3 |
0.28 |
- |
- |
|
1992 |
- |
- |
8.8 |
0.28 |
12.3 |
0.41 |
11.4 |
0.37 |
10.8 |
0.35 |
- |
- |
6.2 |
0.21 |
|
1993 |
9.8 |
0.33 |
10.6 |
0.34 |
14.0 |
0.47 |
14.7 |
0.47 |
9.9 |
0.32 |
9.5 |
0.32 |
- |
- |
|
1994 |
8.1 |
0.27 |
12.4 |
0.40 |
14.6 |
0.49 |
15.5 |
0.50 |
12.3 |
0.40 |
9.6 |
0.32 |
- |
- |
|
1995 |
- |
- |
9.9 |
0.32 |
12.6 |
0.42 |
14.1 |
0.45 |
11.5 |
0.37 |
8.5 |
0.28 |
7.4 |
0.25 |
|
1996 |
9.5 |
0.32 |
13.4 |
0.43 |
12.7 |
0.42 |
14.1 |
0.45 |
11.1 |
0.36 |
- |
- |
5.4 |
0.18 |
|
1997 |
7.4 |
0.25 |
9.9 |
0.32 |
12.0 |
0.40 |
12.0 |
0.39 |
9.5 |
0.31 |
7.9 |
0.26 |
5.5 |
0.18 |
|
1998 |
7.5 |
0.25 |
11.5 |
0.37 |
14.3 |
0.48 |
12.8 |
0.41 |
11.3 |
0.37 |
9.9 |
0.33 |
5.6 |
0.19 |
|
1999 |
7.9 |
0.26 |
10.9 |
0.35 |
13.4 |
0.45 |
11.5 |
0.37 |
9.3 |
0.30 |
8.1 |
0.27 |
7.2 |
0.24 |
|
2000 |
10.0 |
0.33 |
13.2 |
0.43 |
14.0 |
0.47 |
13.2 |
0.43 |
11.2 |
0.36 |
9.0 |
0.30 |
4.5 |
0.15 |
|
2001 |
8.4 |
0.28 |
12.2 |
0.39 |
14.0 |
0.47 |
12.2 |
0.40 |
11.1 |
0.36 |
10.7 |
0.36 |
7.0 |
0.23 |
|
2002 |
- |
- |
13.5 |
0.43 |
14.8 |
0.49 |
14.0 |
0.45 |
12.2 |
0.39 |
7.7 |
0.26 |
4.4 |
0.15 |
|
2003 |
8.4 |
0.28 |
11.8 |
0.38 |
14.7 |
0.49 |
15.6 |
0.50 |
12.3 |
0.40 |
9.4 |
0.31 |
6.2 |
0.21 |
|
2004 |
7.4 |
0.25 |
12.8 |
0.41 |
14.2 |
0.47 |
13.7 |
0.44 |
11.4 |
0.37 |
7.9 |
0.26 |
4.8 |
0.16 |
|
2005 |
8.3 |
0.28 |
11.4 |
0.37 |
12.6 |
0.42 |
15.1 |
0.49 |
10.5 |
0.34 |
8.1 |
0.27 |
4.8 |
0.16 |
|
2006 |
- |
- |
12.9 |
0.42 |
14.8 |
0.49 |
12.5 |
0.40 |
10.4 |
0.34 |
7.5 |
0.25 |
4.8 |
0.16 |
|
2007 |
8.0 |
0.27 |
9.8 |
0.32 |
13.5 |
0.45 |
12.9 |
0.42 |
11.1 |
0.36 |
8.7 |
0.29 |
6.3 |
0.21 |
|
2008 |
9.7 |
0.32 |
11.1 |
0.36 |
13.8 |
0.46 |
11.9 |
0.39 |
11.3 |
0.36 |
8.9 |
0.30 |
6.1 |
0.20 |
|
2009 |
8.4 |
0.28 |
- |
- |
10.2 |
0.34 |
13.3 |
0.43 |
11.1 |
0.36 |
8.1 |
0.27 |
- |
- |
|
2010 |
8.4 |
0.28 |
11.2 |
0.36 |
12.4 |
0.41 |
11.9 |
0.38 |
9.7 |
0.31 |
8.6 |
0.29 |
5.3 |
0.18 |
|
2011 |
8.7 |
0.29 |
11.2 |
0.36 |
14.4 |
0.48 |
13.0 |
0.42 |
11.6 |
0.37 |
7.7 |
0.26 |
- |
- |
|
2012 |
8.9 |
0.30 |
12.5 |
0.40 |
14.7 |
0.49 |
11.3 |
0.36 |
11.5 |
0.37 |
8.9 |
0.30 |
6.9 |
0.24 |
|
2013 |
11.0 |
0.37 |
12.1 |
0.39 |
13.7 |
0.46 |
12.4 |
0.40 |
10.0 |
0.32 |
7.9 |
0.26 |
5.5 |
0.18 |
|
2014 |
7.9 |
0.26 |
10.5 |
0.34 |
13.7 |
0.46 |
13.9 |
0.45 |
10.1 |
0.33 |
7.9 |
0.26 |
5.6 |
0.19 |
|
2015 |
8.1 |
0.27 |
8.4 |
0.27 |
10.6 |
0.35 |
10.4 |
0.33 |
11.6 |
0.38 |
8.3 |
0.28 |
5.0 |
0.17 |
|
2016 |
7.7 |
0.26 |
10.6 |
0.34 |
14.6 |
0.49 |
13.3 |
0.43 |
9.3 |
0.30 |
7.6 |
0.25 |
6.0 |
0.20 |
|
Mean |
8.6 |
0.29 |
11.1 |
0.36 |
13.3 |
0.44 |
13.0 |
0.42 |
11.1 |
0.36 |
8.5 |
0.28 |
5.8 |
0.19 |
|
aData are shown only for months in which PAN evaporation measurements were taken every day of the month, except for October. |
||||||||||||||
|
Table 27. Average Daily (24-hour) Wind Run (miles/day) Measured at a Height of 6 Feet during each Month at the NMSU Agricultural Science Center at Farmington, NM, 1980–2016 |
|||||||||||||
|
Year |
Jan |
Feb |
Mar |
Apr |
May |
June |
July |
Aug |
Sep |
Oct |
Nov |
Dec |
Mean |
|
1980 |
- |
- |
- |
- |
135 |
132 |
114 |
97 |
81 |
77 |
88 |
83 |
- |
|
1981 |
111 |
79 |
144 |
121 |
115 |
81 |
64 |
85 |
74 |
82 |
76 |
54 |
90 |
|
1982 |
93 |
63 |
107 |
115 |
99 |
129 |
99 |
91 |
102 |
91 |
87 |
95 |
98 |
|
1983 |
115 |
138 |
154 |
146 |
143 |
120 |
115 |
105 |
113 |
111 |
132 |
134 |
127 |
|
1984 |
63 |
115 |
95 |
133 |
90 |
97 |
50 |
50 |
46 |
64 |
139 |
114 |
88 |
|
1985 |
91 |
127 |
185 |
156 |
142 |
136 |
135 |
134 |
126 |
126 |
73 |
118 |
129 |
|
1986 |
116 |
130 |
145 |
179 |
155 |
138 |
129 |
132 |
129 |
124 |
122 |
96 |
133 |
|
1987 |
139 |
133 |
140 |
159 |
137 |
127 |
120 |
120 |
130 |
114 |
116 |
77 |
126 |
|
1988 |
125 |
123 |
158 |
154 |
164 |
138 |
132 |
132 |
121 |
82 |
98 |
102 |
128 |
|
1989 |
93 |
135 |
151 |
148 |
130 |
124 |
128 |
118 |
123 |
115 |
110 |
107 |
124 |
|
1990 |
125 |
153 |
146 |
172 |
164 |
156 |
141 |
134 |
128 |
134 |
126 |
129 |
142 |
|
1991 |
103 |
123 |
191 |
192 |
167 |
134 |
140 |
121 |
129 |
114 |
106 |
88 |
134 |
|
1992 |
113 |
122 |
136 |
140 |
136 |
137 |
116 |
118 |
110 |
113 |
109 |
112 |
122 |
|
1993 |
160 |
140 |
155 |
174 |
136 |
86 |
56 |
82 |
102 |
85 |
94 |
- |
- |
|
1994 |
132 |
155 |
143 |
165 |
137 |
128 |
135 |
127 |
119 |
119 |
144 |
116 |
135 |
|
1995 |
140 |
125 |
149 |
168 |
174 |
137 |
129 |
116 |
113 |
136 |
130 |
102 |
135 |
|
1996 |
167 |
148 |
161 |
184 |
146 |
141 |
127 |
119 |
111 |
135 |
121 |
144 |
142 |
|
1997 |
107 |
151 |
146 |
153 |
135 |
114 |
110 |
103 |
104 |
117 |
121 |
105 |
122 |
|
1998 |
102 |
137 |
143 |
140 |
111 |
121 |
111 |
109 |
102 |
131 |
113 |
107 |
119 |
|
1999 |
140 |
145 |
148 |
187 |
190 |
92 |
84 |
100 |
106 |
98 |
95 |
126 |
126 |
|
2000 |
131 |
143 |
149 |
162 |
139 |
135 |
107 |
103 |
110 |
108 |
115 |
108 |
126 |
|
2001 |
116 |
126 |
175 |
146 |
140 |
129 |
105 |
109 |
119 |
126 |
112 |
125 |
127 |
|
2002 |
123 |
141 |
163 |
135 |
123 |
115 |
115 |
97 |
107 |
91 |
110 |
110 |
119 |
|
2003 |
98 |
131 |
144 |
140 |
134 |
127 |
105 |
108 |
113 |
103 |
115 |
130 |
121 |
|
2004 |
94 |
119 |
134 |
133 |
123 |
112 |
111 |
100 |
99 |
102 |
119 |
89 |
111 |
|
2005 |
93 |
113 |
147 |
153 |
117 |
113 |
111 |
94 |
98 |
99 |
119 |
114 |
114 |
|
2006 |
129 |
140 |
140 |
145 |
122 |
128 |
104 |
96 |
103 |
103 |
123 |
107 |
120 |
|
2007 |
94 |
135 |
120 |
147 |
120 |
129 |
109 |
89 |
95 |
116 |
106 |
128 |
116 |
|
2008 |
106 |
124 |
144 |
170 |
136 |
127 |
103 |
95 |
93 |
109 |
127 |
126 |
122 |
|
2009 |
100 |
120 |
145 |
155 |
109 |
97 |
97 |
86 |
99 |
101 |
87 |
112 |
109 |
|
2010 |
72 |
104 |
129 |
155 |
123 |
92 |
92 |
78 |
80 |
89 |
110 |
88 |
101 |
|
2011 |
80 |
112 |
134 |
157 |
123 |
108 |
80 |
79 |
78 |
84 |
104 |
74 |
101 |
|
2012 |
97 |
110 |
110 |
116 |
99 |
88 |
73 |
77 |
73 |
89 |
79 |
95 |
92 |
|
2013 |
81 |
110 |
110 |
139 |
98 |
70 |
80 |
70 |
76 |
90 |
82 |
83 |
91 |
|
2014 |
98 |
83 |
83 |
118 |
78 |
76 |
79 |
61 |
51 |
60 |
71 |
66 |
77 |
|
2015 |
58 |
66 |
66 |
91 |
69 |
55 |
60 |
57 |
38 |
50 |
67 |
55 |
61 |
|
2016 |
44 |
72 |
72 |
88 |
70 |
62 |
63 |
58 |
45 |
63 |
62 |
53 |
63 |
|
Mean |
107 |
122 |
138 |
148 |
128 |
114 |
104 |
99 |
99 |
101 |
106 |
102 |
114 |
|
Table 28. Average Daily Solar Radiation in Langleys/Day (gram calories per square centimeter per day) as Measured with Pyranometers for each Month at the NMSU Agricultural Science Center at Farmington, NM, 1977–2016 |
|||||||||||||
|
Year |
Jan |
Feb |
Mar |
Apr |
May |
June |
July |
Aug |
Sep |
Oct |
Nov |
Dec |
Mean |
|
1977 |
205 |
306 |
386 |
552 |
438 |
530 |
501 |
464 |
396 |
360 |
332 |
- |
- |
|
1978 |
157 |
295 |
334 |
459 |
490 |
586 |
636 |
491 |
400 |
292 |
185 |
167 |
374 |
|
1979 |
166 |
260 |
302 |
423 |
445 |
527 |
489 |
477 |
459 |
267 |
190 |
155 |
347 |
|
1980 |
135 |
225 |
300 |
489 |
557 |
646 |
610 |
507 |
436 |
342 |
274 |
145 |
389 |
|
1981 |
190 |
296 |
289 |
519 |
554 |
643 |
589 |
520 |
422 |
314 |
243 |
200 |
398 |
|
1982 |
129 |
215 |
369 |
536 |
596 |
707 |
651 |
565 |
470 |
393 |
227 |
210 |
422 |
|
1983 |
188 |
295 |
345 |
478 |
- |
- |
- |
- |
- |
339 |
229 |
177 |
- |
|
1984 |
247 |
345 |
418 |
533 |
662 |
664 |
639 |
573 |
484 |
280 |
234 |
188 |
439 |
|
1985 |
204 |
303 |
359 |
475 |
561 |
648 |
590 |
561 |
413 |
335 |
228 |
214 |
408 |
|
1986 |
237 |
300 |
410 |
468 |
586 |
573 |
549 |
509 |
352 |
313 |
215 |
205 |
393 |
|
1987 |
222 |
281 |
458 |
548 |
540 |
635 |
618 |
443 |
468 |
346 |
228 |
182 |
414 |
|
1988 |
220 |
305 |
474 |
496 |
626 |
623 |
621 |
555 |
486 |
486 |
255 |
216 |
447 |
|
1989 |
224 |
280 |
419 |
544 |
628 |
633 |
557 |
570 |
498 |
361 |
277 |
219 |
434 |
|
1990 |
221 |
282 |
339 |
479 |
593 |
662 |
620 |
529 |
463 |
361 |
234 |
203 |
415 |
|
1991 |
- |
- |
- |
- |
- |
- |
- |
- |
- |
- |
- |
- |
- |
|
1992 |
189 |
259 |
355 |
510 |
531 |
609 |
548 |
501 |
451 |
323 |
238 |
167 |
390 |
|
1993 |
174 |
252 |
403 |
546 |
579 |
637 |
689 |
501 |
516 |
371 |
264 |
225 |
430 |
|
1994 |
241 |
288 |
398 |
481 |
558 |
648 |
623 |
538 |
430 |
261 |
192 |
154 |
401 |
|
1995 |
- |
- |
- |
- |
- |
- |
- |
- |
- |
- |
- |
- |
- |
|
1996 |
245 |
317 |
464 |
579 |
653 |
610 |
678 |
612 |
448 |
362 |
259 |
221 |
454 |
|
1997 |
242 |
306 |
535 |
514 |
614 |
658 |
641 |
568 |
492 |
390 |
268 |
221 |
454 |
|
1998 |
237 |
261 |
444 |
564 |
663 |
726 |
606 |
566 |
507 |
215 |
267 |
244 |
442 |
|
1999 |
263 |
363 |
459 |
528 |
625 |
703 |
623 |
516 |
503 |
439 |
319 |
241 |
465 |
|
2000 |
247 |
306 |
399 |
582 |
692 |
694 |
636 |
603 |
478 |
326 |
257 |
214 |
453 |
|
2001 |
241 |
323 |
408 |
584 |
652 |
604 |
616 |
581 |
542 |
397 |
287 |
242 |
456 |
|
2002 |
251 |
383 |
492 |
593 |
707 |
741 |
661 |
598 |
477 |
366 |
289 |
231 |
482 |
|
2003 |
255 |
315 |
452 |
596 |
640 |
719 |
692 |
604 |
510 |
394 |
200 |
191 |
464 |
|
2004 |
186 |
264 |
418 |
451 |
656 |
703 |
646 |
583 |
468 |
346 |
214 |
207 |
428 |
|
2005 |
206 |
272 |
402 |
526 |
624 |
639 |
664 |
539 |
442 |
347 |
277 |
239 |
431 |
|
2006 |
258 |
362 |
375 |
539 |
644 |
616 |
533 |
472 |
426 |
308 |
249 |
196 |
415 |
|
2007 |
228 |
284 |
397 |
539 |
562 |
676 |
535 |
455 |
407 |
406 |
310 |
220 |
418 |
|
2008 |
287 |
341 |
497 |
617 |
673 |
729 |
641 |
587 |
503 |
396 |
286 |
230 |
482 |
|
2009 |
262 |
352 |
431 |
541 |
608 |
589 |
637 |
581 |
473 |
358 |
276 |
206 |
443 |
|
2010 |
232 |
293 |
451 |
553 |
677 |
695 |
624 |
547 |
501 |
374 |
286 |
174 |
451 |
|
2011 |
272 |
359 |
465 |
562 |
668 |
712 |
651 |
570 |
465 |
374 |
260 |
209 |
464 |
|
2012 |
261 |
333 |
457 |
544 |
656 |
706 |
601 |
551 |
490 |
415 |
302 |
225 |
462 |
|
2013 |
225 |
360 |
468 |
571 |
636 |
688 |
599 |
530 |
463 |
372 |
260 |
225 |
450 |
|
2014 |
273 |
325 |
411 |
525 |
614 |
698 |
669 |
557 |
474 |
376 |
260 |
204 |
449 |
|
2015 |
218 |
326 |
474 |
572 |
- |
428 |
562 |
561 |
472 |
342 |
284 |
206 |
404 |
|
2016 |
240 |
352 |
458 |
524 |
292 |
761 |
654 |
542 |
- |
304 |
258 |
211 |
418 |
|
Mean |
223 |
305 |
414 |
530 |
597 |
650 |
614 |
541 |
463 |
351 |
256 |
205 |
429 |
|
Table 29. Coefficients of Polynomial Regression Equations (EQ) Shown in Figures of this Report Describing the Relationships of Various Parameters with Day of Year (x) in the Form: |
|||||||||
|
Coefficients |
|||||||||
|
EQ |
Parameter (Y) |
a |
b1 |
b2 |
b3 |
b4 |
b5 |
b6 |
r2 |
|
1 |
Daily high (°F) |
35.87 |
0.42 |
-5.73 E-3 |
7.63 E-5 |
-3.95 E-7 |
8.11 E-10 |
5.63 E-13 |
0.994 |
|
2 |
Daily low (°F) |
13.77 |
0.50 |
-1.03 E-2 |
1.20 E-4 |
-5.75 E-7 |
1.16 E-9 |
-8.13 E-13 |
0.993 |
|
3 |
Wind (NWS) (MPD) |
104.98 |
-0.44 |
3.71 E-2 |
-4.79 E-4 |
2.44 E-6 |
-5.53 E-9 |
4.66 E-12 |
0.802 |
|
4 |
Wind (NMCC) (MPD) |
130.47 |
-1.26 |
6.39 E-2 |
-7.39 E-4 |
3.55 E-6 |
-7.74 E-9 |
6.34 E-12 |
0.841 |
|
5 |
Solar radiation (Ly/day) |
212.46 |
-0.39 |
7.17 E-2 |
-4.73 E-4 |
1.00 E-6 |
6.55 E-10 |
n.s. |
0.988 |
|
6 |
PAN (NWS) (in./day) |
-0.31 |
7.89 E-3 |
-2.15 E-5 |
n.s. |
n.s. |
n.s. |
n.s. |
0.846 |
|
7 |
PAN (NMCC) (in./day) |
-0.37 |
9.15 E-3 |
-3.41 E-5 |
3.00 E-8 |
n.s. |
n.s. |
n.s. |
0.899 |
|
8 |
Soil temp (NWS) (°F) |
27.79 |
0.14 |
2.88 E-4 |
2.18 E-5 |
-1.40 E-7 |
2.05 E-10 |
n.s. |
0.996 |
|
9 |
Soil temp (NMCC) (°F) |
34.46 |
-0.04 |
1.79 E-3 |
5.58 E-6 |
-6.81 E-8 |
1.10 E-10 |
n.s. |
0.987 |
|
10 |
GDD (alfalfa) |
-158.32 |
15.47 |
-0.34 |
3.33 E-3 |
-1.02 E-5 |
9.82 E-9 |
n.s. |
1.000 |
|
11 |
GDD (corn) |
-95.36 |
10.15 |
-0.26 |
2.54 E-3 |
-7.74 E-6 |
7.53 E-9 |
n.s. |
1.000 |
|
12 |
ETrs (in./day) |
6.29 E-2 |
2.76 E-4 |
1.69 E-5 |
1.57 E-7 |
-2.10 E-9 |
6.62 E-12 |
-6.57 E-15 |
0.986 |
|
13 |
ETos (in./day) |
3.85 E-2 |
6.62 E-4 |
-2.65 E-6 |
2.78 E-7 |
-2.30 E-9 |
6.41 E-12 |
-5.99 E-15 |
0.991 |
|
14 |
Annual Tmax (°F) |
-9.96 |
3.84 E-2 |
n.s.a |
n.s. |
n.s. |
n.s. |
n.s. |
0.142 |
|
15 |
Annual Tmean (°F) |
-23.41 |
3.82 E-2 |
n.s. |
n.s. |
n.s. |
n.s. |
n.s. |
0.226 |
|
16 |
Annual Tmin (°F) |
-37.71 |
3.85 E-2 |
n.s. |
n.s. |
n.s. |
n.s. |
n.s. |
0.230 |
|
an.s. = not significant |
|||||||||
Literature Cited
Allen, R.G., L.S. Pereira, D. Raes, and M. Smith. 1998. Crop evapotranspiration: Guidelines for computing crop water requirements [FAO Irrigation and Drainage Paper No. 56]. Rome: Food and Agriculture Organization of the United Nations.
American Horticultural Society. 2017. Plant heat zone map. Retrieved October 24, 2017, from http://ahsgardening.org/gardening-resources/gardening-maps/heat-zone-map
CoStat. 2008. CoHort software. Monterey, CA.
Dahlman, L. 2017. Climate change: Global temperature. National Oceanic and Atmospheric Administration (NOAA). Retrieved October 24, 2017, from https://www.climate.gov/news-features/understanding-climate/climate-change-global-temperature
Eckert, D.J., and P.R. Thomison. 2017. Growing degree days as a method of rating the maturity of corn hybrids [AGF-101-90]. Columbus: The Ohio State University Extension. Retrieved October 24, 2017, from https://ohioline.osu.edu/factsheet/agf-101
Flynn, R., R. Phillips, A. Ulery, R. Kochevar, L. Liess, and M. Villa. 2002. Chile seed germination as affected by temperature and salinity [New Mexico Chile Task Force Report 2]. Las Cruces: New Mexico State University. Retrieved October 24, 2017, from https://pubs.nmsu.edu/research/horticulture/CTF2/index.html
Lee, K., M. Allen, and R. Leep. 2010. Predicting optimum time of alfalfa harvest. Lansing: Michigan State University. Retrieved October 24, 2017, from http://www.extension.org/pages/25471/predicting-optimum-time-of-alfalfa-harvest
Longstroth, M. 2013. Assessing frost and freeze damage to flowers and buds of fruit trees. Lansing: Michigan State University Extension. Retrieved October 24, 2017, from http://msue.anr.msu.edu/news/assessing_frost_and_freeze_damage_to_flowers_and_buds_of_fruit_trees
National Centers for Environmental Information. 2017. U.S. climate regions. Retrieved October 24, 2017, from https://www.ncdc.noaa.gov/monitoring-references/maps/us-climate-regions.php
Pathak, T.B., K.G. Hubbard, and M. Shulski. 2012. Soil temperature: A guide for planting agronomic and horticulture crops in Nebraska [G2122]. Lincoln: University of Nebraska. Retrieved October 24, 2017, from http://extensionpublications.unl.edu/assets/pdf/g2122.pdf
PlantMaps. 2017. New Mexico 2012 USDA hardiness zone map. Retrieved October 24, 2017, from http://www.plantmaps.com/interactive-new-mexico-2012-usda-plant-zone-hardiness-map.php
Snyder, R.L., and S. Eching. 2007. Penman-Monteith daily calculator. Davis: University of California, Biometeorology Program. Retrieved October 24, 2017, from http://biomet.ucdavis.edu/Evapotranspiration/PMdayXLS/PMday.xls
Sunset Western Garden Collection. 2017. Climate zone map—New Mexico. Retrieved October 24, 2017, from http://sunsetwesterngardencollection.com/climate-zones/zone/new-mexico
USDA–ARS. 2017. USDA plant hardiness zone map. Retrieved October 24, 2017, from http://planthardiness.ars.usda.gov/PHZMWeb/
USDA–NRCS. 2017a. Solar radiation unit conversions. Retrieved October 24, 2017, from https://www.nrcs.usda.gov/wps/portal/nrcs/detailfull/national/home/?cid=stelprdb1043619
USDA–NRCS. 2017b. SNOTEL update report. Retrieved November 12, 2017, from https://wcc.sc.egov.usda.gov/reportGenerator/view/customCalendarYearGroupByMonthReport/monthly/start_of_period/840:CO:SNTL%7Cid=%22%22%7Cname/POR_BEGIN,POR_END/WTEQ::value?fitToScreen=false
U.S. Global Change Research Program. 2017. Climate science special report: Fourth national climate assessment, volume I. D.J. Wuebbles, D.W. Fahey, K.A. Hibbard, D.J. Dokken, B.C. Stewart, and T.K. Maycock (Eds.). Washington, D.C.: Author. Retrieved November 8, 2017, from https://science2017.globalchange.gov
Acknowledgments
The authors wish to express their sincere gratitude to the weather observers, record keepers, data inputters, and those who have recorded and assisted with recording and/or analysis of data for this paper: M.P. Cross, A. Grubbs, C. Hedgecock, K. Hooper, J. Joe, J. Mitchell, C.K. Owen, T. Sammis, T. Shaddy, A.E. Stewart, J. Tomko, J. Ward, and T. Yellowman.
For further reading
RR-761: Eighteen Years (1990–2007) of Climatological Data on NMSU’s Corona Range and Livestock Research Center
https://pubs.nmsu.edu/research/weather_climate/RR761/index.html
BL-801: Estimated Impacts of Climate Change Legislation on New Mexico Agriculture
https://pubs.nmsu.edu/research/economics/BL801/index.html
TR-45: Climate Change and Its Implications for New Mexico’s Water Resources and Economic Opportunities
https://pubs.nmsu.edu/research/economics/TR45/index.html
To find more resources for your business, home, or family, visit the College of Agricultural, Consumer and Environmental Sciences on the World Wide Web at aces.nmsu.edu/pubs/.
Contents of publications may be freely reproduced for educational purposes. All other rights reserved. For permission to use publications for other purposes, contact pubs@nmsu.edu or the authors listed on the publication.
New Mexico State University is an equal opportunity/affirmative action employer and educator. NMSU and the U.S. Department of Agriculture cooperating.
June 2018, Las Cruces, NM.