Eighteen Years (1990-2007) of Climatological Data on NMSU's Corona Range and Livestock Research Center
Research Report 761
L. Allen Torrell, Kirk C. McDaniel, Shad Cox, Suman Majumdar
College of Agricultural, Consumer and Environmental Sciences, New Mexico State University
Authors: Respectively, Professor, Department of Agricultural Economics and Agricultural Business; Professor, Department of Animal and Range Sciences; Superintendent, Corona Range and Livestock Research Center; and former Graduate Research Assistant, Department of Agricultural Economics and Agricultural Business, all of New Mexico State University. (Print friendly PDF)
Introduction
Range forage production on the Corona Range and Livestock Research Center (CRLRC) is tied closely to climate and weather conditions, especially seasonal rainfall amounts. Range and livestock management decisions are dependent on weather information and informed judgment about what those weather conditions will be in the near and distant future. Further, numerous research projects conducted at the CRLRC are influenced by climatological factors and require historical and current data about weather conditions.
The objectives of this research report are to describe the climatic data of the CRLRC over the 18-year period for which detailed climate data exist, and to provide a baseline method by which these data can be updated and made available online for use by CRLRC researchers and others interested in weather conditions near Corona, New Mexico.
Weather Data Available for the Corona Ranch
The weather data reported for the CRLRC were accumulated from multiple sources, including four instrumented weather stations located on the ranch and eight rainfall gauges scattered at various locations across the ranch (Figure 1). The data are available for various temporal scales, from long-term averages down to seasonal, monthly, daily, and hourly averages. Daily and hourly weather observations are not reported in this research report but are available in spreadsheets and databases maintained at the Corona Ranch web site. The data are in varying degrees of completeness, especially at the hourly level.
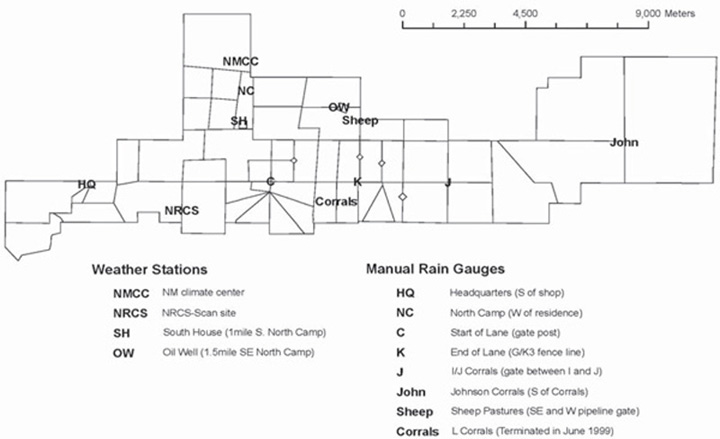
Figure1. Weather monitoring locations on the Corona Ranch.
Weather observations have been made on the Corona Ranch since 1990, at instrumented research sites referred to as South House (SH) (Latitude: 34° 16' 43" N, Longitude: 105° 23' 35" W, Elevation: 6,032 feet) and Oil Well (OW) (Latitude: 34° 17' 9" N, Longitude: 105° 21' 37" W, Elevation: 5,924 feet). Recorded data include hourly measurements of precipitation, air temperature, soil temperature at 10 cm (4 inches) and 50 cm (20 inches), relative humidity, wind speed and direction, and soil moisture at 10 cm (4 inches) and between 10 cm and 30 cm (4–12 inches). Approximately 88% of the elapsed hours over the July 1990 through 2007 period recorded a reading that appeared correct and was not clearly a missing or invalid recording.
Missing data for selected variables were substituted in the database from other automated weather stations located on the ranch, primarily the other research site (SH or OW) when available, and the NMSU New Mexico Climate Center automated weather station located at the North Camp facility on the Corona Ranch (NMCC, 2007). A paired t-test of all annual rainfall totals at SH and OW, excluding replaced data, indicated that rainfall totals were not statistically different between the two sites.
National Oceanic and Atmospheric Administration (NOAA) data from the Ramon and Corona 10 SW sites (WRCC, 2007) were also used to fill in missing data from 1990 through 1992. Variables are included in the Access database that identify which records were replaced from alternative sources and from where the data came. With these substitutions, the Access file titled "Corona_SH_and_OW_Weather_Data.mdb" includes a complete daily record for rainfall amounts over the period July 17, 1990 through December 31, 2007. Hourly estimates are provided over most days for both research sites.
Located at the North Camp facility (Latitude: 34° 17' 47.98" N, Longitude: 105° 23' 44.74" W, Elevation: 6,155 feet) on the Corona Ranch is another automated weather station included in the NMSU Climate Network, with weather observations made since 1993. Reported data include daily measurements of temperature, humidity, precipitation, wind speed and direction, solar radiation, and soil temperature (NMCC, 2007). These data are available online at http://weather.nmsu.edu and are not reported here.
Historical weather data, recorded prior to 1990, are not available on the Corona Ranch, but various estimates from nearby cooperating weather sites linked from the New Mexico Climate Center (NMCC, 2007) and from other Western Regional cooperator weather stations (NMCC, 2007; UCC, 2007) are available. Relevant cooperator sites include the Corona site (1914 –1977; WRCC, 2007; inactive station), Corona 11 SW (December 1977–September 1992; WRCC, 2007; inactive station), Corona 10 SW (October 1992–May 2006; UCC, 2007; active station), and Ramon 8 SW (March 1957–May 2006; UCC 2007; active station).
Soil volumetric water content (volume of water per volume of soil) at the SH and OW sites was recorded starting in 2001, using time domain reflectory (TDR) moisture probes (CS 615-L, Campbell Scientific Inc., Logan, UT, 1996). The two TDR probes are buried in the same configuration at each site, with one placed horizontally into the soil profile at a 10 cm depth and with the second probe positioned vertically at a 10 to 30 cm depth. All instrument readings are taken at one-minute intervals and averaged hourly.
The Natural Resources Conservation Service (NRCS) maintains a Soil Climate Analysis Network (SCAN) site on the Corona Ranch referred to as the "Adams site" (Figure 1) (Latitude: 34° 15' N, Longitude: 105° 25' W, Elevation: 6,175 feet). Automated SCAN sites collect soil moisture and soil temperature data along with precipitation, wind, and solar radiation data. SCAN sites are located throughout the United States and other global locations, and the data are used for the management and prediction of climatic issues affecting natural resources. The Adams site facility records hourly with soil moisture measured at 2, 4, 8, 20, and 40 inches (NRCS, 2007). Soil moisture data recorded at the NRCS Adams site use a TDR Hydra Probe II (Stevens Water Monitoring Systems, 2007). Though the Adams site was initiated in 1994, rainfall measurements appear to be complete and accurate only after October 2003. Apparently, valid soil moisture measurements begin at the Adams site in 1997. The Adams site data are downloaded monthly and maintained on the Corona web site in a database called "Adams_Weather.mdb."
Results
Rainfall
Long-term average rainfall for the Corona, New Mexico, area recorded between 1914 and 2006 was 14.6 inches with a standard deviation of 4.7 inches (Table 1). The minimum annual rainfall over the 1914–2007 period occurred in 1917 (5.81 inches) and the maximum occurred in 1941 (36 inches) (Figure 2). A similar extreme was recorded in many parts of New Mexico during 1941.
Table 1. Average, Minimum, Maximum, and Median Precipitation (in inches with mm in parentheses) Recorded by Month At or Near the Corona Ranch, 1914–2006.
| Month | Average | Standard Deviation | Minimum | Maximum | Median | n |
|
Jan |
0.64 (15.9) |
0.71 (16.3) |
0.00 (0.0) |
4.84 (92.0) |
0.51 (12.8) |
92 |
|
Feb |
0.70 (17.5) |
0.72 (17.4) |
0.00 (0.0) |
3.83 (88.1) |
0.52 (13.8) |
92 |
|
Mar |
0.74 (18.9) |
0.73 (18.4) |
0.00 (0.0) |
3.30 (83.8) |
0.54 (13.7) |
92 |
|
Apr |
0.73 (18.5) |
0.95 (24.2) |
0.00 (0.0) |
5.81 (147.6) |
0.40 (10.3) |
92 |
|
May |
1.11 (28.3) |
1.13 (28.7) |
0.00 (0.0) |
5.91 (150.1) |
0.82 (20.8) |
92 |
|
Jun |
1.27 (32.2) |
1.06 (26.7) |
0.00 (0.0) |
5.40 (137.2) |
0.99 (25.1) |
92 |
|
Jul |
2.45 (62.4) |
1.36 (34.3) |
0.10 (2.5) |
5.56 (141.2) |
2.19 (57.1) |
92 |
|
Aug |
2.75 (69.9) |
1.55 (39.4) |
0.00 (0.0) |
7.68 (195.1) |
2.45 (62.2) |
92 |
|
Sep |
1.70 (43.2) |
1.48 (37.7) |
0.00 (0.0) |
9.08 (230.6) |
1.47 (37.3) |
92 |
|
Oct |
1.13 (28.8) |
1.02 (25.9) |
0.00 (0.0) |
4.54 (115.3) |
0.86 (21.8) |
92 |
|
Nov |
0.59 (15.0) |
0.62 (15.8) |
0.00 (0.0) |
3.04 (77.2) |
0.45 (11.4) |
92 |
|
Dec |
0.77 (19.5) |
0.76 (19.2) |
0.00 (0.0) |
3.30 (83.8) |
0.51 (13.0) |
92 |
|
Annual |
14.59 (370.1) |
4.68 (118.6) |
5.81 (147.6) |
36.11 (917.2) |
14.36 (364.8) |
92 |
| Period: 1914–2006 (excluding 1977, when data was very incomplete). Weather Stations: Corona (1914–1976), NOAA Corona 11W (1976–1989), Oil Well and South House with some data from NOAA (1990–2006). | ||||||
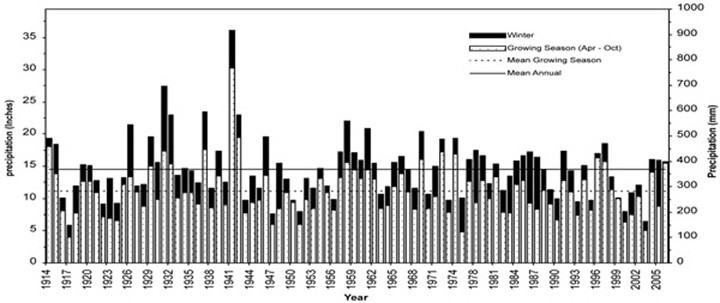
Figure 2. Historical Corona area seasonal and annual rainfall amounts.
Tables 2 through 4 show monthly rainfall amounts recorded at automated weather stations located at the SH, OW, and Adams sites (inches, mm, and combined averages across sites). Table 5 (inches) and Table 6 (mm) show monthly rainfall totals recorded at rain gauges scattered across the ranch (Figure 1). Figure 3 graphs average annual amounts recorded at the SH and OW sites. The 6-month growing season rainfall (considered to be April–October) usually made up well over half of the annual total rainfall amount. Seasonal extremes were realized in both 2005 and 2006. The winter of 2004–2005 was one of the wettest on record, whereas no daily rainfall total exceeded 6 mm (0.25 inches) on the ranch from mid-October 2005 until May 2006. This is not unlike many areas in New Mexico where drought conditions that started in the late 1990s were interrupted in late 2004 with one of the wettest winters on record, followed by a normal to above-average moisture year once the monsoon season started in June 2006. For some locations in the state, November 2005 to May 2006 precipitation was the lowest historically recorded amount.
Table 2. Total Monthly Precipitation (inches) Recorded at OW, SH, and Adams Weather Stations, 1990–2007*.
| Site OW | |||||||||||||
|
Year |
Jan |
Feb |
Mar |
Apr |
May |
Jun |
Jul |
Aug |
Sep |
Oct |
Nov |
Dec |
Annual Total |
|
1990 |
0.57 |
0.89 |
1.12 |
0.86 |
0.70 |
0.24 |
3.07 |
0.00 |
1.63 |
0.56 |
0.40 |
0.30 |
10.34 |
|
1991 |
0.20 |
0.17 |
0.45 |
0.00 |
1.34 |
0.93 |
3.58 |
2.69 |
2.63 |
0.69 |
1.40 |
2.42 |
16.50 |
|
1992 |
1.28 |
0.44 |
1.12 |
0.58 |
5.37 |
0.97 |
2.46 |
2.68 |
0.46 |
0.70 |
0.18 |
0.30 |
16.54 |
|
1993 |
0.68 |
0.48 |
0.19 |
0.23 |
0.78 |
1.59 |
1.65 |
1.66 |
0.31 |
1.65 |
0.55 |
0.15 |
9.92 |
|
1994 |
0.10 |
0.08 |
0.54 |
0.52 |
4.24 |
0.83 |
2.08 |
3.79 |
1.64 |
1.19 |
0.76 |
0.73 |
16.50 |
|
1995 |
0.31 |
0.28 |
0.61 |
0.41 |
0.59 |
0.96 |
2.07 |
2.10 |
1.71 |
0.00 |
0.06 |
0.25 |
9.35 |
|
1996 |
0.13 |
0.26 |
0.07 |
0.03 |
0.00 |
3.01 |
4.80 |
5.05 |
2.08 |
1.28 |
0.32 |
0.00 |
17.03 |
|
1997 |
0.15 |
1.12 |
0.11 |
2.18 |
1.13 |
3.34 |
1.52 |
4.17 |
2.51 |
0.65 |
0.52 |
0.94 |
18.34 |
|
1998 |
0.06 |
0.52 |
1.24 |
0.53 |
0.00 |
0.01 |
2.46 |
3.97 |
1.28 |
3.12 |
0.21 |
0.38 |
13.78 |
|
1999 |
0.00 |
0.00 |
0.00 |
0.65 |
1.20 |
1.48 |
3.41 |
1.69 |
1.16 |
0.35 |
0.00 |
0.17 |
10.11 |
|
2000 |
0.00 |
0.01 |
1.01 |
0.28 |
0.01 |
2.16 |
0.41 |
0.50 |
0.04 |
2.81 |
0.41 |
0.25 |
7.89 |
|
2001 |
0.42 |
0.70 |
0.75 |
0.18 |
1.11 |
0.70 |
1.45 |
2.78 |
0.93 |
0.20 |
1.22 |
0.20 |
10.64 |
|
2002 |
0.10 |
0.37 |
0.13 |
0.02 |
0.00 |
0.69 |
3.75 |
1.50 |
2.83 |
1.16 |
0.23 |
0.80 |
11.59 |
|
2003 |
0.00 |
0.25 |
0.36 |
0.30 |
0.41 |
0.31 |
1.73 |
0.82 |
0.44 |
1.07 |
0.54 |
0.24 |
6.47 |
|
2004 |
0.30 |
0.49 |
0.12 |
4.54 |
0.12 |
1.90 |
2.36 |
2.71 |
0.87 |
2.11 |
0.73 |
0.36 |
16.61 |
|
2005 |
4.84 |
3.83 |
0.62 |
0.26 |
2.55 |
0.00 |
0.00 |
1.19 |
1.38 |
1.19 |
0.01 |
0.00 |
15.86 |
|
2006 |
0.00 |
0.00 |
0.10 |
0.21 |
0.35 |
0.82 |
2.82 |
5.85 |
1.99 |
2.62 |
0.00 |
0.16 |
14.92 |
|
2007 |
0.00 |
0.17 |
1.51 |
0.41 |
2.87 |
1.65 |
1.37 |
1.03 |
2.03 |
0.49 |
0.55 |
0.42 |
12.50 |
|
Average |
0.51 |
0.56 |
0.56 |
0.68 |
1.27 |
1.20 |
2.28 |
2.45 |
1.44 |
1.21 |
0.45 |
0.45 |
13.05 |
| Site SH | |||||||||||||
|
Year |
Jan |
Feb |
Mar |
Apr |
May |
Jun |
Jul |
Aug |
Sep |
Oct |
Nov |
Dec |
Annual Total |
|
1990 |
0.57 |
0.89 |
1.12 |
0.86 |
0.70 |
0.24 |
2.28 |
0.00 |
1.63 |
0.56 |
0.41 |
0.29 |
9.55 |
|
1991 |
0.18 |
0.17 |
0.41 |
0.00 |
1.34 |
1.17 |
3.58 |
4.32 |
2.63 |
0.69 |
1.35 |
2.42 |
18.26 |
|
1992 |
1.28 |
0.44 |
1.30 |
0.53 |
5.36 |
0.62 |
0.04 |
0.77 |
0.67 |
0.73 |
0.16 |
0.21 |
12.11 |
|
1993 |
0.74 |
0.53 |
0.30 |
0.08 |
0.66 |
1.30 |
1.90 |
1.66 |
0.25 |
0.98 |
0.58 |
0.17 |
9.15 |
|
1994 |
0.09 |
0.09 |
0.50 |
0.39 |
3.79 |
0.74 |
1.82 |
2.22 |
1.53 |
1.10 |
0.74 |
0.74 |
13.75 |
|
1995 |
0.30 |
0.26 |
0.61 |
0.33 |
0.77 |
0.89 |
1.86 |
2.81 |
1.89 |
0.01 |
0.06 |
0.20 |
9.99 |
|
1996 |
0.16 |
0.20 |
0.06 |
0.02 |
0.00 |
3.01 |
4.80 |
5.05 |
2.08 |
1.28 |
0.32 |
0.00 |
16.98 |
|
1997 |
0.19 |
1.07 |
0.10 |
2.09 |
1.25 |
3.63 |
1.52 |
4.17 |
2.51 |
0.65 |
0.52 |
0.94 |
18.64 |
|
1998 |
0.00 |
0.20 |
1.02 |
0.48 |
0.03 |
0.01 |
2.71 |
3.75 |
1.47 |
2.81 |
0.20 |
0.33 |
13.01 |
|
1999 |
0.00 |
0.00 |
0.00 |
0.55 |
1.63 |
1.44 |
3.27 |
1.53 |
1.30 |
0.28 |
0.00 |
0.14 |
10.14 |
|
2000 |
0.00 |
0.00 |
0.92 |
0.28 |
0.05 |
2.04 |
0.41 |
0.50 |
0.04 |
3.15 |
0.40 |
0.19 |
7.98 |
|
2001 |
0.36 |
0.72 |
0.60 |
0.25 |
1.55 |
0.64 |
1.76 |
1.77 |
1.47 |
0.27 |
1.50 |
0.22 |
11.11 |
|
2002 |
0.19 |
0.34 |
0.21 |
0.02 |
0.00 |
0.69 |
3.50 |
1.83 |
3.46 |
1.13 |
0.40 |
0.89 |
12.67 |
|
2003 |
0.00 |
0.24 |
0.40 |
0.30 |
0.67 |
0.47 |
0.96 |
1.21 |
0.30 |
1.09 |
0.55 |
0.30 |
6.49 |
|
2004 |
0.26 |
0.52 |
0.15 |
4.12 |
0.24 |
1.18 |
1.98 |
3.96 |
0.92 |
1.90 |
0.68 |
0.36 |
16.27 |
|
2005 |
4.84 |
3.83 |
0.68 |
0.26 |
2.17 |
0.94 |
0.91 |
2.65 |
1.21 |
1.10 |
0.01 |
0.00 |
18.59 |
|
2006 |
0.00 |
0.00 |
0.12 |
0.15 |
0.26 |
0.89 |
3.55 |
6.74 |
2.03 |
2.52 |
0.00 |
0.16 |
16.42 |
|
2007 |
0.00 |
0.08 |
1.10 |
0.39 |
3.18 |
1.63 |
1.73 |
0.58 |
2.85 |
0.00 |
0.55 |
0.42 |
12.51 |
|
Average |
0.51 |
0.53 |
0.53 |
0.62 |
1.31 |
1.20 |
2.14 |
2.53 |
1.57 |
1.12 |
0.47 |
0.44 |
12.98 |
| Site Adams | |||||||||||||
|
Year |
Jan |
Feb |
Mar |
Apr |
May |
Jun |
Jul |
Aug |
Sep |
Oct |
Nov |
Dec |
Annual Total |
|
2004 |
0.30 |
0.64 |
0.17 |
4.33 |
0.48 |
1.23 |
2.49 |
2.49 |
0.77 |
1.65 |
0.63 |
0.15 |
15.33 |
|
2005 |
1.19 |
1.08 |
0.62 |
0.26 |
2.44 |
1.13 |
1.11 |
3.15 |
1.20 |
1.13 |
0.00 |
0.00 |
13.31 |
|
2006 |
0.00 |
0.00 |
0.09 |
0.27 |
0.32 |
1.33 |
2.79 |
6.02 |
2.24 |
2.65 |
0.00 |
0.02 |
15.73 |
|
2007 |
0.35 |
0.09 |
0.92 |
0.76 |
2.73 |
1.43 |
1.54 |
1.25 |
2.39 |
0.48 |
0.04 |
0.88 |
12.86 |
|
Average |
0.46 |
0.45 |
0.45 |
1.41 |
1.49 |
1.28 |
1.98 |
3.23 |
1.65 |
1.48 |
0.17 |
0.26 |
14.31 |
| *Bold number is highest recorded monthly precipitation over the period. Rows with incomplete data are not included in the average. | |||||||||||||
Table 3. Total Monthly Precipitation (mm) Recorded at OW, SH and Adams Weather Stations, 1990–2007*.
| Site OW | |||||||||||||
|
Year |
Jan |
Feb |
Mar |
Apr |
May |
Jun |
Jul |
Aug |
Sep |
Oct |
Nov |
Dec |
Annual Total |
|
1990 |
14 |
23 |
28 |
22 |
18 |
6 |
78 |
0 |
41 |
14 |
10 |
8 |
263 |
|
1991 |
5 |
4 |
11 |
0 |
34 |
24 |
91 |
68 |
67 |
18 |
36 |
61 |
419 |
|
1992 |
33 |
11 |
28 |
15 |
136 |
25 |
62 |
68 |
12 |
18 |
5 |
8 |
420 |
|
1993 |
17 |
12 |
5 |
6 |
20 |
40 |
42 |
42 |
8 |
42 |
14 |
4 |
252 |
|
1994 |
3 |
2 |
14 |
13 |
108 |
21 |
53 |
96 |
42 |
30 |
19 |
19 |
419 |
|
1995 |
8 |
7 |
15 |
10 |
15 |
24 |
53 |
53 |
43 |
0 |
2 |
6 |
237 |
|
1996 |
3 |
7 |
2 |
1 |
0 |
76 |
122 |
128 |
53 |
33 |
8 |
0 |
433 |
|
1997 |
4 |
28 |
3 |
55 |
29 |
85 |
39 |
106 |
64 |
17 |
13 |
24 |
466 |
|
1998 |
2 |
13 |
31 |
13 |
0 |
0 |
62 |
101 |
33 |
79 |
5 |
10 |
350 |
|
1999 |
0 |
0 |
0 |
17 |
30 |
38 |
87 |
43 |
29 |
9 |
0 |
4 |
257 |
|
2000 |
0 |
0 |
26 |
7 |
0 |
55 |
10 |
13 |
1 |
71 |
10 |
6 |
200 |
|
2001 |
11 |
18 |
19 |
5 |
28 |
18 |
37 |
71 |
24 |
5 |
31 |
5 |
270 |
|
2002 |
3 |
9 |
3 |
1 |
0 |
18 |
95 |
38 |
72 |
29 |
6 |
20 |
294 |
|
2003 |
0 |
6 |
9 |
8 |
10 |
8 |
44 |
21 |
11 |
27 |
14 |
6 |
164 |
|
2004 |
8 |
12 |
3 |
115 |
3 |
48 |
60 |
69 |
22 |
54 |
19 |
9 |
422 |
|
2005 |
123 |
97 |
16 |
7 |
65 |
0 |
0 |
30 |
35 |
30 |
0 |
0 |
403 |
|
2006 |
0 |
0 |
3 |
5 |
9 |
21 |
72 |
149 |
51 |
67 |
0 |
4 |
379 |
|
2007 |
0 |
4 |
38 |
10 |
73 |
42 |
35 |
26 |
52 |
12 |
14 |
11 |
317 |
|
Average |
13 |
14 |
14 |
17 |
32 |
30 |
58 |
62 |
37 |
31 |
11 |
11 |
331 |
| Site SH | |||||||||||||
|
Year |
Jan |
Feb |
Mar |
Apr |
May |
Jun |
Jul |
Aug |
Sep |
Oct |
Nov |
Dec |
Annual Total |
|
1990 |
14 |
23 |
28 |
22 |
18 |
6 |
58 |
0 |
41 |
14 |
10 |
7 |
243 |
|
1991 |
5 |
4 |
10 |
0 |
34 |
30 |
91 |
110 |
67 |
18 |
34 |
61 |
464 |
|
1992 |
33 |
11 |
33 |
13 |
136 |
16 |
1 |
20 |
17 |
19 |
4 |
5 |
308 |
|
1993 |
19 |
13 |
8 |
2 |
17 |
33 |
48 |
42 |
6 |
25 |
15 |
4 |
232 |
|
1994 |
2 |
2 |
13 |
10 |
96 |
19 |
46 |
56 |
39 |
28 |
19 |
19 |
349 |
|
1995 |
8 |
7 |
15 |
8 |
20 |
23 |
47 |
71 |
48 |
0 |
2 |
5 |
254 |
|
1996 |
4 |
5 |
2 |
1 |
0 |
76 |
122 |
128 |
53 |
33 |
8 |
0 |
431 |
|
1997 |
5 |
27 |
3 |
53 |
32 |
92 |
39 |
106 |
64 |
17 |
13 |
24 |
473 |
|
1998 |
0 |
5 |
26 |
12 |
1 |
0 |
69 |
95 |
37 |
71 |
5 |
8 |
330 |
|
1999 |
0 |
0 |
0 |
14 |
41 |
37 |
83 |
39 |
33 |
7 |
0 |
4 |
258 |
|
2000 |
0 |
0 |
23 |
7 |
1 |
52 |
10 |
13 |
1 |
80 |
10 |
5 |
203 |
|
2001 |
9 |
18 |
15 |
6 |
39 |
16 |
45 |
45 |
37 |
7 |
38 |
6 |
282 |
|
2002 |
5 |
9 |
5 |
1 |
0 |
18 |
89 |
46 |
88 |
29 |
10 |
23 |
322 |
|
2003 |
0 |
6 |
10 |
8 |
17 |
12 |
24 |
31 |
8 |
28 |
14 |
8 |
165 |
|
2004 |
7 |
13 |
4 |
105 |
6 |
30 |
50 |
101 |
23 |
48 |
17 |
9 |
413 |
|
2005 |
123 |
97 |
17 |
7 |
55 |
24 |
23 |
67 |
31 |
28 |
0 |
0 |
472 |
|
2006 |
0 |
0 |
3 |
4 |
7 |
23 |
90 |
171 |
52 |
64 |
0 |
4 |
417 |
|
2007 |
0 |
2 |
28 |
10 |
81 |
41 |
44 |
15 |
72 |
0 |
14 |
11 |
318 |
|
Average |
13 |
14 |
14 |
16 |
33 |
30 |
54 |
64 |
40 |
29 |
12 |
11 |
330 |
| Site Adams | |||||||||||||
|
Year |
Jan |
Feb |
Mar |
Apr |
May |
Jun |
Jul |
Aug |
Sep |
Oct |
Nov |
Dec |
Annual Total |
|
2004 |
8 |
16 |
4 |
110 |
12 |
31 |
63 |
63 |
20 |
42 |
16 |
4 |
389 |
|
2005 |
30 |
27 |
16 |
7 |
62 |
29 |
28 |
80 |
30 |
29 |
0 |
0 |
338 |
|
2006 |
0 |
0 |
2 |
7 |
8 |
34 |
71 |
153 |
57 |
67 |
0 |
1 |
400 |
|
2007 |
9 |
2 |
23 |
19 |
69 |
36 |
39 |
32 |
61 |
12 |
1 |
22 |
327 |
|
Average |
12 |
11 |
11 |
36 |
38 |
33 |
50 |
82 |
42 |
38 |
4 |
7 |
363 |
| *Bold number is highest recorded monthly precipitation over the period. Rows with incomplete data are not included in the average. | |||||||||||||
Table 4a. Average Total Monthly Precipitation (inches) Averaged Across OW and SH Weather Stations.*
|
Year |
Jan |
Feb |
Mar |
Apr |
May |
Jun |
Jul |
Aug |
Sep |
Oct |
Nov |
Dec |
Apr-Oct Total |
Winter Total |
Annual Total |
|
1990 |
0.57 |
0.89 |
1.12 |
0.86 |
0.70 |
0.24 |
2.67 |
0.00 |
1.63 |
0.56 |
0.40 |
0.29 |
6.66 |
3.28 |
9.94 |
|
1991 |
0.19 |
0.17 |
0.43 |
0.00 |
1.34 |
1.05 |
3.58 |
3.50 |
2.63 |
0.69 |
1.37 |
2.42 |
12.79 |
4.59 |
17.38 |
|
1992 |
1.28 |
0.44 |
1.21 |
0.56 |
5.36 |
0.79 |
1.25 |
1.73 |
0.56 |
0.71 |
0.17 |
0.25 |
10.97 |
3.35 |
14.32 |
|
1993 |
0.71 |
0.50 |
0.24 |
0.15 |
0.72 |
1.44 |
1.77 |
1.66 |
0.28 |
1.32 |
0.56 |
0.16 |
7.35 |
2.18 |
9.53 |
|
1994 |
0.09 |
0.08 |
0.52 |
0.45 |
4.02 |
0.79 |
1.95 |
3.01 |
1.58 |
1.14 |
0.75 |
0.73 |
12.94 |
2.18 |
15.13 |
|
1995 |
0.30 |
0.27 |
0.61 |
0.37 |
0.68 |
0.92 |
1.97 |
2.45 |
1.80 |
0.00 |
0.06 |
0.22 |
8.20 |
1.47 |
9.67 |
|
1996 |
0.14 |
0.23 |
0.06 |
0.02 |
0.00 |
3.01 |
4.80 |
5.05 |
2.08 |
1.28 |
0.32 |
0.00 |
16.25 |
0.76 |
17.01 |
|
1997 |
0.17 |
1.09 |
0.10 |
2.14 |
1.19 |
3.49 |
1.52 |
4.17 |
2.51 |
0.65 |
0.52 |
0.94 |
15.66 |
2.83 |
18.49 |
|
1998 |
0.03 |
0.36 |
1.13 |
0.50 |
0.01 |
0.01 |
2.59 |
3.86 |
1.37 |
2.96 |
0.20 |
0.35 |
11.32 |
2.08 |
13.40 |
|
1999 |
0.00 |
0.00 |
0.00 |
0.60 |
1.41 |
1.46 |
3.34 |
1.61 |
1.23 |
0.31 |
0.00 |
0.15 |
9.97 |
0.15 |
10.13 |
|
2000 |
0.00 |
0.00 |
0.97 |
0.28 |
0.03 |
2.10 |
0.41 |
0.50 |
0.04 |
2.98 |
0.40 |
0.22 |
6.34 |
1.60 |
7.93 |
|
2001 |
0.39 |
0.71 |
0.67 |
0.21 |
1.33 |
0.67 |
1.60 |
2.28 |
1.20 |
0.23 |
1.36 |
0.21 |
7.53 |
3.34 |
10.87 |
|
2002 |
0.14 |
0.35 |
0.17 |
0.02 |
0.00 |
0.69 |
3.62 |
1.66 |
3.14 |
1.14 |
0.31 |
0.84 |
10.29 |
1.83 |
12.13 |
|
2003 |
0.00 |
0.24 |
0.38 |
0.30 |
0.54 |
0.39 |
1.34 |
1.02 |
0.37 |
1.08 |
0.54 |
0.27 |
5.04 |
1.44 |
6.48 |
|
2004 |
0.28 |
0.50 |
0.13 |
4.33 |
0.18 |
1.54 |
2.17 |
3.33 |
0.89 |
2.00 |
0.70 |
0.36 |
14.46 |
1.98 |
16.44 |
|
2005 |
4.84 |
3.83 |
0.65 |
0.26 |
2.36 |
0.47 |
0.45 |
1.92 |
1.29 |
1.14 |
0.01 |
0.00 |
7.90 |
9.32 |
17.23 |
|
2006 |
0.00 |
0.00 |
0.11 |
0.18 |
0.30 |
0.85 |
3.18 |
6.30 |
2.01 |
2.57 |
0.00 |
0.16 |
15.40 |
0.27 |
15.67 |
|
2007 |
0.00 |
0.12 |
1.31 |
0.40 |
3.03 |
1.64 |
1.55 |
0.80 |
2.44 |
0.24 |
0.55 |
0.42 |
10.10 |
2.40 |
12.50 |
|
Average |
0.51 |
0.55 |
0.55 |
0.65 |
1.29 |
1.20 |
2.21 |
2.49 |
1.50 |
1.17 |
0.46 |
0.45 |
10.51 |
2.50 |
13.01 |
Table 4b. Average Total Monthly Precipitation (mm) Averaged Across OW and SH Weather Stations.*
|
Year |
Jan |
Feb |
Mar |
Apr |
May |
Jun |
Jul |
Aug |
Sep |
Oct |
Nov |
Dec |
Apr-Oct Total |
Winter Total |
Annual Total |
|
1990 |
14 |
23 |
28 |
22 |
18 |
6 |
68 |
0 |
41 |
14 |
10 |
7 |
169 |
83 |
253 |
|
1991 |
5 |
4 |
11 |
0 |
34 |
27 |
91 |
89 |
67 |
18 |
35 |
61 |
325 |
116 |
441 |
|
1992 |
33 |
11 |
31 |
14 |
136 |
20 |
32 |
44 |
14 |
18 |
4 |
6 |
279 |
85 |
364 |
|
1993 |
18 |
13 |
6 |
4 |
18 |
37 |
45 |
42 |
7 |
33 |
14 |
4 |
187 |
55 |
242 |
|
1994 |
2 |
2 |
13 |
12 |
102 |
20 |
50 |
76 |
40 |
29 |
19 |
19 |
329 |
55 |
384 |
|
1995 |
8 |
7 |
15 |
9 |
17 |
23 |
50 |
62 |
46 |
0 |
2 |
6 |
208 |
37 |
246 |
|
1996 |
4 |
6 |
2 |
1 |
0 |
76 |
122 |
128 |
53 |
33 |
8 |
0 |
413 |
19 |
432 |
|
1997 |
4 |
28 |
3 |
54 |
30 |
89 |
39 |
106 |
64 |
17 |
13 |
24 |
398 |
72 |
470 |
|
1998 |
1 |
9 |
29 |
13 |
0 |
0 |
66 |
98 |
35 |
75 |
5 |
9 |
287 |
53 |
340 |
|
1999 |
0 |
0 |
0 |
15 |
36 |
37 |
85 |
41 |
31 |
8 |
0 |
4 |
253 |
4 |
257 |
|
2000 |
0 |
0 |
25 |
7 |
1 |
53 |
10 |
13 |
1 |
76 |
10 |
6 |
161 |
41 |
202 |
|
2001 |
10 |
18 |
17 |
5 |
34 |
17 |
41 |
58 |
30 |
6 |
35 |
5 |
191 |
85 |
276 |
|
2002 |
4 |
9 |
4 |
1 |
0 |
18 |
92 |
42 |
80 |
29 |
8 |
21 |
261 |
47 |
308 |
|
2003 |
0 |
6 |
10 |
8 |
14 |
10 |
34 |
26 |
9 |
27 |
14 |
7 |
128 |
37 |
165 |
|
2004 |
7 |
13 |
3 |
110 |
5 |
39 |
55 |
85 |
23 |
51 |
18 |
9 |
367 |
50 |
418 |
|
2005 |
123 |
97 |
17 |
7 |
60 |
12 |
12 |
49 |
33 |
29 |
0 |
0 |
201 |
237 |
438 |
|
2006 |
0 |
0 |
3 |
5 |
8 |
22 |
81 |
160 |
51 |
65 |
0 |
4 |
391 |
7 |
398 |
|
2007 |
0 |
3 |
33 |
10 |
77 |
42 |
39 |
20 |
62 |
6 |
14 |
11 |
257 |
61 |
318 |
|
Average |
13 |
14 |
14 |
16 |
33 |
30 |
56 |
63 |
38 |
30 |
12 |
11 |
267 |
64 |
331 |
| *Bold number is highest recorded monthly precipitation over the period. Rows with incomplete data are not included in the average. | |||||||||||||||
Table 5. Total Monthly Precipitation (inches) Recorded at Various Rain Gauges, 1994–2007.
| Site HQ | |||||||||||||
|
Year |
Jan |
Feb |
Mar |
Apr |
May |
Jun |
Jul |
Aug |
Sep |
Oct |
Nov |
Dec |
Annual Total |
|
1994 |
0.00 |
0.00 |
0.95 |
0.97 |
3.27 |
1.13 |
2.79 |
2.36 |
1.17 |
0.92 |
1.00 |
0.75 |
15.31 |
|
1995 |
0.29 |
0.00 |
1.25 |
0.00 |
0.65 |
0.82 |
2.28 |
3.17 |
2.21 |
0.00 |
0.00 |
0.13 |
10.81 |
|
1996 |
0.00 |
0.82 |
0.00 |
0.00 |
0.00 |
1.98 |
4.79 |
5.00 |
3.03 |
2.16 |
0.15 |
0.00 |
17.94 |
|
1997 |
0.83 |
0.63 |
0.49 |
0.94 |
1.36 |
5.60 |
2.19 |
4.96 |
3.84 |
0.70 |
0.70 |
2.48 |
24.73 |
|
1998 |
0.00 |
0.20 |
1.62 |
0.70 |
0.10 |
0.00 |
2.55 |
3.45 |
0.61 |
3.39 |
1.32 |
0.47 |
14.41 |
|
1999 |
0.48 |
0.00 |
1.21 |
0.68 |
2.01 |
2.38 |
2.83 |
4.23 |
0.68 |
0.33 |
0.00 |
0.57 |
15.40 |
|
2000 |
0.01 |
0.00 |
1.17 |
0.62 |
0.01 |
1.29 |
1.11 |
1.06 |
0.19 |
2.85 |
1.69 |
1.09 |
11.09 |
|
2001 |
1.60 |
0.73 |
1.22 |
0.26 |
1.41 |
0.86 |
5.03 |
1.86 |
4.01 |
0.30 |
1.55 |
0.19 |
19.03 |
|
2002 |
0.58 |
0.00 |
0.40 |
0.04 |
0.00 |
0.21 |
4.36 |
1.97 |
3.58 |
1.33 |
0.60 |
2.32 |
15.39 |
|
2003 |
0.00 |
0.30 |
0.00 |
0.95 |
0.18 |
0.37 |
0.96 |
3.53 |
0.36 |
1.24 |
1.37 |
0.31 |
9.57 |
|
2004 |
1.30 |
1.98 |
0.58 |
6.18 |
0.11 |
1.55 |
2.41 |
3.49 |
1.22 |
2.94 |
2.04 |
0.56 |
24.37 |
|
2005 |
1.11 |
0.85 |
0.90 |
0.14 |
3.62 |
1.14 |
0.41 |
2.60 |
1.54 |
1.39 |
0.00 |
0.00 |
13.70 |
|
2006 |
0.00 |
0.00 |
0.12 |
0.02 |
0.50 |
0.78 |
2.96 |
6.09 |
1.31 |
1.43 |
0.28 |
0.70 |
14.19 |
|
2007 |
0.73 |
0.46 |
1.33 |
0.32 |
3.99 |
1.56 |
1.22 |
1.23 |
2.87 |
0.34 |
0.00 |
0.90 |
14.95 |
|
Average |
0.50 |
0.43 |
0.80 |
0.84 |
1.23 |
1.41 |
2.56 |
3.22 |
1.90 |
1.38 |
0.76 |
0.75 |
15.78 |
| Site NC | |||||||||||||
|
Year |
Jan |
Feb |
Mar |
Apr |
May |
Jun |
Jul |
Aug |
Sep |
Oct |
Nov |
Dec |
Annual Total |
|
1994 |
1.22 |
3.13 |
1.38 |
0.87 |
0.59 |
0.61 |
|||||||
|
1995 |
0.23 |
0.00 |
0.80 |
0.00 |
0.59 |
0.79 |
2.73 |
2.80 |
2.01 |
0.00 |
0.00 |
0.14 |
10.10 |
|
1996 |
0.00 |
0.48 |
0.02 |
0.00 |
0.00 |
2.37 |
4.93 |
5.66 |
2.35 |
2.27 |
0.12 |
0.00 |
18.21 |
|
1997 |
1.01 |
0.68 |
0.36 |
1.32 |
1.31 |
4.24 |
1.86 |
3.95 |
4.40 |
1.04 |
0.00 |
1.13 |
21.30 |
|
1998 |
0.00 |
0.33 |
1.29 |
0.53 |
0.03 |
0.02 |
3.41 |
3.45 |
1.40 |
2.25 |
1.22 |
0.46 |
14.39 |
|
1999 |
0.35 |
0.00 |
0.95 |
0.34 |
1.70 |
1.40 |
3.43 |
2.53 |
1.89 |
0.21 |
0.00 |
0.40 |
13.20 |
|
2000 |
0.02 |
0.00 |
0.91 |
0.49 |
0.01 |
1.19 |
2.03 |
0.88 |
0.25 |
4.06 |
1.26 |
0.64 |
11.74 |
|
2001 |
1.54 |
0.66 |
0.68 |
0.20 |
1.78 |
0.89 |
2.98 |
2.43 |
1.37 |
0.27 |
2.76 |
0.13 |
15.70 |
|
2002 |
0.59 |
0.00 |
0.70 |
0.16 |
0.00 |
0.37 |
3.12 |
1.28 |
4.19 |
1.33 |
0.42 |
2.10 |
14.26 |
|
2003 |
0.00 |
0.26 |
0.46 |
0.32 |
0.00 |
0.47 |
1.14 |
2.16 |
0.28 |
1.83 |
0.60 |
0.14 |
7.66 |
|
2004 |
1.43 |
2.20 |
0.50 |
4.69 |
0.02 |
1.53 |
1.35 |
3.15 |
1.16 |
2.36 |
0.55 |
0.06 |
19.00 |
|
2005 |
1.01 |
0.79 |
0.59 |
0.08 |
4.00 |
1.35 |
0.94 |
2.97 |
1.35 |
1.26 |
0.00 |
0.00 |
14.34 |
|
2006 |
0.00 |
0.00 |
0.05 |
0.22 |
0.38 |
0.88 |
3.35 |
7.75 |
1.94 |
2.62 |
0.21 |
0.60 |
18.00 |
|
2007 |
1.65 |
0.28 |
1.23 |
0.45 |
3.41 |
1.94 |
2.53 |
0.45 |
2.97 |
0.60 |
0.40 |
0.53 |
16.44 |
|
Average |
0.60 |
0.44 |
0.66 |
0.68 |
1.02 |
1.34 |
2.50 |
3.04 |
1.92 |
1.50 |
0.58 |
0.50 |
14.95 |
| Site C | |||||||||||||
|
Year |
Jan |
Feb |
Mar |
Apr |
May |
Jun |
Jul |
Aug |
Sep |
Oct |
Nov |
Dec |
Annual Total |
|
1999 |
2.88 |
2.34 |
1.65 |
0.42 |
|||||||||
|
2000 |
0.17 |
0.00 |
0.52 |
1.05 |
0.34 |
0.18 |
2.91 |
||||||
|
2001 |
0.14 |
1.77 |
0.92 |
1.71 |
1.96 |
1.54 |
0.32 |
||||||
|
2002 |
0.17 |
0.00 |
0.81 |
3.34 |
1.62 |
2.91 |
1.36 |
0.34 |
1.96 |
||||
|
2003 |
0.00 |
0.17 |
0.15 |
0.34 |
0.00 |
0.65 |
0.64 |
2.19 |
0.16 |
1.06 |
0.60 |
0.14 |
6.10 |
|
2004 |
1.41 |
1.42 |
0.41 |
4.54 |
0.01 |
2.01 |
2.60 |
4.57 |
1.14 |
2.29 |
0.62 |
0.08 |
21.10 |
|
2005 |
1.07 |
1.10 |
0.87 |
0.07 |
1.88 |
0.95 |
1.34 |
3.32 |
2.09 |
1.08 |
0.00 |
0.00 |
13.77 |
|
2006 |
0.00 |
0.00 |
0.04 |
0.16 |
0.36 |
0.93 |
3.53 |
7.02 |
2.06 |
2.77 |
0.22 |
0.64 |
17.73 |
|
2007 |
0.88 |
0.21 |
1.31 |
0.37 |
2.61 |
1.20 |
1.99 |
0.27 |
2.30 |
0.51 |
0.45 |
0.50 |
12.60 |
|
Average |
0.67 |
0.58 |
0.56 |
0.75 |
0.83 |
1.00 |
2.12 |
2.63 |
1.56 |
1.41 |
0.37 |
0.55 |
14.26 |
| Site Corrals/K | |||||||||||||
|
Year |
Jan |
Feb |
Mar |
Apr |
May |
Jun |
Jul |
Aug |
Sep |
Oct |
Nov |
Dec |
Annual Total |
|
1994 |
0.00 |
1.16 |
2.01 |
2.68 |
0.90 |
0.70 |
0.70 |
||||||
|
1995 |
0.26 |
0.00 |
0.60 |
0.00 |
0.55 |
1.25 |
2.02 |
2.78 |
1.83 |
0.00 |
0.00 |
0.20 |
9.49 |
|
1996 |
0.00 |
0.66 |
0.05 |
0.00 |
0.00 |
3.11 |
4.56 |
3.97 |
1.96 |
0.89 |
0.00 |
0.00 |
15.21 |
|
1997 |
0.70 |
0.66 |
0.34 |
2.55 |
1.42 |
3.55 |
1.67 |
3.52 |
2.00 |
0.69 |
0.14 |
0.99 |
18.23 |
|
1998 |
0.00 |
0.28 |
1.08 |
0.48 |
0.00 |
0.03 |
3.42 |
5.40 |
0.34 |
3.37 |
1.48 |
0.54 |
16.42 |
|
1999 |
0.33 |
0.00 |
0.94 |
0.48 |
1.81 |
1.63 |
3.78 |
2.18 |
2.06 |
0.28 |
|||
|
2000 |
0.19 |
0.00 |
0.23 |
2.77 |
1.03 |
0.16 |
2.93 |
||||||
|
2001 |
0.13 |
1.91 |
0.99 |
1.54 |
1.98 |
2.39 |
0.34 |
||||||
|
2002 |
0.15 |
0.00 |
0.67 |
3.10 |
1.98 |
4.31 |
1.37 |
0.28 |
1.95 |
||||
|
2003 |
0.00 |
0.12 |
0.19 |
0.36 |
0.00 |
0.89 |
0.83 |
1.92 |
0.27 |
1.02 |
0.62 |
0.13 |
6.35 |
|
2004 |
0.73 |
1.13 |
0.18 |
4.69 |
0.00 |
1.40 |
2.28 |
3.33 |
1.29 |
2.01 |
0.69 |
0.07 |
17.81 |
|
2005 |
1.14 |
1.13 |
0.73 |
0.09 |
1.71 |
0.35 |
1.55 |
3.67 |
3.55 |
1.32 |
0.00 |
0.00 |
15.24 |
|
2006 |
0.00 |
0.00 |
0.05 |
0.16 |
0.36 |
0.54 |
3.68 |
8.06 |
2.47 |
2.90 |
0.24 |
0.55 |
19.01 |
|
2007 |
0.51 |
0.22 |
1.40 |
0.26 |
2.57 |
1.14 |
1.05 |
0.24 |
1.92 |
0.60 |
0.39 |
0.47 |
10.77 |
|
Average |
0.37 |
0.42 |
0.56 |
0.73 |
0.79 |
1.13 |
2.39 |
3.01 |
1.95 |
1.33 |
0.41 |
0.51 |
14.28 |
| Site J | |||||||||||||
|
Year |
Jan |
Feb |
Mar |
Apr |
May |
Jun |
Jul |
Aug |
Sep |
Oct |
Nov |
Dec |
Annual Total |
|
1999 |
4.07 |
2.41 |
1.37 |
0.43 |
0.00 |
||||||||
|
2000 |
0.14 |
0.00 |
0.28 |
1.01 |
0.59 |
0.28 |
3.25 |
||||||
|
2001 |
0.24 |
1.36 |
0.42 |
2.32 |
3.04 |
2.38 |
0.32 |
||||||
|
2002 |
0.10 |
0.00 |
0.44 |
3.97 |
2.04 |
3.38 |
1.51 |
0.21 |
1.86 |
||||
|
2003 |
0.00 |
0.17 |
0.01 |
0.27 |
0.00 |
1.82 |
0.95 |
1.22 |
0.26 |
1.08 |
0.64 |
0.07 |
6.49 |
|
2004 |
0.24 |
1.01 |
0.29 |
6.09 |
0.00 |
1.52 |
2.12 |
2.61 |
1.59 |
2.34 |
0.84 |
0.07 |
18.72 |
|
2005 |
1.16 |
1.20 |
0.99 |
0.30 |
1.52 |
0.26 |
0.91 |
4.03 |
3.29 |
1.57 |
0.00 |
0.00 |
15.23 |
|
2006 |
0.00 |
0.00 |
0.06 |
0.20 |
0.45 |
0.76 |
4.52 |
6.85 |
3.53 |
3.05 |
0.15 |
0.57 |
20.14 |
|
2007 |
0.16 |
0.19 |
1.25 |
0.28 |
3.88 |
0.92 |
0.26 |
0.00 |
2.54 |
0.60 |
0.43 |
0.44 |
10.95 |
|
Average |
0.31 |
0.51 |
0.52 |
0.95 |
0.90 |
0.80 |
2.24 |
2.53 |
2.07 |
1.57 |
0.32 |
0.50 |
14.31 |
| Site Johnson | |||||||||||||
|
Year |
Jan |
Feb |
Mar |
Apr |
May |
Jun |
Jul |
Aug |
Sep |
Oct |
Nov |
Dec |
Annual Total |
|
1994 |
0.00 |
1.20 |
2.62 |
0.98 |
0.70 |
0.55 |
0.25 |
||||||
|
1995 |
0.08 |
0.00 |
0.75 |
0.00 |
0.40 |
1.39 |
1.56 |
1.17 |
0.93 |
0.00 |
0.00 |
0.32 |
6.61 |
|
1996 |
0.00 |
0.58 |
0.02 |
0.00 |
0.00 |
3.01 |
3.17 |
2.14 |
3.85 |
0.40 |
0.00 |
0.00 |
13.18 |
|
1997 |
0.70 |
0.40 |
0.19 |
2.00 |
0.47 |
3.11 |
1.39 |
5.12 |
2.01 |
0.37 |
0.00 |
1.75 |
17.52 |
|
1998 |
0.00 |
0.28 |
1.75 |
0.81 |
0.00 |
0.05 |
2.62 |
3.69 |
0.66 |
2.03 |
1.19 |
0.52 |
13.60 |
|
1999 |
0.13 |
0.00 |
0.79 |
1.69 |
1.35 |
2.91 |
2.30 |
1.05 |
1.32 |
0.28 |
|||
|
2000 |
0.16 |
0.00 |
0.27 |
2.25 |
0.54 |
0.14 |
2.92 |
||||||
|
2001 |
0.35 |
1.08 |
0.87 |
1.54 |
2.20 |
0.98 |
0.37 |
||||||
|
2002 |
0.04 |
0.00 |
0.42 |
3.37 |
2.22 |
2.93 |
1.40 |
0.17 |
1.71 |
||||
|
2003 |
0.00 |
0.00 |
0.05 |
0.37 |
0.00 |
1.70 |
0.29 |
3.13 |
0.39 |
1.01 |
0.62 |
0.03 |
7.59 |
|
2004 |
0.38 |
0.91 |
0.00 |
3.43 |
0.00 |
0.98 |
1.93 |
2.73 |
1.51 |
3.53 |
0.48 |
0.04 |
15.93 |
|
2005 |
0.85 |
0.87 |
0.53 |
0.16 |
1.78 |
0.21 |
1.33 |
3.50 |
3.83 |
1.40 |
0.00 |
0.00 |
14.46 |
|
2006 |
0.00 |
0.00 |
0.05 |
0.19 |
0.45 |
0.33 |
4.04 |
6.17 |
4.23 |
2.65 |
0.13 |
0.49 |
18.73 |
|
2007 |
0.03 |
0.24 |
0.66 |
0.13 |
2.39 |
0.72 |
0.00 |
0.00 |
3.15 |
0.85 |
0.00 |
0.40 |
8.58 |
|
Average |
0.22 |
0.33 |
0.48 |
0.72 |
0.61 |
1.14 |
1.93 |
2.59 |
1.92 |
1.28 |
0.29 |
0.50 |
12.91 |
| Site Sheep | |||||||||||||
|
Year |
Jan |
Feb |
Mar |
Apr |
May |
Jun |
Jul |
Aug |
Sep |
Oct |
Nov |
Dec |
Annual Total |
|
1999 |
3.38 |
2.17 |
1.22 |
0.16 |
0.00 |
||||||||
|
2000 |
0.20 |
0.01 |
0.82 |
4.20 |
0.58 |
0.18 |
2.99 |
||||||
|
2001 |
0.22 |
1.62 |
0.82 |
2.33 |
3.16 |
2.09 |
0.29 |
||||||
|
2002 |
0.00 |
0.00 |
0.43 |
3.30 |
1.50 |
2.77 |
1.24 |
0.39 |
2.05 |
||||
|
2003 |
0.00 |
0.16 |
0.32 |
0.44 |
0.00 |
0.31 |
1.10 |
1.97 |
0.38 |
1.03 |
0.58 |
0.08 |
6.37 |
|
2004 |
1.07 |
1.04 |
0.27 |
4.71 |
0.00 |
1.68 |
1.47 |
2.75 |
1.20 |
2.30 |
0.56 |
0.06 |
17.12 |
|
2005 |
1.06 |
0.83 |
0.41 |
0.06 |
2.41 |
0.47 |
1.61 |
3.43 |
1.51 |
1.26 |
0.00 |
0.00 |
13.05 |
|
2006 |
0.00 |
0.00 |
0.02 |
0.12 |
0.38 |
0.62 |
3.13 |
6.57 |
2.22 |
2.71 |
0.17 |
0.53 |
16.47 |
|
2007 |
0.22 |
0.14 |
1.05 |
0.16 |
3.06 |
1.41 |
0.89 |
0.32 |
2.50 |
0.56 |
0.38 |
0.45 |
11.14 |
|
Average |
0.47 |
0.43 |
0.41 |
0.74 |
0.94 |
0.82 |
2.38 |
2.49 |
1.56 |
1.39 |
0.30 |
0.53 |
12.83 |
Table 6. Total Monthly Precipitation (mm) Recorded at Various Rain Gauges, 1994–2007.
| Site Q | |||||||||||||
|
Year |
Jan |
Feb |
Mar |
Apr |
May |
Jun |
Jul |
Aug |
Sep |
Oct |
Nov |
Dec |
Annual Total |
|
1994 |
0 |
0 |
24 |
25 |
83 |
29 |
71 |
60 |
30 |
23 |
25 |
19 |
389 |
|
1995 |
7 |
0 |
32 |
0 |
17 |
21 |
58 |
81 |
56 |
0 |
0 |
3 |
275 |
|
1996 |
0 |
21 |
0 |
0 |
0 |
50 |
122 |
127 |
77 |
55 |
4 |
0 |
456 |
|
1997 |
21 |
16 |
12 |
24 |
35 |
142 |
56 |
126 |
98 |
18 |
18 |
63 |
628 |
|
1998 |
0 |
5 |
41 |
18 |
3 |
0 |
65 |
88 |
15 |
86 |
34 |
12 |
366 |
|
1999 |
12 |
0 |
31 |
17 |
51 |
60 |
72 |
107 |
17 |
8 |
0 |
14 |
391 |
|
2000 |
0 |
0 |
30 |
16 |
0 |
33 |
28 |
27 |
5 |
72 |
43 |
28 |
282 |
|
2001 |
41 |
19 |
31 |
7 |
36 |
22 |
128 |
47 |
102 |
8 |
39 |
5 |
483 |
|
2002 |
15 |
0 |
10 |
1 |
0 |
5 |
111 |
50 |
91 |
34 |
15 |
59 |
391 |
|
2003 |
0 |
8 |
0 |
24 |
5 |
9 |
24 |
90 |
9 |
31 |
35 |
8 |
243 |
|
2004 |
33 |
50 |
15 |
157 |
3 |
39 |
61 |
89 |
31 |
75 |
52 |
14 |
619 |
|
2005 |
28 |
22 |
23 |
4 |
92 |
29 |
10 |
66 |
39 |
35 |
0 |
0 |
348 |
|
2006 |
0 |
0 |
3 |
1 |
13 |
20 |
75 |
155 |
33 |
36 |
7 |
18 |
360 |
|
2007 |
19 |
12 |
34 |
8 |
101 |
40 |
31 |
31 |
73 |
9 |
0 |
23 |
380 |
|
Average |
13 |
11 |
20 |
21 |
31 |
36 |
65 |
82 |
48 |
35 |
19 |
19 |
401 |
| Site NC | |||||||||||||
|
Year |
Jan |
Feb |
Mar |
Apr |
May |
Jun |
Jul |
Aug |
Sep |
Oct |
Nov |
Dec |
Annual Total |
|
1994 |
0 |
0 |
0 |
0 |
0 |
0 |
31 |
80 |
35 |
22 |
15 |
15 |
198 |
|
1995 |
6 |
0 |
20 |
0 |
15 |
20 |
69 |
71 |
51 |
0 |
0 |
4 |
256 |
|
1996 |
0 |
12 |
1 |
0 |
0 |
60 |
125 |
144 |
60 |
58 |
3 |
0 |
462 |
|
1997 |
26 |
17 |
9 |
34 |
33 |
108 |
47 |
100 |
112 |
26 |
0 |
29 |
541 |
|
1998 |
0 |
8 |
33 |
13 |
1 |
1 |
87 |
88 |
36 |
57 |
31 |
12 |
366 |
|
1999 |
9 |
0 |
24 |
9 |
43 |
36 |
87 |
64 |
48 |
5 |
0 |
10 |
335 |
|
2000 |
1 |
0 |
23 |
12 |
0 |
30 |
52 |
22 |
6 |
103 |
32 |
16 |
298 |
|
2001 |
39 |
17 |
17 |
5 |
45 |
23 |
76 |
62 |
35 |
7 |
70 |
3 |
399 |
|
2002 |
15 |
0 |
18 |
4 |
0 |
9 |
79 |
33 |
106 |
34 |
11 |
53 |
362 |
|
2003 |
0 |
7 |
12 |
8 |
0 |
12 |
29 |
55 |
7 |
46 |
15 |
4 |
195 |
|
2004 |
36 |
56 |
13 |
119 |
1 |
39 |
34 |
80 |
29 |
60 |
14 |
2 |
483 |
|
2005 |
26 |
20 |
15 |
2 |
102 |
34 |
24 |
75 |
34 |
32 |
0 |
0 |
364 |
|
2006 |
0 |
0 |
1 |
6 |
10 |
22 |
85 |
197 |
49 |
67 |
5 |
15 |
457 |
|
2007 |
42 |
7 |
31 |
11 |
87 |
49 |
64 |
11 |
75 |
15 |
10 |
13 |
418 |
|
Average |
14 |
10 |
15 |
16 |
24 |
32 |
64 |
77 |
49 |
38 |
15 |
13 |
367 |
| Site C | |||||||||||||
|
Year |
Jan |
Feb |
Mar |
Apr |
May |
Jun |
Jul |
Aug |
Sep |
Oct |
Nov |
Dec |
Annual Total |
|
1999 |
0 |
0 |
0 |
0 |
0 |
0 |
73 |
59 |
42 |
11 |
0 |
0 |
185 |
|
2000 |
0 |
0 |
0 |
4 |
0 |
13 |
27 |
9 |
5 |
74 |
0 |
0 |
131 |
|
2001 |
0 |
0 |
0 |
4 |
45 |
23 |
43 |
50 |
39 |
8 |
0 |
0 |
212 |
|
2002 |
0 |
0 |
0 |
4 |
0 |
21 |
85 |
41 |
74 |
35 |
9 |
50 |
318 |
|
2003 |
0 |
4 |
4 |
9 |
0 |
17 |
16 |
56 |
4 |
27 |
15 |
4 |
155 |
|
2004 |
36 |
36 |
10 |
115 |
0 |
51 |
66 |
116 |
29 |
58 |
16 |
2 |
536 |
|
2005 |
27 |
28 |
22 |
2 |
48 |
24 |
34 |
84 |
53 |
27 |
0 |
0 |
350 |
|
2006 |
0 |
0 |
1 |
4 |
9 |
24 |
90 |
178 |
52 |
70 |
6 |
16 |
450 |
|
2007 |
22 |
5 |
33 |
9 |
66 |
30 |
51 |
7 |
58 |
13 |
11 |
13 |
320 |
|
Average |
9 |
8 |
8 |
17 |
19 |
23 |
54 |
67 |
40 |
36 |
6 |
9 |
295 |
| Site Corrals/K | |||||||||||||
|
Year |
Jan |
Feb |
Mar |
Apr |
May |
Jun |
Jul |
Aug |
Sep |
Oct |
Nov |
Dec |
Annual Total |
|
1994 |
0 |
0 |
0 |
0 |
0 |
0 |
29 |
51 |
68 |
23 |
18 |
18 |
207 |
|
1995 |
7 |
0 |
15 |
0 |
14 |
32 |
51 |
71 |
47 |
0 |
0 |
5 |
241 |
|
1996 |
0 |
17 |
1 |
0 |
0 |
79 |
116 |
101 |
50 |
23 |
0 |
0 |
386 |
|
1997 |
18 |
17 |
9 |
65 |
36 |
90 |
42 |
89 |
51 |
18 |
4 |
25 |
463 |
|
1998 |
0 |
7 |
27 |
12 |
0 |
1 |
87 |
137 |
9 |
86 |
38 |
14 |
417 |
|
1999 |
8 |
0 |
24 |
12 |
46 |
41 |
96 |
55 |
52 |
7 |
0 |
0 |
343 |
|
2000 |
0 |
0 |
0 |
5 |
0 |
6 |
70 |
26 |
4 |
74 |
0 |
0 |
186 |
|
2001 |
0 |
0 |
0 |
3 |
49 |
25 |
39 |
50 |
61 |
9 |
0 |
0 |
236 |
|
2002 |
0 |
0 |
0 |
4 |
0 |
17 |
79 |
50 |
109 |
35 |
7 |
50 |
351 |
|
2003 |
0 |
3 |
5 |
9 |
0 |
23 |
21 |
49 |
7 |
26 |
16 |
3 |
161 |
|
2004 |
19 |
29 |
5 |
119 |
0 |
36 |
58 |
85 |
33 |
51 |
18 |
2 |
452 |
|
2005 |
29 |
29 |
19 |
2 |
43 |
9 |
39 |
93 |
90 |
34 |
0 |
0 |
387 |
|
2006 |
0 |
0 |
1 |
4 |
9 |
14 |
93 |
205 |
63 |
74 |
6 |
14 |
483 |
|
2007 |
13 |
6 |
36 |
7 |
65 |
29 |
27 |
6 |
49 |
15 |
10 |
12 |
274 |
|
Average |
7 |
8 |
10 |
17 |
19 |
29 |
61 |
76 |
49 |
34 |
8 |
10 |
328 |
| Site J | |||||||||||||
|
Year |
Jan |
Feb |
Mar |
Apr |
May |
Jun |
Jul |
Aug |
Sep |
Oct |
Nov |
Dec |
Annual Total |
|
1999 |
0 |
0 |
0 |
0 |
0 |
0 |
103 |
61 |
35 |
11 |
0 |
0 |
210 |
|
2000 |
0 |
0 |
0 |
4 |
0 |
7 |
26 |
15 |
7 |
83 |
0 |
0 |
141 |
|
2001 |
0 |
0 |
0 |
6 |
35 |
11 |
59 |
77 |
60 |
8 |
0 |
0 |
256 |
|
2002 |
0 |
0 |
0 |
3 |
0 |
11 |
101 |
52 |
86 |
38 |
5 |
47 |
343 |
|
2003 |
0 |
4 |
0 |
7 |
0 |
46 |
24 |
31 |
7 |
27 |
16 |
2 |
165 |
|
2004 |
6 |
26 |
7 |
155 |
0 |
39 |
54 |
66 |
40 |
59 |
21 |
2 |
476 |
|
2005 |
29 |
30 |
25 |
8 |
39 |
7 |
23 |
102 |
84 |
40 |
0 |
0 |
387 |
|
2006 |
0 |
0 |
2 |
5 |
11 |
19 |
115 |
174 |
90 |
77 |
4 |
14 |
512 |
|
2007 |
4 |
5 |
32 |
7 |
99 |
23 |
7 |
0 |
65 |
15 |
11 |
11 |
278 |
|
Average |
4 |
7 |
7 |
22 |
20 |
18 |
57 |
64 |
53 |
40 |
6 |
8 |
308 |
| Site Johnson | |||||||||||||
|
Year |
Jan |
Feb |
Mar |
Apr |
May |
Jun |
Jul |
Aug |
Sep |
Oct |
Nov |
Dec |
Annual Total |
|
1994 |
0 |
0 |
0 |
0 |
0 |
0 |
30 |
67 |
25 |
18 |
14 |
6 |
160 |
|
1995 |
2 |
0 |
19 |
0 |
10 |
35 |
40 |
30 |
24 |
0 |
0 |
8 |
168 |
|
1996 |
0 |
15 |
1 |
0 |
0 |
76 |
81 |
54 |
98 |
10 |
0 |
0 |
335 |
|
1997 |
18 |
10 |
5 |
51 |
12 |
79 |
35 |
130 |
51 |
9 |
0 |
44 |
445 |
|
1998 |
0 |
7 |
44 |
21 |
0 |
1 |
67 |
94 |
17 |
52 |
30 |
13 |
346 |
|
1999 |
3 |
0 |
20 |
43 |
34 |
74 |
58 |
27 |
34 |
7 |
0 |
0 |
300 |
|
2000 |
0 |
0 |
0 |
4 |
0 |
7 |
57 |
14 |
4 |
74 |
0 |
0 |
160 |
|
2001 |
0 |
0 |
0 |
9 |
27 |
22 |
39 |
56 |
25 |
9 |
0 |
0 |
188 |
|
2002 |
0 |
0 |
0 |
1 |
0 |
11 |
86 |
56 |
74 |
36 |
4 |
43 |
312 |
|
2003 |
0 |
0 |
1 |
9 |
0 |
43 |
7 |
80 |
10 |
26 |
16 |
1 |
193 |
|
2004 |
10 |
23 |
0 |
87 |
0 |
25 |
49 |
69 |
38 |
90 |
12 |
1 |
404 |
|
2005 |
22 |
22 |
13 |
4 |
45 |
5 |
34 |
89 |
97 |
36 |
0 |
0 |
367 |
|
2006 |
0 |
0 |
1 |
5 |
11 |
8 |
103 |
157 |
107 |
67 |
3 |
12 |
476 |
|
2007 |
1 |
6 |
17 |
3 |
61 |
18 |
0 |
0 |
80 |
22 |
0 |
10 |
218 |
|
Average |
4 |
6 |
9 |
17 |
14 |
29 |
49 |
66 |
49 |
32 |
6 |
10 |
291 |
| Site Sheep | |||||||||||||
|
Year |
Jan |
Feb |
Mar |
Apr |
May |
Jun |
Jul |
Aug |
Sep |
Oct |
Nov |
Dec |
Annual Total |
|
1999 |
0 |
0 |
0 |
0 |
0 |
0 |
86 |
55 |
31 |
4 |
0 |
0 |
176 |
|
2000 |
0 |
0 |
0 |
5 |
0 |
21 |
107 |
15 |
5 |
76 |
0 |
0 |
228 |
|
2001 |
0 |
0 |
0 |
6 |
41 |
21 |
59 |
80 |
53 |
7 |
0 |
0 |
268 |
|
2002 |
0 |
0 |
0 |
0 |
0 |
11 |
84 |
38 |
70 |
31 |
10 |
52 |
297 |
|
2003 |
0 |
4 |
8 |
11 |
0 |
8 |
28 |
50 |
10 |
26 |
15 |
2 |
162 |
|
2004 |
27 |
26 |
7 |
120 |
0 |
43 |
37 |
70 |
30 |
58 |
14 |
2 |
435 |
|
2005 |
27 |
21 |
10 |
2 |
61 |
12 |
41 |
87 |
38 |
32 |
0 |
0 |
331 |
|
2006 |
0 |
0 |
1 |
3 |
10 |
16 |
80 |
167 |
56 |
69 |
4 |
13 |
418 |
|
2007 |
6 |
4 |
27 |
4 |
78 |
36 |
23 |
8 |
64 |
14 |
10 |
11 |
283 |
|
Average |
7 |
6 |
6 |
17 |
21 |
19 |
60 |
63 |
40 |
35 |
6 |
9 |
289 |
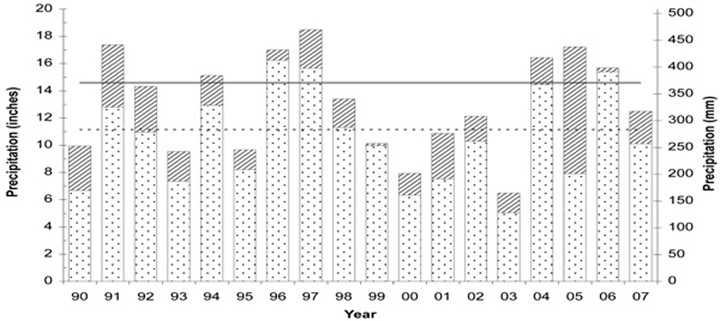
Figure 3. Average annual and growing season (April–October) (bottom bar and dotted line) rainfall recorded at the SH and OW research sites (1990–2007) as compared to 1914–2006 long-term averages.
New Mexico is influenced by the North American monsoon and gets 40 to 50% of annual rainfall during the monsoon season (late June through early October). One-third of the days during quarter 3 had measurable rainfall events as compared to 15 to 18% of days during the other quarters. There are many dry and sunny days on the Corona Ranch. As shown in Figure 4, on 79% of the days in the year (290 days) it typically does not rain or snow. Dry days occurred only 66% of the time during quarter 3.
On the 75 days a year that it does typically rain, it rains less than 0.25 inch (6.4 mm) 64% of the time. These small rainfall events are most common during quarter 1 and quarter 4 (Figure 4). Rain events over the day exceeded 0.50 inch (12.7 mm) about 20% of the time. When it does rain, it rains over 1 inch about 9% of the time. These large storms rarely occur during the winter period (< 5% of days) (Figure 4).
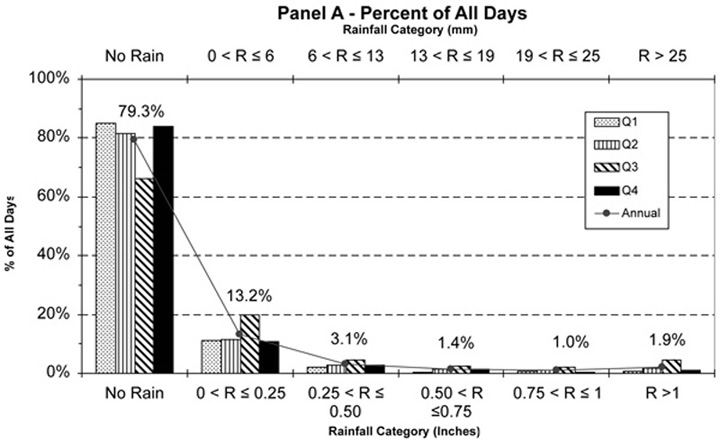
Figure 4a. Rainfall frequency by amount category, Sept. 24, 1989 to July 3, 2007, at SH and OW sites.
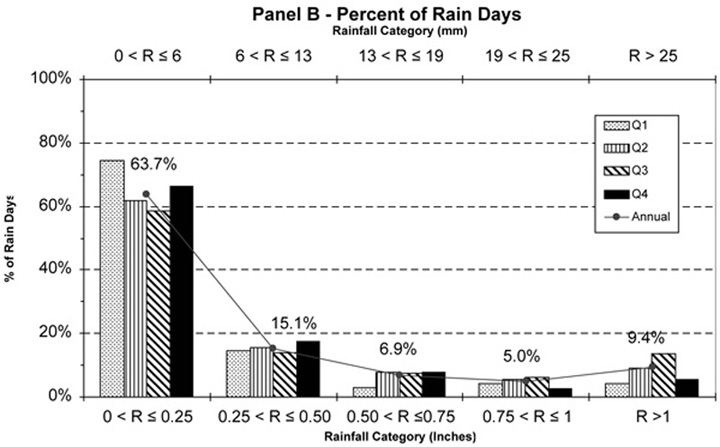
Figure 4b. Rainfall frequency by amount category, Sept. 24, 1989 to July 3, 2007, at SH and OW sites.
Soil Moisture
Soil moisture data are available from the Adams site starting in 1997 and from the OW and SH sites starting in 2001. As noted earlier, data were recorded at two depths at the OW and SH sites (4 inches and from 4 to 12 inches) and at five depths at the Adams site (2, 4, 8, 20, and 40 inches). Soil moisture levels for the Adams site are not detailed in this report but are available at the Corona Ranch web site.
Figures 5 and 6 plot midnight recorded soil moisture at 10 cm (4 inches) at the SH and OW site from 2002 through 2007. Also shown on the graphs are daily rainfall amounts in mm. At the 10 cm (4 inch) depth, the OW data logger consistently recorded about 20% higher than the SH data logger. At the 10–30 cm depth, soil moisture recorded at the SH site was about 6% higher than at the OW site. The Adams site had a consistently lower recording and the range of data was much less. This is likely due to differences in how the probes were calibrated.
The change in daily soil moisture was tied closely to the size of the recorded rainfall event, as would be expected. For those days when valid soil moisture recordings were made, average daily changes in soil moisture increased with the amount of rainfall recorded. It took at least 5 mm (0.2 inches) of rainfall to substantially increase soil moisture levels over the day. When it did not rain on a given day, soil moisture decreased on average by 0.2%. For the dry climate of the Corona Ranch, soil moisture is largely built rainfall events > 5 mm, by which were recorded on about 20 days of the year (Figure 4). The rate of decline in soil moisture was much more rapid during the heat of the summer and when plants were growing. Soil moisture moved from the high levels realized following a large rainfall event to low levels in as little as two weeks from June to September, whereas during the winter months soil moisture without additional rainfall declined at a gradual, slow pace (Figures 5 and 6).
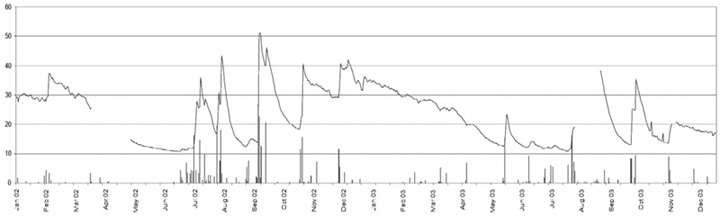
Figure 5a. Soil moisture measured at 10 cm (line) and daily rainfall (bars, in mm), SH site, 2002–2003.
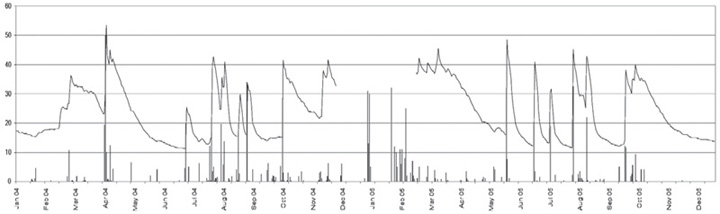
Figure 5b. Soil moisture measured at 10 cm (line) and daily rainfall (bars, in mm), SH site, 2004–2005.
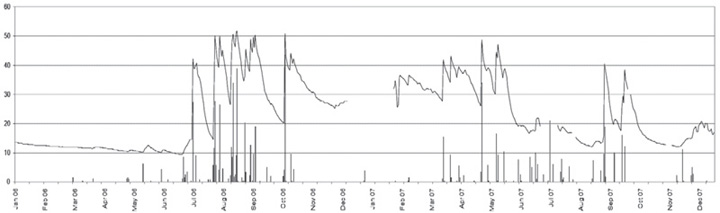
Figure 5c. Soil moisture measured at 10 cm (line) and daily rainfall (bars, in mm), SH site, 2006–2007.
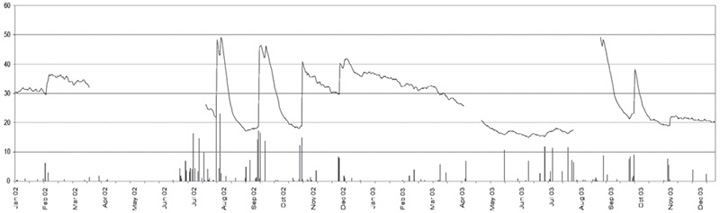
Figure 6a. Soil moisture measured at 10 cm (line) and daily rainfall (bars, in mm), OW site, 2002–2003.
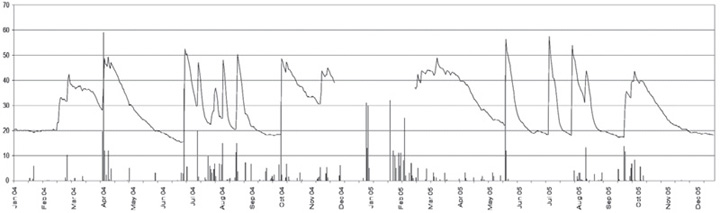
Figure 6b. Soil moisture measured at 10 cm (line) and daily rainfall (bars, in mm), OW site, 2004–2005.
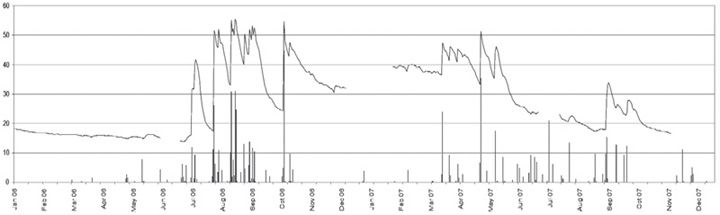
Figure 6c. Soil moisture measured at 10 cm (line) and daily rainfall (bars, in mm), OW site, 2006–2007.
Both soil moisture probe depths placed at the OW and SH sites recorded a similar pattern, but the deeper probe (data not shown) remained at a slightly higher level. Over the 2001–2006 period during quarters 1 and 4, the 10–30 cm probe recorded soil moisture levels that averaged 3.5% more than the 10 cm probe. The difference increased to 7.6% during quarter 2 and 5.6%
during quarter 3.
Air Temperature
Average daily maximum air temperature at the OW and SH study sites was 50°F during December–January and 84°F in July. Average daily minimum air temperature was 25°F during December–January and 57°F in July. The average frost-free period (consecutive days above 32°F) was about 164 days, from April 30 to October 11. The interval between killing frosts (28°F or less) averaged 186 days (Table 7). Average minimum daily temperatures were above freezing from April 1 to October 31 (Figure 7). Perhaps more important for range forage production, an approximate 50°F is considered a minimum temperature for growth of blue grama grass (Stubbendieck & Burzlaff, 1970), the predominant forage species found on the Corona Ranch. As shown in Figure 7, average daily daytime air temperatures begin to exceed 50°F near the first of April and remain above this threshold until late October. This suggests a maximum April through October growing season for warm-season grass growth, similar to the frost-free period (214 days).
Table 7. Frost dates and number of consecutive frost-free days at NMSU's Corona Ranch (1991–2007).
| Year | Less than or equal to 32° F | Less than or equal to 28° F | ||||
| Last Spring Frost (date) |
First Fall Frost (date) |
Frost-Free Period (days) |
Last Spring Killing Frost (date) |
First Fall Killing Frost (date) |
Killing Frost-free period (days) |
|
| 1991 | May 5 | Oct 28 | 176 | May 1 | Oct 29 | 181 |
| 1992 | Apr 21 | Oct 8 | 170 | Apr 4* | Oct 9 | 188 |
| 1993 | May 11 | Oct 21 | 163 | Apr 21 | Oct 29 | 191 |
|
1994 |
Apr 30 | Oct 8 | 161 | Apr 6 | Nov 10 | 218 |
|
1995 |
Apr 27 | Sep 22* | 148 | Apr 27 | Oct 6 | 162 |
|
1996 |
Apr 30 | Oct 19 | 172 | Apr 30 | Oct 19 | 172 |
|
1997 |
May 3 | Oct 13 | 163 | Apr 14 | Oct 13 | 182 |
|
1998 |
Apr 28 | Oct 7 | 162 | Apr 21 | Oct 18 | 180 |
|
1999 |
May 6 | Sep 29 | 146 | Apr 17 | Sep 29 | 165 |
|
2000 |
May 14 | Sep 26 | 135 | Apr 9 | Sep 26* | 170 |
|
2001 |
Apr 24 | Oct 6 | 165 | Apr 24 | Oct 16 | 175 |
|
2002 |
Apr 27 | Oct 13 | 169 | Apr 3* | Oct 20 | 200 |
|
2003 |
May 11 | Oct 25 | 167 | May 11** | Oct 25 | 167 |
|
2004 |
May 15** | Oct 15 | 153 | Apr 13 | Nov 2 | 203 |
|
2005 |
Apr 13* | Oct 31** | 201 | Apr 11 | Nov 13** | 216 |
|
2006 |
Apr 25 | Oct 19 | 177 | Apr 8 | Nov 1 | 207 |
|
2007 |
May 7 | Oct 8 | 154 | Apr 16 | Oct 21 | 188 |
| Average | Apr 30 | Oct 11 | 164 | Apr 16 | Oct 19 | 186 |
| * Earliest date ** Latest date Italicized number is shortest or longest frost free period |
||||||
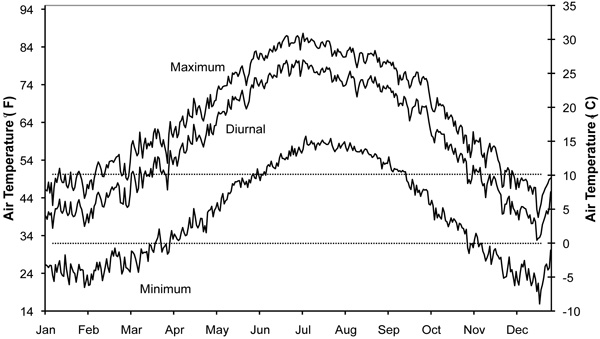
Figure 7. Daily average minimum and maximum air temperature and average diurnal air temperature recorded at the OW and SH study sites (July 17, 1990–July 3, 2007).
Table 8 summarizes the number of accumulated degree days over the growing season for the SH and OW sites. This variable was computed by taking the average daily daytime temperature (6 a.m. to 6 p.m.), subtracting 10°C from it and summing this difference for a defined maximum 214-day growing season (April–October). The average number of degree days over the study period, averaged across both sites, was 2,308 with a standard deviation of 152. The years 2000, 2001, and 2003 had degree day values that were 1 standard deviation or more above the average (Table 8), with rainfall totals that were below average (Table 2). The years 1991, 1993, 1997, and 1999 were exceptionally cool years with relatively low calculated degree days.
Table 8. Degree Days Over the Growing Season at the OW and SH Sites, 1990–2007.
| Year | OW | SH | Average | |||||||||||||||
|
Apr |
May |
Jun |
Jul |
Aug |
Sep |
Oct |
OW Total |
Apr |
May |
Jun |
Jul |
Aug |
Sep |
Oct |
SH Total |
|||
|
1990 |
137 |
314 |
445 |
445 |
385 |
313 |
188 |
2,226 |
137 |
314 |
445 |
445 |
385 |
313 |
188 |
2,226 |
2,226 |
|
|
1991 |
163 |
344 |
398 |
371 |
371 |
238 |
164 |
2,049 |
160 |
344 |
397 |
371 |
395 |
238 |
164 |
2,069 |
2,059 |
|
|
1992 |
191 |
212 |
398 |
461 |
439 |
363 |
234 |
2,298 |
188 |
204 |
391 |
456 |
438 |
359 |
227 |
2,261 |
2,280 |
|
|
1993 |
163 |
292 |
450 |
505 |
424 |
366 |
136 |
2,336 |
129 |
254 |
417 |
472 |
390 |
331 |
112 |
2,105 |
2,220 |
|
|
1994 |
145 |
280 |
535 |
532 |
479 |
356 |
154 |
2,481 |
111 |
250 |
502 |
498 |
450 |
328 |
129 |
2,267 |
2,374 |
|
|
1995 |
112 |
270 |
415 |
524 |
493 |
322 |
255 |
2,392 |
73 |
231 |
379 |
486 |
449 |
288 |
220 |
2,127 |
2,259 |
|
|
1996 |
176 |
416 |
436 |
442 |
383 |
265 |
118 |
2,237 |
152 |
416 |
436 |
442 |
383 |
265 |
118 |
2,212 |
2,225 |
|
|
1997 |
0 |
246 |
391 |
468 |
425 |
347 |
147 |
2,023 |
-4 |
236 |
378 |
449 |
414 |
339 |
137 |
1,949 |
1,986 |
|
|
1998 |
62 |
359 |
476 |
472 |
428 |
391 |
151 |
2,339 |
76 |
371 |
484 |
473 |
436 |
402 |
156 |
2,398 |
2,368 |
|
|
1999 |
84 |
255 |
405 |
446 |
444 |
305 |
199 |
2,137 |
96 |
264 |
411 |
452 |
450 |
314 |
205 |
2,191 |
2,164 |
|
|
2000 |
182 |
428 |
452 |
490 |
416 |
415 |
90 |
2,473 |
192 |
439 |
453 |
490 |
416 |
418 |
96 |
2,503 |
2,488 |
|
|
2001 |
186 |
317 |
484 |
528 |
428 |
374 |
224 |
2,540 |
191 |
325 |
490 |
531 |
425 |
377 |
204 |
2,543 |
2,542 |
|
|
2002 |
223 |
327 |
495 |
452 |
469 |
305 |
98 |
2,370 |
223 |
327 |
495 |
448 |
466 |
302 |
92 |
2,352 |
2,361 |
|
|
2003 |
166 |
342 |
398 |
559 |
451 |
338 |
223 |
2,476 |
176 |
363 |
414 |
591 |
456 |
353 |
237 |
2,590 |
2,533 |
|
|
2004 |
91 |
371 |
458 |
471 |
399 |
333 |
139 |
2,262 |
88 |
367 |
451 |
474 |
386 |
318 |
128 |
2,213 |
2,238 |
|
|
2005 |
156 |
302 |
486 |
541 |
415 |
401 |
151 |
2,453 |
145 |
294 |
474 |
529 |
408 |
388 |
142 |
2,380 |
2,416 |
|
|
2006 |
137 |
372 |
510 |
517 |
397 |
260 |
149 |
2,342 |
230 |
411 |
507 |
505 |
385 |
252 |
144 |
2,433 |
2,387 |
|
|
2007 |
118 |
256 |
441 |
462 |
538 |
394 |
250 |
2,458 |
113 |
242 |
427 |
454 |
520 |
375 |
227 |
2,359 |
2,409 |
|
|
Average |
139 |
317 |
448 |
482 |
433 |
338 |
170 |
2,327 |
138 |
314 |
442 |
476 |
425 |
331 |
162 |
2,288 |
2,308 |
|
|
S.D. |
54 |
59 |
43 |
46 |
42 |
50 |
50 |
150 |
59 |
71 |
43 |
47 |
37 |
51 |
48 |
172 |
152 |
|
| See text for a description of degree days calculation. | ||||||||||||||||||
Soil Temperature
The daily average soil temperature recorded at 10 cm (4 inches) and 50 cm (20 inches) at the SH and OW sites is shown in Figure 8. Soil temperatures fluctuated annually and daily with variation in air temperature and solar radiation. At 50 cm (20 inches) the daily range in soil temperature was only about 1°C, as compared to 9°C for the 10-cm (4-inch) probe.
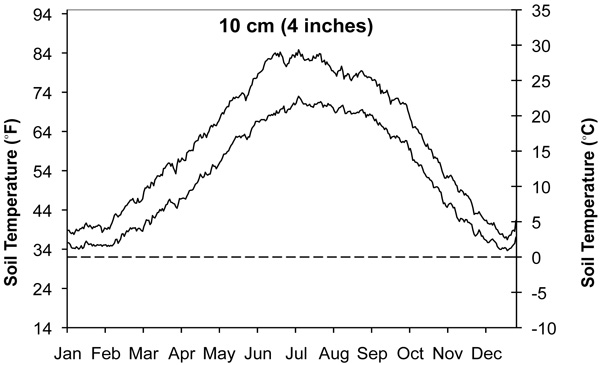
Figure 8a. Daily average minimum and maximum soil temperature (10 cm and 50 cm) measured at the SH and OW sites (July 17, 1990–July 3, 2007).
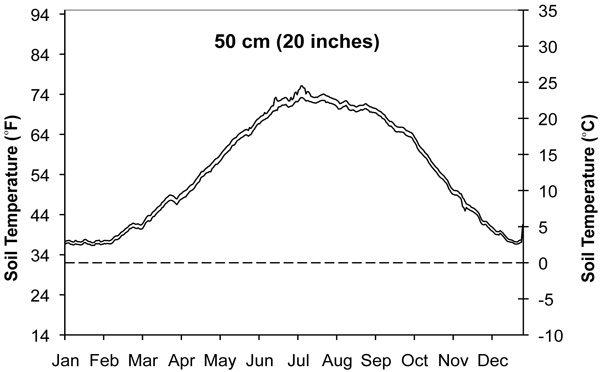
Relative Humidity
Relative humidity varies widely on the Corona Ranch, ranging from nearly 100% on wet, rainy days to a dry 10% a sunny June day (Figure 9). Daily average on relative humidity was frequently in a narrow range from 12% to 25%. Average relative humidity was 25% with monthly averages ranging from 19% during June to 30% during January. Average relative humidity varied from about 30% in the early morning and evening hours to less than 20% by mid-day.
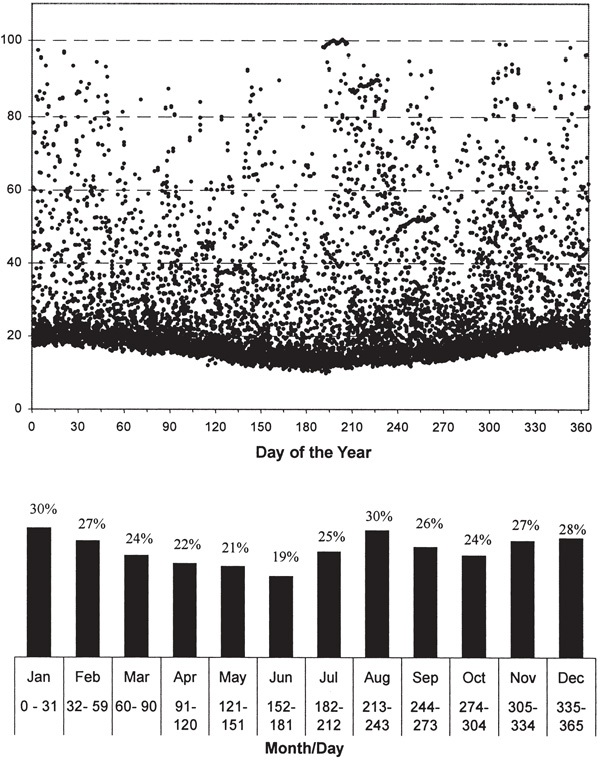
Figure 9. Daily average relative humidity (July 17, 1990–Sept. 3, 2007).
Wind Speed and Direction
Figure 10 shows the frequency of different hourly maximum and average daily wind speeds at the SH and OW sites, and the average wind direction (in degrees) over the day. As shown, wind has a southerly component 90% of the time, and it blows nearly every day.
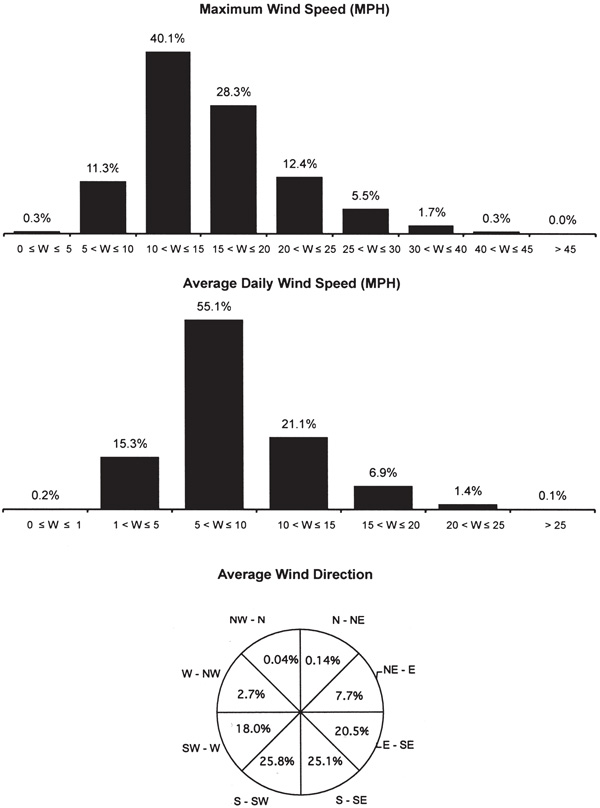
Figure 10. Percentage of hours with different maximum and average wind speeds, and the hourly average wind direction (July 17, 1990–July 3, 2007).
Updated Data Access
The interested reader is referred to the Corona Range and Livestock Research Center web site (http://aces.nmsu.edu/aes/corona) for links to updated weather data for the ranch. These data are stored in two Access databases and numerous spreadsheets. One database is maintained for weather data collected by the South House (SH) and Oil Well (OW) data loggers and recorders. The second database is for the Natural Resources Conservation Service (NRCS) Soil Climate Analysis Network (SCAN) site (Adams site) (NRCS, 2007).
From the web page link, updated tables and figures presented in this report will be available in spreadsheet form. The spreadsheets are linked to the Access database files, and you may be asked whether you would like to enable or disable automatic refresh as you open the file. You should disable the refresh because the data was
refreshed before it was saved to the server.
References
Campbell Scientific Inc. 1996. CS615 water content reflectometer instruction manual. Campbell Scientific Inc., Logan, UT.
Natural Resource Conservation Service (NRCS). 2007. SCAN Site Information for Adams Ranch in New Mexico.
New Mexico Climate Center (NMCC). 2007. New Mexico Climate Center Retrieval Page. Available at http://weather.nmsu.edu. Accessed Sept. 28, 2007.
New Mexico State University, Corona Livestock Research Center (NMSU-CRLRC). 2007. Corona Range Livestock Research Center web site. Available at http://aces.nmsu.edu/aes/corona/. Accessed Sept. 29, 2007.
Stevens Water Monitoring Systems. 2007. Hydra Probe II.
Stubbendieck, J. and D. F. Burzlaff. 1970. Effects of temperature and day length on axillary bud and tiller development in blue grama. Journal of Range Management 23:63-66.
Utah Climate Center (UCC). 2007. GIS Climate Search. Available at http://climate.usurf.usu.edu/products/data.php?tab=coop. Accessed August.16, 2007.
United States Department of Agriculture, Soil Conservation Service (USDA-SCS). 1983. Soil survey of Lincoln County area New Mexico. p. 134.
Western Regional Climate Center (WRCC). 2007. http://www.wrcc.dri.edu. Western Regional Climate Center, Historical Climate Information. Accessed Sept. 28, 2007.
To find more resources for your business, home, or family, visit the College of Agricultural, Consumer and Environmental Sciences on the World Wide Web at aces.nmsu.edu.
Contents of publications may be freely reproduced for educational purposes. All other rights reserved. For permission to use publications for other purposes, contact pubs@nmsu.edu or the authors listed on the publication.
New Mexico State University is an equal opportunity/affirmative action employer and educator. NMSU and the U.S. Department of Agriculture cooperating.
Printed and electronically distributed October 2008, Las Cruces, NM.