BL-801
Brian Hurd, Christopher Goemans, George Frisvold and Janine Stone
College of Agricultural, Consumer and Environmental Sciences, New Mexico State University
Authors: Respectively, Associate Professor, Department of Agricultural Economics and Agricultural Business, New Mexico State University; Assistant Professor, Department of Agricultural and Resource Economics, Colorado State University; Professor and Extension Specialist, Department of Agriculture and Resource Economics, University of Arizona; and Graduate Research Assistant, Department of Agricultural and Resource Economics, Colorado State University. (Print Friendly PDF)
Department of Agricultural Economics and Agricultural Business
Abstract
New Mexico has many unique agricultural characteristics that are important to consider when assessing economic impacts of climate change legislation, such as the American Clean Energy and Security Act of 2009 (ACES, H.R. 2454, also known as the Waxman-Markey Bill). Based on existing data and studies, this assessment considers many of these characteristics in developing preliminary findings on the economic effects of proposed legislation on the state's agricultural economy. Agriculture is varied and diverse in this region, from large-scale orchards of tree nuts to vegetables, cotton, and a variety of row and field crops, and from widespread cattle grazing and ranching to large-scale dairy production. The proposed climate change legislation almost surely entails a relative rise in energy and fertilizer costs. Energy costs are expected to rise by as little as 4% or as much as 13% by 2020, and fertilizer costs by a smaller amount, perhaps ranging between 0.3% and 2% by 2020. Projected increases in fertilizer costs are much less because of the availability of rebates for energy-intensive, trade-exposed (EITE) industries and projected falling natural gas prices. Though the projected increases are modest, such increases will be important for agriculturalists, who must operate on relatively thin profit margins. Furthermore, as farmers throughout the nation adjust to these cost increases, increased demand for bio-energy fuels; increased value of carbon-sequestration; and changes in crop management, land use, and market strategies will likely result in higher commodity prices received by farmers, in many cases largely offsetting projected cost increases. Even in cases where these cost increases are not offset—or if cost increases are perceived by many to be much more certain than revenue increases—the expected rise appears to be well within the range of recent energy-price variability. While new production and revenue opportunities and higher commodity prices will generally benefit farmers, resulting feed prices will adversely affect livestock and dairy producers. In the western states, cattle and dairies are important segments of the agricultural economy. Higher feed and energy costs will pose several threats and challenges. Our preliminary findings suggest that energy, fertilizer, and feed cost increases expected under the proposed legislation could initially shrink the region's agricultural economy until these losses are offset by rising revenues—primarily from higher commodity prices. On balance, based on expected patterns of cost and price changes, we estimate that, compared to baseline levels, state-level net farm income in 2020 rises by about 4.1% for New Mexico. Crop producers will likely experience improved revenues from high crop prices, and if they are able to take advantage of new biofuel crop markets and opportunities to sequester carbon and gain offset revenue they may be able to more than offset their cost increases. Traditional ranching, the dominant practice throughout this region, has few bright prospects, although dairies and other concentrated feeding operations may be able to generate additional income through methane-saving devices, such as digesters, that will provide revenue not only through carbon-offset markets but also through electricity sales.
Introduction
Growing concern about the possible effects of greenhouse gas (GHG) concentrations in the atmosphere on global climate has resulted in federal legislation to limit emissions and develop mechanisms and incentives to encourage long-term storage (e.g., sequestration) of carbon. In 2009, the U.S. House of Representatives passed the American Clean Energy and Security Act of 2009 (ACES, H.R. 2454, also known as the Waxman-Markey Bill). This legislation initiates a so-called "Cap and Trade" (C&T) program under which major industrial emissions of greenhouse gases are regulated such that the quantity of total permitted emissions is limited by the total emissions set by the "cap." Under C&T, major industrial generators of greenhouse gases must either limit emissions to a level consistent with their permits or purchase additional permits. Central to the program, therefore, is an emissions permit/credit market where permit buyers and sellers can trade permits and credits at a free market price. The result is an economically efficient distribution of the burden to limit emissions at the least possible industrial cost to consumers.
Agricultural Greenhouse Gas Sources and Sinks
Agricultural activities and agricultural lands are both a source of greenhouse gases (primarily through methane and nitrous oxide releases) and a sink in which carbon dioxide is captured—i.e., sequestered—from the atmosphere and "fixed" as long-lived organic soil matter, forests, and wood products. As a source, agriculture contributed about 6.1% of U.S. greenhouse gas emissions in 2008. Vegetation and soils have the capacity to capture and store carbon dioxide for relatively long periods of time, much as fossil fuel deposits essentially are stores of hydrocarbons from millions of years ago. Sequestration in forests and agricultural soils is estimated to offset about 12.7% and 0.6% of total emissions, respectively (U.S. EPA, 2010). Agricultural activities and their share of agricultural emissions are shown in Figure 1 and described below.
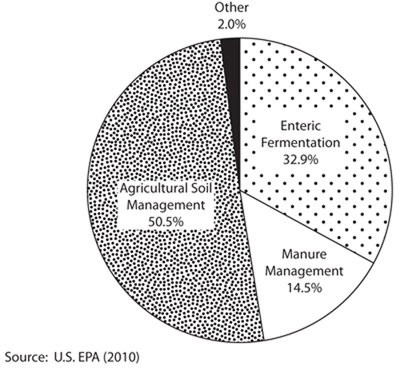
Figure 1. 2008 Greenhouse gas emissions from agriculture.
Agricultural Greenhouse Gas Emissions
Agricultural soil management (50.5%). Nitrous oxides are emitted through processes related to nitrogen fertilizer application, uptake, and use. High-nitrogen using crops like corn have increased nitrous oxide emissions. More efficient and effective nutrient and soil management practices can significantly reduce emissions, lower production costs, and reduce surface and groundwater contamination.
Enteric fermentation in domestic livestock (32.9%). As part of the normal digestive process in which microbes contribute to the fermentation of forage and feed, ruminant livestock, such as beef and dairy cattle, emit significant amounts of methane, primarily via exhaling and belching. Changes in both quantity and quality of feed and forage can influence methane emissions.
Livestock manure management (14.5%). Anaerobic decomposition of manure results in methane production and release, primarily when waste is stored as a liquid or slurry in lagoons, ponds, or pits. In contrast, aerobic handling, for example with field application of wastes, results in much lower levels of methane production and release. Alternatively, manure can be processed through a digester that captures the methane and uses it as fuel to generate electricity.
Agricultural Carbon Sinks
Afforestation and Reforestation of Agricultural Lands (-12.7%). Forests and long-lived forest products are able to capture (through photosynthesis) significant amounts of carbon dioxide, thus reducing atmospheric levels and effectively offsetting emissions from other sources. Nut and fruit orchards, shelterbelts, and forested riparian areas are examples of agricultural afforestation that provide carbon storage and other valuable benefits, such as wildlife refugia and aesthetics, in addition to marketable crops.
Soil Carbon Sequestration (-0.6%). Soils have an important capacity to sequester carbon as organic matter, which if properly managed can be built up and maintained. Frequent or excessive tillage tends to oxidize and release soil carbon, whereas conservation, reduced-till, or no-till practices tend to increase soil carbon, reduce production costs, and limit soil erosion.
Overview of Existing Studies on Agricultural Impacts of Climate Change Legislation
Agriculture is excluded from emissions caps and permit requirements under the currently proposed legislation, but unfortunately not from the rising energy and fertilizer costs that will directly and indirectly raise costs of production, transportation, and distribution. Mitigating these cost increases for many producers will be benefits from the development and sales of greenhouse gas offsets (carbon offsets) and from increasing production and sales of bioenergy crops for which greater demand is anticipated as the value of carbon offsets rises. Among the highest potential opportunities for agriculture to supply carbon offsets are converting crop and pasture land to forests (afforestation), producing bioenergy crops (e.g., corn, canola, sunflower, switchgrass, camelina, etc.), changing tillage practices on cropland to enhance soil carbon accumulation (sequestration), and managing livestock waste (e.g., with methane digesters where livestock are concentrated, such as near dairies and feedlots).
Several recent studies investigate and assess the potential costs and benefits of C&T on the agricultural sector of the United States and certain regions and states. This report focuses on these studies' implications for impacts on agricultural producers in New Mexico. Several assessments of the proposed climate change legislation have examined impacts on various aspects of the agricultural economy. The foundation of this assessment rests on all of the currently available, relevant reports. Figure 2 identifies and highlights the eight available studies.
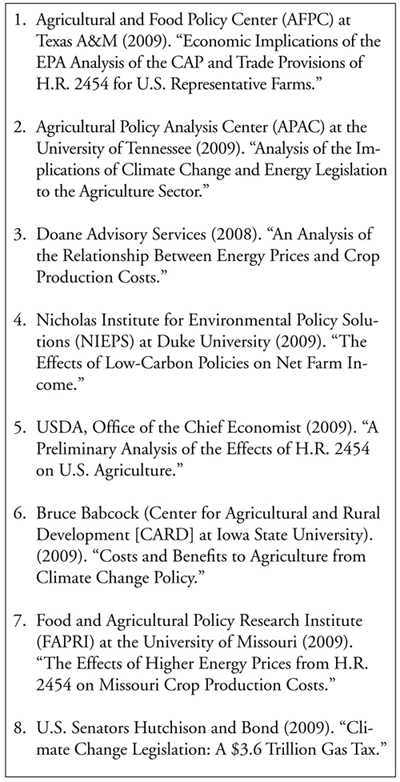
Figure 2. Currently Available Studies Examining the Potential Impacts of Climate Change Legislation on the U.S. Agricultural Economy.
The first five studies in this list represent efforts to model the impacts of H.R. 2454 at the national level. Table 1 presents a summary and comparison of this set of studies along with their scope, findings, and key assumptions (a more detailed overview can be found in Golden et al., 2009). None of the studies in this list was specific to either New Mexico or the Rocky Mountain Region. Most describe national-scale impacts to the agricultural sector. The Babcock (2009) and FAPRI (2009) studies represent the exceptions to this; these were state-level efforts focused on Iowa and Missouri, respectively. The USDA and AFPC studies were the only two that provided any regionalized estimates. Both studies used similar models and methodologies in their development. The USDA estimates form the underlying basis for our assessment of impacts on New Mexican producers and New Mexico's agricultural economy.
Table 1. Comparison of Select Studies on the Costs and Benefits of Climate Change Legislation on the U.S. Agricultural Economy
| Doane Advisory Services (May 2008) |
APAC (Nov. 2009) |
Nicholas Institute of Duke University (Nov. 2009) |
AFPC at Texas A&M (Aug. 2009) |
USDA (Dec. 2009) |
|
|
"An analysis of the relationship |
"Analysis of the Implications of Climate Change and Energy Legislation to the Agricultural Sector" |
"The Effects of Low-Carbon Policies on Net Farm Income" |
"Economic Implications of the EPA Analysis of the CAP and Trade Provisions of HR 2454 for U.S. Representative Farms" |
"The Impacts of the American Clean Energy and Security Act of 2009 on U.S. Agriculture" |
|
| Study Assumptions | |||||
|
Model Type |
Regression-based forecasting model relating farm budgets to energy price forecasts |
POLYSYS Agricultural Policy Simulation Model |
FASOMGHG economic model; simulates forestry and ag. sector response to carbon prices |
FLIPSIM Agricultural Policy Simulation Model |
FAPISM (Food and Agricultural Policy Simulator Model for production expense impacts); FASOM model for offset projections |
|
Measure of Gains/Losses |
Increase in production costs/acre relative to USDA baseline forecast for 2009, extended by Doane through 2020 |
Net crop returns relative to baseline |
Net producer income or "producer surplus" |
Average annual cash costs and ending cash reserves relative to FAPRI 2009 estimated baseline |
Changes in production expenses and net farm income (discounted annuity values) |
|
Adaptability of Model: Variables accounted/not accounted for |
Does not allow for changes in land use, technology, or input, or forecasted commodity prices in response to HR 2454 |
Accounts for impact of ACES and RFS, changes in land use, and production of bioenergy crops; multiple offset scenarios considered |
Simulates impact of changes in CO2 prices on ag. sector; accounts for changes in land use, technology, bioenergy demand, region-specific management decisions, and yield productivity; accounts for impact of RFS requirements |
Evaluates cap and trade with and without carbon offsets; accounts for estimated energy cost inflation in commodity price forecasts; converts eligible farms to no-till and methane digesters |
Farmers may change acreage decisions but not input mix; no changes in technology or production practices in FAPISM modeling; FASOM modeling accounts for changes in management and production practices, land use, and input mix in response to carbon prices/offset opportunities; does not account for EITE rebates |
|
Time Frame |
2010–2020 |
2010–2025 |
2000–2080 |
2010–2016 |
2012–2018 |
| Data Sources | |||||
|
Source of Energy Estimates |
USDA (2008 crude oil) and Energy Information Administration (EIA, natural gas) |
EPA (2009) |
Annual Energy Outlook (AEO, 2009) |
EPA (2009) |
EPA (2009) and EIA (2009) |
|
Source of Estimates for Farm Expenses |
USDA crop enterprise budgets; crop—not region-specific |
NA; model uses national demand, regional supply, and agricultural income modules to find changes in net income |
Average cost/acre of "GHG-intensive" energy use (not region-specific) |
Representative data from 98 representative farms (2 in Colorado) |
USDA production cost data (national level) |
|
Carbon Price Estimates |
N/A |
EPA: $27/Mt CO2 |
Simulations for $15, $ 30, $50/ Mt CO2 |
$11.17 (2010–2017 average) |
$5/ton and $15/ton scenarios, with 5% increase in price/year |
|
Production Cost/Revenue Results for Key Crops in Colorado (No Offsets) |
Production cost increases in $/acre |
Change in net income, in millions of dollars |
Commodity price changes |
Average annual cash costs, no offsets |
Per-acre costs of production |
|
Wheat |
$16.33/acre |
($494) |
3.70% |
1.27% increase small farm; 2.26% large farms |
0.6% , 1.7% |
|
Corn |
$40.33/acre |
$336 |
15.94% |
N/A |
0.4% , 1.5% |
|
Sorghum |
$30.58/acre |
($53) |
0.57% |
N/A |
0.9% , 2.2% |
|
Cattle |
N/A |
0.2% ** (Assuming herd reduction due to pastureland conversion in multiple offset scenario) |
(Fed beef ) 5.21% |
5.99% |
0.1% , 0.3% (increased feed costs) |
|
Notes |
**(in low-cost scenario with crude oil prices increasing 27.2% , natural gas 35.2% ) |
**Scenario with CO2 regulation but no offsets |
P**Results converted to annuity value using 4% discount rate; per acre costs of production increase 1.4, 2.3, and 4.1% across the three carbon price scenarios but are offset by crop price increases above assuming $15/Mt CO2 |
**2012–2018 averages using EPA and EIA energy estimates |
|
| Offsets | |||||
|
Relevant Offset Opportunities for Rocky Mountain Region |
None |
Conservation tillage, afforestation, methane capture, grassland sequestration, bioenergy crops |
Afforestation; crop soil carbon sequestration |
Methane digesters (farms with over 500 head); no-till soil management |
Afforestation, forest management, carbon sequestration in agricultural soils |
|
Net Gains/Losses with Offsets |
N/A |
Net income increases of up to $5 million for ag. in Colorado under multiple offset scenario |
Consumer surplus increase (annualized difference from baseline) of between $2 and $6 million (2004$ ) |
Net gains in ending cash reserves, relative to baseline, by 2016 |
Rocky Mountain Region estimated to receive 6.7% of total national revenues from carbon offsets |
New Mexico Agricultural Overview
Agriculture's industrial importance to New Mexico is significant, providing jobs and economic livelihood totaling more than $1.2 billion in 2008 to the state's gross domestic product (NMBBER, 2010). With a land base composed of 77.6 million acres, New Mexico is the fifth largest state in total area. Nearly half of this area (about 37 million acres) is used for livestock grazing. Crops are harvested on just over 1 million acres, 83% of which are irrigated (U.S. Census, 2010).
Cattle and dairy dominate the agricultural economy of New Mexico, together generating more than 75% of the agricultural income of the state. If livestock feed crops such as hay and corn silage are included, then livestock-related agriculture generates more than 85% of agricultural revenues in the state. In addition to the dairy and cattle industries, New Mexico is an important producer of pecans (second only to Georgia in overall production). New Mexico is also an important producer of both onions and chile. Wheat is important in some areas of the state, as is cotton. Figure 3 shows the share of gross receipts generated by the various commodities.
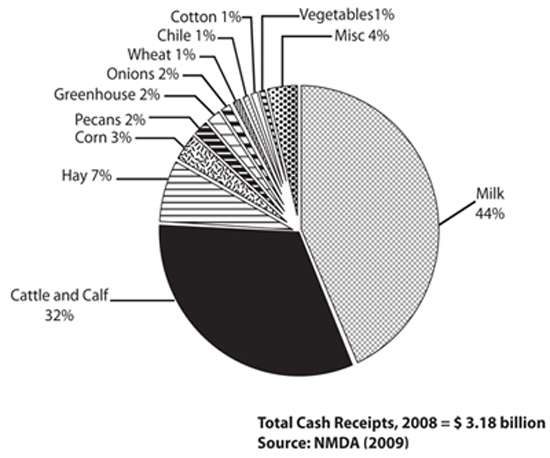
Figure 3. Value of agricultural production in New Mexico by commodity.
The aggregate agricultural income of New Mexico is characterized in Table 2. In particular, the table shows that agricultural revenues total about $3.4 billion and variable production costs total about $2 billion. Of these variable production costs, energy and fertilizer costs account for nearly 10% and 3.5% , respectively, of variable production costs averaged over the entire industry and state.
Table 2. Net Income From Farming in New Mexico (in $1,000s)
| New Mexico, 2008, Agricultural Statistics | Baseline | Totals |
| Value of crop production | $698,451 | |
| Value of livestock production | $2,420,628 | |
| Revenues from services and forestry | $269,555 | |
| Revenues from carbon offset activities | _______ | |
| Value of Ag. Sector Production | $3,388,634 | |
| Purchased inputs | ||
|
Farm origin |
||
|
Feed purchased |
$680,793 | |
|
Livestock and poultry purchased |
$420,818 | |
|
Seed purchased |
$27,114 | |
|
Manufactured |
||
|
Fertilizers |
$69,927 | |
|
Pesticides |
$33,058 | |
|
Petroleum fuel and oils |
$135,396 | |
|
Electricity |
$58,521 | |
|
Other |
$ 590,457 | |
| $2,016,084 | ||
|
Net gov't transactions |
$24,482 | |
| Gross value added | $1,397,032 | |
| Capital consumption | $161,246 | |
| Net Value Added | $1,235,786 | |
| Payments to stakeholders | ||
|
Employment compensation (total hired labor) |
$254,210 | |
| Net rent rec'd by nonoperator landlords | $34,605 | |
| Real estate and non-real estate interest | $117,136 | |
|
Net farm income |
$829,835 |
Estimating the Range of Impacts of Cap and Trade on New Mexico Agriculture
Under C&T, New Mexico farmers, ranchers, and dairy producers will all confront higher energy costs, and farmers will pay more for energy-intensive inputs, such as nitrogen fertilizers that rely heavily on natural gas. USDA estimates of higher energy costs are shown in Table 3, and are representative of the estimated price increases across the available studies.
Table 3. Estimated Energy and Fertilizer Price Increases Above Projected Baseline Prices Resulting from Proposed Cap and Trade Legislation (H.R. 2454)
| Fuel | Natural Gas | Electricity | Fertilizera | |||||
| 2020 | 2050 | 2020 | 2050 | 2020 | 2050 | 2020 | 2050 | |
| EPA (2009) | 4.0% | 14.6% | 8.5% | 30.9% | 12.7% | 35.2% | 0.3% | n/a |
| EIA (2009) | 9.6% | n/a | 12.6% | n/a | 12.2% | n/a | 1.7% | n/a |
|
aOnly short-run estimates are reported in Table 3, covering the period of 2012–2018. |
||||||||
Based on the range of estimated price changes reported in USDA (2009) and shown in Table 3, the following values were selected to represent approximate price increases by 2020 for fuels, electricity, and fertilizer: 8.5% , 12% , and 2% , respectively. Using these and the production costs and cost shares given in Table 2, the increase in agricultural production costs for New Mexico are estimated at $20 million (2008$ ), or approximately 1% in total variable production costs, which results in an estimated loss in net farm income of about 2.4%—not including any changes in livestock feeding costs.
Livestock and dairy producers face substantial animal feeding costs. If corn silage, sorghum, and hay prices rise as a result of acreage diversions and declines from baseline production levels, then feeding costs for dairies and supplemental feeding costs for ranchers can be expected to rise. Table 4 presents estimated changes in commodity prices for corn, sorghum (used as a proxy for hay), fed beef (used also as a proxy for changes in all cattle prices), and milk estimated by USDA (2009) resulting from the proposed C&T legislation. For example, New Mexico ranchers must budget for significant supplemental feed costs, particularly in the event of poor rainfall and vegetation growth on rangelands. In typical cattle and calf operation budgets, the share of variable production costs attributed to feed can range from 20% to 40% (pers. comm., Dr. Jerry Hawkes, New Mexico State University expert on agricultural production budgets, February 20, 2010). In milk production, feeding costs are a very significant share of total variable production costs. Based on values reported through September 2010, dairy feeding costs in New Mexico were 61% of total variable production costs. Therefore, an increase in feeding costs of 10% by 2020 will result in an increase in variable production costs of approximately 0.2% to 0.4% for cattle producers and about 0.6% for dairy producers.
Table 4. Estimated Commodity Price Changes from Projected Baseline Prices Resulting from Proposed Cap and Trade Legislation (H.R. 2454)
| Corn | Sorghum | Fed Beef | Milk | ||||
| 2020 | 2050 | 2020 | 2050 | 2020 | 2050 | 2020 | 2050 |
| 11.5% | 28.1% | -0.5% | 39.8% | 4.3% | 14.3% | 4.8% | 33.1% |
| Source: USDA (2009), Tables 18 and 21, "The Impacts of the American Clean Energy and Security Act of 2009 On U.S. Agriculture." Office of the Chief Economist. | |||||||
Using the 2008 estimate net farm income figures for New Mexico shown in Table 2, and applying the fuels, electricity, fertilizer, and feed cost changes—respectively, 8.5% , 12% , 2% , and 10%—the estimated changes in variable production costs and net farm income are 4.4% and 10.6% , respectively, or approximately a loss of $88 million in net farm income.
Potential for New Mexico Agriculture to Offset Higher Costs with Increased Revenues
How might revenues change in response to the market changes and opportunities presented by the proposed legislation? Studies with a comprehensive assessment of the impacts of the proposed legislation (e.g., USDA, 2009; Texas A&M, 2009; Nicholas, 2009; University of Tennessee, 2009) indicate that the implementation of a carbon offset program would generally result in diversion of existing agricultural lands into production of bioenergy crops and afforestation, resulting in a net decrease in production of current commodity crops and a consequent relative increase in commodity prices, as shown in Table 4.
Assuming that New Mexico producers will benefit from the rise in relative commodity prices, there is measurable potential to offset some or all of the increased production costs. If these commodity price increases are factored in for New Mexico farmers and ranchers, and conservatively assuming no change in the existing shares of crops produced, then gross revenues can be expected to rise, resulting in an increase in net farm income of about $33 million (about 4%) compared to current levels. This assumes that current production levels of both crops and livestock are maintained. In accounting for these price changes, the analysis weights the effect of the price change by the relevant share of cash receipts as reported by NMDA. For example, in 2008, milk sales accounted for 43.7% of total cash receipts in agriculture. Since projected increases in commodity prices are less certain and less immediate than expected increases in energy and energy-intensive input prices, declines in harvested acres and in both dairy and livestock herd sizes can be expected in the short run. Therefore, projections of a net increase in net farm income resulting from longer-run commodity price increases should be considered optimistic.
In addition to the projected increases in commodity prices, there are additional revenue enhancements that could be enjoyed by New Mexico farms and ranches. The proposed legislation provides opportunities for agricultural producers to enhance revenues and net returns by contributing to renewable energy production, bioenergy crops, and greenhouse gas sequestration.
Of these opportunities, the one that appears to have the greatest immediate promise is the installation of methane digesters and the co-production and sale of offsets and electricity on the largest of New Mexico's dairies. Based on economic feasibility assessments on dairies in Pennsylvania, Leuer et al. (2008) indicate that there are likely positive net returns to methane digester installation on dairies with herd sizes in excess of 1,000 head. On these dairies, the net annuitized return is estimated at $4.89 per cow per year (Leuer et al., 2008), with the net present value of a digester for a 1,000-head dairy estimated to be $61,000, and assuming a 5% discount rate and a 20-year facility life.
If digesters are installed on one-third of the dairies, the result generates an additional $546,000 per year and, if added to the revenue increases from commodity price increases, results in a net increase in net farm income of approximately 4.1% . Though the potential is there, initial investment costs are high, and increased feeding costs could further constrain consideration and installation of digesters unless and until carbon prices and electricity prices rise sufficiently. Table 5 summarizes the changes in annual net farm income across each of four scenarios. As shown by the similarities between the results of Scenarios 3 and 4, the potential for carbon offsets to add to net farm income is very small.
Table 5. Estimated Baseline Changes to New Mexico Net Farm Income in 2020 Resulting from Proposed Cap and Trade Legislation (H.R. 2454)
| Scenario 1 | Scenario 2 | Scenario 3 | Scenario 4 | |
| Cost Changes: | Cost Changes: | Cost Changes: | Cost Changes: | |
| Energy | Energy | Energy | Energy | |
| Fertilizer | Fertilizer | Fertilizer | Fertilizer | |
| Livestock Feed | Livestock Feed | Livestock Feed | ||
| Revenue Changes: | Revenue Changes: | Revenue Changes: | Revenue Changes: | |
| Crop Price | Crop Price | |||
| GHG Offsets (Manure Mgt) | ||||
| Change in Net Farm Income (2008$ ) | −$20.0 million | −$88.1 million | + $33.7 million | + $34.3 million |
| % Chg | −2.4% | −10.6% | + 4.1% | + 4.1% |
|
Notes: |
||||
Opportunities for other sectors are somewhat limited by the production environment and currently available mitigation opportunities. For example, cattle and calf producers in New Mexico are primarily grazing pasture and rangelands and, therefore, have little or no capacity to either change feedstocks or manage manure in order to reduce methane emissions. Without offsetting increases in beef prices, New Mexico cattle producers will be hard hit by increased costs. There is, however, some potential for New Mexico farms to grow bioenergy crops—research on feedstock crops such as camelina is ongoing, and there may be opportunities from advances in cellulosic ethanol.
These opportunities are at present difficult to quantify and are likely to contribute little change in net farm income—being close substitutes to existing crops. Another potential but somewhat of a long shot is the possibility that planting agricultural forests—afforestation—of pecans (maybe even citrus someday if climate changes enough) could someday be counted in the carbon offset markets. Currently, it seems that there is little about this on the CCX carbon market—though personal communication with Brian Murray (an economist at Duke University who is an expert on land use and land use changes under climate change) indicates that this is conceptually possible. There maybe a little potential to use orchard prunings as bioenergy sources—some feasibility studies have been done, but there seems to be not enough source material to develop the energy-producing infrastructure.
There may be some potential to adopt soil-carbon conserving practices on field crops, yielding some GHG offset income. Limited tillage is already widely practiced, especially in response to higher fuel costs. In addition, New Mexico farmers are highly dependent on irrigation, much of which is pumped and, therefore, associated with very significant energy costs. It would be difficult to imagine that offset income from tillage practice changes would offset the increased energy costs of pumped groundwater.
The proposed climate change legislation almost surely entails a relative rise in energy and fertilizer costs, estimated between 4% and 13% for energy and between 0.3% and 2% for fertilizer by 2020. Though the projected increases are modest, such increases will be important for agriculturalists, who must operate on relatively thin profit margins. However, changes such as increased demand for bio-energy fuels will likely result in higher commodity prices received by farmers, which would offset some of the projected cost increases. Even in cases where these cost increases are not offset—or if cost increases are perceived by many to be much more certain than revenue increases—the expected rise appears to be well within the range of recent energy-price variability. While new production and revenue opportunities and higher commodity prices will generally benefit farmers, resulting feed prices will adversely affect livestock and dairy producers. In the western states, cattle and dairies are important segments of the agricultural economy. Higher feed and energy costs will pose several threats and challenges. Our preliminary findings suggest that energy, fertilizer, and feed cost increases expected under the proposed legislation could initially shrink the region's agricultural economy until these losses are offset by rising revenues—primarily from higher commodity prices. Traditional ranching, the dominant practice throughout this region, has few bright prospects, although dairies and other concentrated feeding operations may be able to generate additional income through methane-saving devices, such as digesters, that will provide revenue not only through carbon-offset markets but also through electricity sales.
References
Agricultural and Food Policy Center (AFPC). 2009. Economic implications of the EPA analysis of the CAP and trade provisions of H.R. 2454 for U.S. representative farms (AFPC Research Paper 09-2). Retrieved Feb. 23, 2010, from http://www.afpc.tamu.edu/pubs/2/526/rr%2009-2%20paper%20-%20for%20web.pdf.
Agricultural Policy Analysis Center (APAC). 2009. Analysis of the implications of climate change and energy legislation to the agriculture sector. Retrieved Feb. 12, 2010, from http://www.25x25.org/storage/25x25/documents/ut_climate_energy_report_25x25_november11.pdf.
Babcock, B.A. 2009. Costs and benefits to agriculture from climate change policy. Iowa Ag Review, 15, 3. Retrieved Feb. 23, 2010, from http://www.card.iastate.edu/iowa_ag_review/summer_09/article1.aspx.
Charles River Associates (CRA). 2009. The American Clean Energy and Security Act of 2009. (H.R. 2454). Retrieved Feb. 16, 2010.
FAPRI. 2009. The effects of higher energy prices from H.R. 2454 on Missouri crop production costs (FAPRIMU Report #05-09). Columbia: University of Missouri Food and Agricultural Policy Institute. Retrieved March 3, 2010.
Golden, B., J. Bergtold, M. Boland, K. Dhuyvetter, T. Kastens, J. Peterson, and S. Staggenborg. 2009. A comparison of select cost-benefit studies on the impacts of H. R. 2454 on the agriculture sector of the economy. Retrieved Feb. 25, 2011.
Leuer, E.R., J. Hyde, and T.L. Richard. 2008. Investing in methane digesters on Pennsylvania dairy farms: Implication of scale economies and environmental programs. Agricultural and Resource Economics Review, 37, 2, 188-203.
Lewandrowski, J., C. Jones, and R. House. 2004. Economics of sequestering carbon in the U.S. agricultural sector (Technical Bulletin No. 1909). Resource Economics Division, Economic Research Service, U.S. Department of Agriculture, Washington, D.C. Retrieved Feb. 16, 2010.
Nicholas Institute for Environmental Policy Solutions (NIEPS). 2009.The effects of low-carbon policies on net farm income (Working Paper NI WP 09-04). Retrieved Feb. 23, 2010.
NMDA. 2009. New Mexico 2008 agricultural statistics. Las Cruces: New Mexico Department of Agriculture.
NM BBER. 2010. New Mexico gross domestic product. Albuquerque: New Mexico Bureau of Business and Economic Research, University of New Mexico. Retrieved Feb. 18, 2010.
U.S. Census. 2010. United States 2007 census of agriculture. Retrieved Feb. 18, 2010.
Office of the Chief Economist, USDA. 2009. "A preliminary analysis of the effects of H.R. 2454 on U.S. agriculture. Washington, D.C.: United States Department of Agriculture. Retrieved Feb. 23, 2010.
U.S. Environmental Protection Agency. 2002. Market opportunities for biogas recovery systems: A guide to identifying candidates for on-farm and centralized systems (EPA-430-8-06-004). Washington, D.C.: U.S. EPA. Retrieved Feb. 2, 2010, from http://www.epa.gov/agstar/documents/biogas_recovery_systems_screenres.pdf.
U.S. Environmental Protection Agency. 2005. Greenhouse gas mitigation potential in U.S. forestry and agriculture (EPA 430-R-05-006). Washington, D.C.: U.S. EPA. Retrieved Jan. 28, 2010
U.S. Environmental Protection Agency. 2009a. The United States Environmental Protection Agency's analysis of H.R. 2454 in the 111th Congress, the American Clean Energy and Security Act of 2009. Washington, D.C.: U.S. EPA. Retrieved Feb. 2, 2010, from http://www.epa.gov/climatechange/economics/economicanalyses.html#hr2452.
U.S. Environmental Protection Agency. 2009b. Anaerobic digestion capital costs for dairy farms (AgStar Program, February 2009). Washington, D.C.: U.S. EPA. Retrieved March 13, 2010, from http://www.epa.gov/agstar/documents/digester_cost_fs.pdf.
U.S. Environmental Protection Agency. 2009c. Anaerobic digesters, sorted by operational status and by state. Washington, D.C.: U.S. EPA. Retrieved March 13, 2010, from http://www.epa.gov/agstar/operational.html.
U.S. Environmental Protection Agency. 2010. Inventory of U.S. greenhouse gas emissions and sinks: 1990-2008 (U.S. EPA # 430-R-10-006). Washington, D.C.: U.S. EPA. Retrieved April, 2010, from http://www.epa.gov/climatechange/emissions
Acknowledgments
We would like to acknowledge financial support from the American Farmland Trust, Center for Agriculture in the Environment, which helped support the initiation of this effort. In addition, we would like to express our continuing support and appreciation to the Agricultural Experiment Stations in Arizona, Colorado, and New Mexico, and to funding through USDA's Hatch Act for ongoing support of agricultural research. All opinions, findings, conclusions, and recommendations either explicitly or implicitly expressed in this document are solely those of the authors based on their objectivity and expertise, and do not in any way reflect those of the American Farmland Trust.
To find more resources for your business, home, or family, visit the College of Agricultural, Consumer and Environmental Sciences on the World Wide Web at aces.nmsu.edu.
Contents of publications may be freely reproduced for educational purposes. All other rights reserved. For permission to use publications for other purposes, contact pubs@nmsu.edu or the authors listed on the last page of the publication.
New Mexico State University is an equal opportunity/affirmative action employer and educator. NMSU and the U.S. Department of Agriculture cooperating.
Printed and electronically distributed July 2011, Las Cruces, NM.