Guide Z-129
Pilja Vitale, Madhav Regmi, Don Martinez, and Bonnie Hopkins Byers
College of Agricultural, Consumer and Environmental Sciences, New Mexico State University
Author: Respectively, Extension Economist, Department of Extension Economics (EE); Associate Professor, Department of Agricultural Economics and Agriculture Business (AEAB); Agricultural Agent, Rio Arriba County Extension Office; and County Program Director, San Juan County Extension Office. New Mexico State University. (Print-friendly PDF)
Photo by Jane Moorman, NMSU 2010.
The first of the Livestock Enterprise budgets series “Understanding the Livestock Budget” explains how to interpret and understand NMSU’s historical livestock budgets (https://pubs.nmsu.edu/_z/Z128/index.html). In this fact sheet, we will provide instructions on how producers can create their own livestock budget to follow those posted on our website (https://costsandreturns.nmsu.edu/).
This Excel template can help you develop your own budget.
The example has nine parts based on cost items, following the Southeast Region’s large cow/calf budget for 2024 as an example.
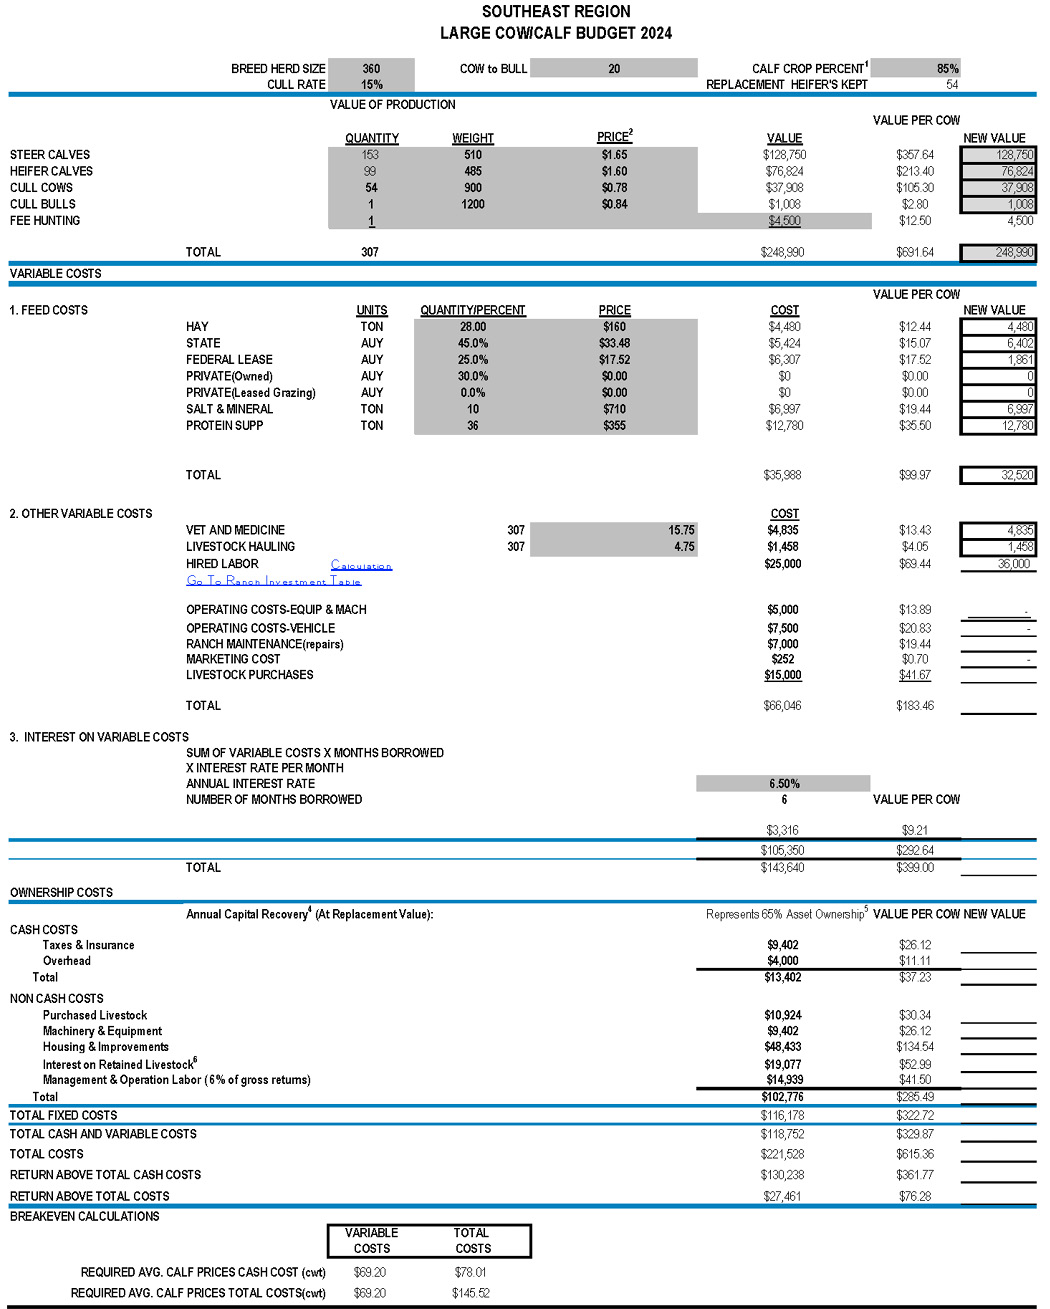
Part 1: Herd summary
Part 1 of the budget provides basic information about a ranch’s herd and production practices. This information provides the foundation of a ranch’s revenues and costs on a year-to-year basis
The table below shows that the ranch in the Southeast region has 360 breeding cows and a cull rate of 15%. This means that 54 heifers are replaced annually (calculated as 360 cows * 0.15 cull rate). The cow-to-bull ratio is 20:1, which means that 20 cows require one bull. 85% of the herd’s cows produce a live, saleable calf, resulting in 306 calves (calculated as 360 cows X 0.85 Calf crop percent).

Figure 1. The Southeast Region Large Cow/Calf Budget for 2024 showing breed herd size, cull rate, cow-to-bull ratio, calf crop percent, and replacement heifer’s kept.
You can enter your herd information in the dark grey highlighted cell on the Excel spreadsheet (Appendix 1) to update this information for your use. This includes breed herd size 360, cull rate 15, number of cows to bull 20, and calf crop percentage 85. The new value columns also include other income, such as hunting fees. Replacement heifers held automatically appear with previous information (Appendix 1).
Part 2: Value of production
Part 2 of the budget provides the producer’s total revenues from selling all types of cattle and generating other income related to cattle raising annually. It provides the foundation for a ranch’s revenue information.
The value of production is defined as total cash receipts, which can include direct sales (such as steer calves, heifer calves, cull cows, and bulls sold) and income related to cow/calf production, such as fee hunting. The example below shows 153 steer calves that weighed 510 pounds on average sold, for a total of $128,750. Heifer calves were sold (99 head at 485 pounds on average) for a total of $76,824. Other returns from 54 cull cows and one cull bull are calculated similarly. The total revenues from steer calves, heifer calves, cull cows, and cull bulls in this example is $248,990, which includes $4,500 in hunting fee revenues.
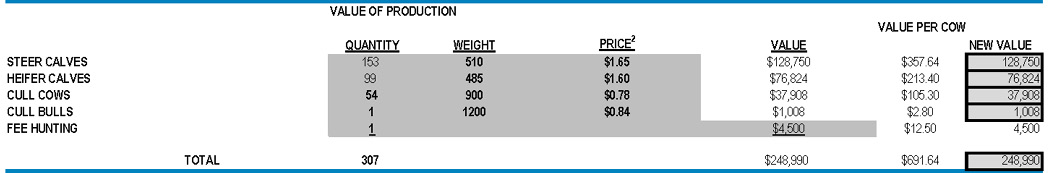
Figure 2. Value Production section of the Southeast Region Large Cow/Calf Budget for 2024.
To create a new value, you can change the quantity, weight, and price for each type of cattle highlighted in dark grey cells. The new value columns change automatically.
Part 3: Variable cost – 1. Feed costs
Part 3 of the budget provides the main feed costs incurred for the number of cattle raised annually
Feed costs include hay, grazing fees from state and federal leases, private (owned) grazing, private leased grazing, salt and minerals, and protein supplements. The example below shows that hay costs are calculated as price multiplied by quantity. The hay cost is $4,480 (calculated as 28 tons x $160/ton). The State Leased Grazing Fee, Federal Leased Grazing Fee, and Private eased Grazing Fee are calculated based on the Total Animal Unit Year (AUY), which is not shown on the sheet but automatically calculated from Part 1, multiplied by their percentage of that pasture type used. The cost of salt and minerals is $6,977 and the cost of protein supplements is $12,780, both calculated similarly to the cost of hay. This procedure results in a total feed cost of $35,988 per ranch or $99.97 per head.
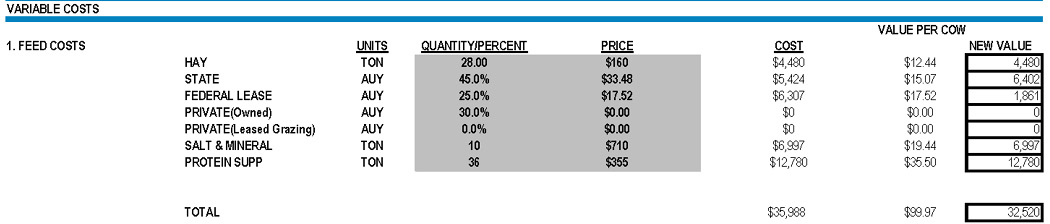
Figure 3. Variable Costs section of the Southeast Region Large Cow/Cull Budget for 2024.
For your new value, change the values of quantity/percent and prices in the yellow highlighted cells, then it will automatically give new values.
Part 4: Other Variable Costs
Part 4 of the budget provides the other costs incurred in the number of cattle raised annually. These include veterinary and medical expenses, livestock hauling, hired labor, equipment & machinery operating costs, vehicle operating costs, ranch maintenance, marketing costs, and livestock purchases not shown in Part 3.
This example indicates the veterinary cost is calculated as the total number of heads sold multiplied by the veterinary cost per head: 307 heads (livestock sold) x $15.75/head = $4,835. Livestock hauling is calculated as the total number of heads sold times the hauling cost per head (307 heads x $4.75/head = $1,458). Hired labor includes both full-time and seasonal/contract labor. Operating costs for machinery and vehicles are calculated using the investment values for machinery and vehicles from the ranch investment table (Appendix 2). These costs include repair, fuel, and lubrication expenses.
Ranch maintenance costs are based on buildings and improvements listed in the ranch investment table that account for the repair costs (Appendix 2). The beef checkoff is calculated at $1 per head for steer and heifer calves sold, resulting in 252 calve heads sold X $1 = $252.
Livestock purchases include bulls, horses, and cows, with related purchasing. Generally, 20% of total bulls are replaced annually, estimated at approximately $15,000.
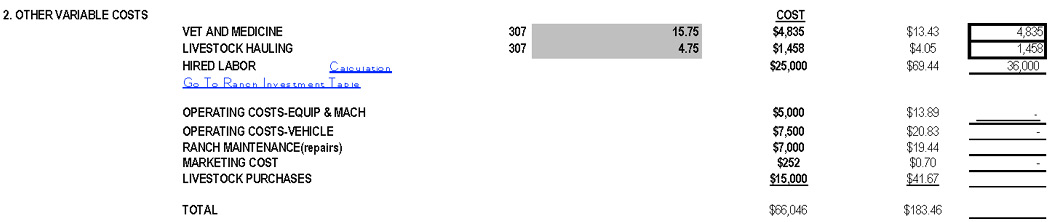
Figure 4. Other Variable Costs section of the Southeast Region Large Cow/Calf Budget for 2024.
Enter the unit prices of sold cows for vet and medicine and livestock hauling in yellow highlighted cells.
For hired labor, click Calculate in the Hired Labor row, the screen will move to the Hired Labor table and fill in hourly, part-time, and full-time labor in the yellow highlighted cells. After that, it automatically fills in the hired labor value in the budget sheet. Before filling out operating costs, click on the Go to Ranch Investment table.
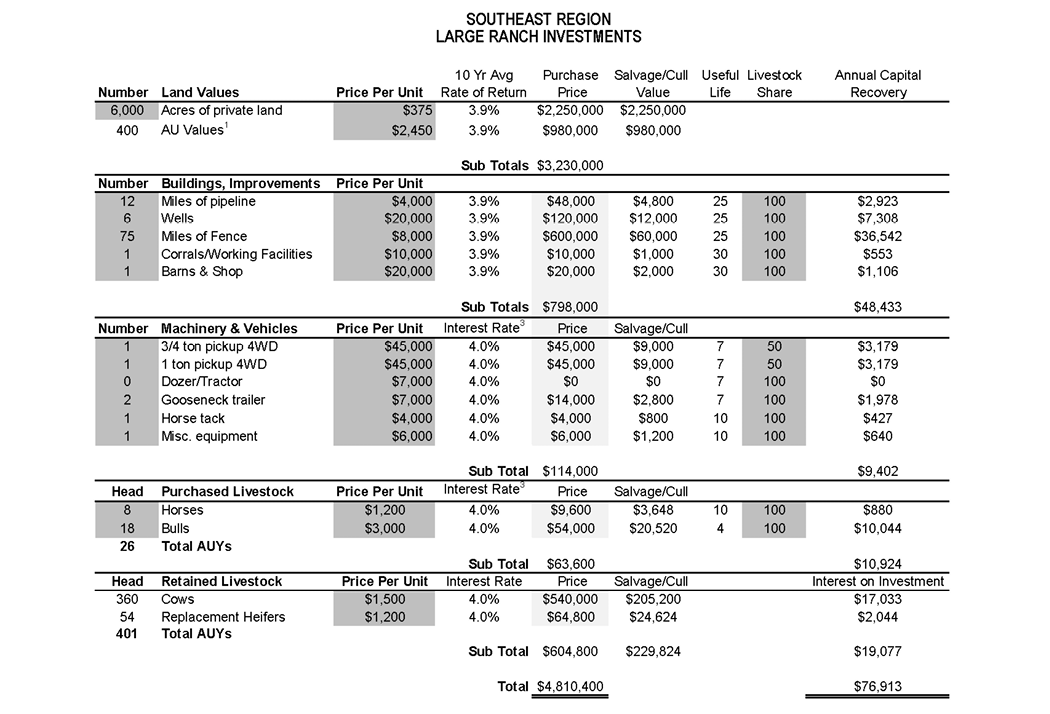
Part 5: In the ranch investment table (Appendix 2)
Part 5 of the budget intends to provide basic information on ranch ownership of land states, depreciation costs of ranch buildings, machinery, and livestock, and their operating costs. It is a separate table from the main budget table but connected to it by providing ownership costs of non-cash costs such as purchased livestock, machinery & equipment, housing & improvements, and interest on retained livestock.
In this table, you update the dark grey highlighted cells by replacing the values with estimates close to those reflective of your operation to calculate the depreciation of these investments. Land value requires updating the unit price of privately owned land and the unit price of AUY values.
In buildings and improvements, using information reflective of their operation, you update the number of miles of pipeline, wells, miles of fence, corrals, barns & shops, and the price of units such as miles, units of wells, units of barns &shops. Similar updates are applied for machinery and vehicles.
Lastly, you update the number of horses and bulls, and their unit prices, as well as numbers related to retained livestock such as cows and replacement heifers with their unit prices.
Entering these above numbers will automatically fill in the Non-Cash Costs columns, such as Purchased Livestock, Machinery & Equipment, Housing & Improvements, and Interest on Retained Livestock.
Then, by clicking on Go Back Original Sheet, the screen will go to the budget table.
Next, to update operating costs, click Go to Fuel & Repair. The screen moves to Fuel & Repair sheet. You fill out the yellow highlighted cells such as repair and fuel costs. then, automatically operating costs and ranch maintenance are filled out in the budget sheet,
Then, click Go to the Budget sheet, and find the livestock purchase row, click Go to Livestock Purchase table. You should fill out the livestock purchases. Marketing costs are automatically filled out previously.
Part 6: Interest on variable costs and return over variable costs
Part 6 of the budget provides the opportunity cost of variable costs (the sum of Part 3 and Part 4). Opportunity costs measure what could be gained by investing in the next-best investment opportunity, for example, investing through a financial institution. By investing in cattle production, you “lose” what might be gained through an alternative investment opportunity.
The table below shows an interest rate of 6.5% and a borrowing period of 6 months, and the total variable cost is $105,350 at the bottom of the table. The return over total variable costs (calculated as the value of production - total costs) $143,640 per ranch, or $399 per head.
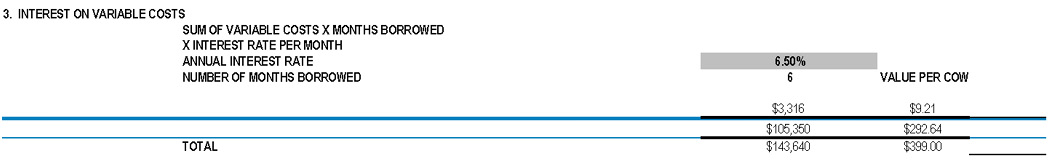
Figure 5. Interest on Variable Costs section of the Southeast Region Large Cow/Calf Budget for 2024.
Enter your operating interest rate.
Part 7: Ownership Costs
Part 7 provides information about ownership costs, which are opportunity costs, similar to the costs in Part 6. Ownership costs are also incurred because you own the assets. These ownership costs are divided in two parts: cash costs and non-cash costs. Cash costs include taxes, insurance, and overhead, while non-cash costs include the annual recovery costs of purchased livestock, machinery and equipment, housing, improvements, and so on.
In cash costs, the table below shows that taxes and insurance amount to $9,492. This includes taxes on livestock, land taxes, and insurance. Insurance includes farm property insurance covering buildings and equipment, and liability insurance covering expenses for which you become legally obligated to pay for bodily injury claims on the ranch property and damages to another person’s property by their cattle.
In this part, you should update Taxes & Insurance, and Overhead.
To update the taxes and insurances, click on Go to taxes and insurance link and the screen shows label 4. Tax and insurance, you fill out two yellow highlighted columns for taxes and the below two yellow heightened columns for insurances.
Overhead expenses are costs not directly associated with production but contribute to livestock production. These inputs include electricity, telephone services, butane and heating, accounting, and legal services, totaling $4,000 per ranch in the example below.
To update the overhead, click on Go to overhead link, and the screen will show 5. Overhead, you fill out four yellow highlighted columns such as 1. Electricity, 2. Telephone services, 3. Butane and heating, 4. Accounting and legal services.
Non-cash ownership costs arise from annual capital recovery costs associated with each investment listed in the ranch investment table. As previously mentioned, capital recovery costs include both depreciation and interest on these ranch investments.
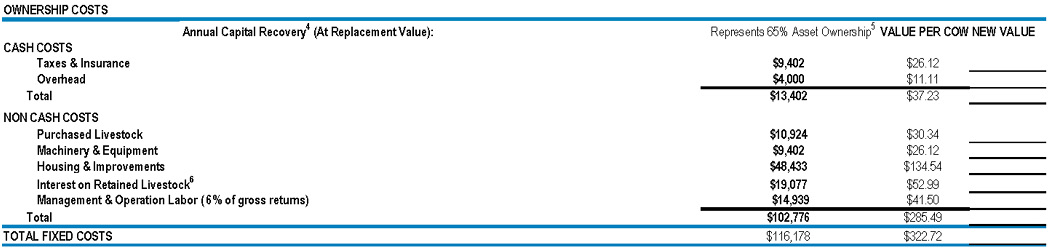
Figure 6. Ownership Costs section of the Southeast Region Large Cow/Calf Budget for 2024.
Part 8: Overall costs and returns – Budget Interpretation
Part 8 of the budget provides total costs and two different returns (return above total cash cost and return above total costs) on an annual basis per ranch and per cow. This information is crucial for understanding how much income is generated for the ranch and per cow in the cattle business in New Mexico.
From the information you provided, the following results are automatically generated in the Excel sheet.
Total cash and variable costs are $118,752, Total costs are $221,528. The return above total cash costs is $130,238. If the return above total cash costs is negative, the ranch cannot do business for long since it is at a loss.
Finally, the return above total costs is $27,461, or $76.28 per head. If this measure is negative, the ranch may survive for a short time but cannot survive in the long term. The ranch has to change its structure to improve management by enhancing the grazing system, water development, optimal herd size, and so on.

Figure 7. Budget interpretation of the Southeast Region Large Cow/Calf Budget for 2024.
Part 9: Breakeven Calculations – Budget Interpretation
Part 9 provides the break-even value, how much a ranch requires to raise the cattle without loss but not profit. Here, you have to sell the calves produced by your ranch should sell the breakeven value to cover your cost with profit or loss
This value is also automatically generated by the Excel sheet given the information entered by you.
The budget “said” to raise an average calf (100 pounds), it would require $69.20 for cash costs (the top left), and $145.52 for total variable costs (including all depreciation and interest. The bottom right). In other words, you have to sell a calf produced in your ranch at least $69.20 per cwt to cover just variable cost, $145.52 per cwt to cover total cost.

Figure 8. Breakeven Calculations section of the Southeast Region Large Cow/Calf Budget for 2024.
Summary
Through this budget-making process you can explore, you can understand the exact costs and returns of raising cattle, as outlined in Parts 8 and 9. Part 8 informs you about different returns from raising cattle, considering both short-term costs (only variable costs) and long-term costs (both variable and ownership costs). Using this information, you can begin to plan how to improve their returns by increasing revenues and decreasing costs, through a detailed examination of each revenue and cost item (Parts 1–6). Part 9 provides information on the costs required to raise cattle on the ranch, as well as the cost per cow, ensuring that profits are not lost. This also serves as a plan for preparing the costs for the ranch for the following year.
These return and cost items may vary from ranch to ranch depending on different cattle-raising systems, so a ranch can adjust the spreadsheet according to their needs. It serves as a reference for livestock budget planning.
The workbook to develop your own budget can be found here.
Appendix 1.
The livestock budget can be updated on the dark grey highlighted cells with your information.
Appendix 2. Ranch Investment Table
Note: the dark grey highlighted cell needs to be updated to adjust your situation.
References
- American Agriculture Economic Association. (2001). Commodity Costs and Returns Estimation Handbook. https://ageconsearch.umn.edu/record/269451?ln=en&v=pdf
- Gray, J.R., Jones, M.L., & Folwer, J.M. (1981). Organization, Costs, and Returns of Cattle Ranches in Southwestern New Mexico, 1979 (Bulletin 684). New Mexico Agricultural Experiment Station. https://nmsu.contentdm.oclc.org/digital/collection/AgCircs/id/60553/
- Hawkes, J.M., & Libbin, J.D. (2007, November). Range Livestock Costs and Returns for New Mexico, 2000 (RITF 73). Range Improvement Task Force, New Mexico State University. https://pubs.nmsu.edu/_ritf/RITF73.pdf
- New Mexico State University. (n.d.). Livestock Budgets. Cost and Returns Estimates for Farms and Ranches 2013-2019. https://costsandreturns.nmsu.edu/
- Ozeran, R.K., Stewart, D., & Summer, D.A. (2019). 2019 Sample Costs for Beef Cattle: Cow – Calf Productions Central San Joaquin Valley. University of California Agriculture and Natural Resources, Cooperative Extension. https://coststudyfiles.ucdavis.edu/uploads/cs_public/2e/90/2e901c98-7f60-42bf-83e5-43fac1e9a571/2019beefcowcalfcentralsanjoaquinvalleyamended92319.pdf
- Pingrey, H.B. (1948). Cattle ranching in Southeastern New Mexico (Bulletin 336). https://nmsu.contentdm.oclc.org/digital/collection/AgCircs/id/32337/
- Teegerstrom, T., & Tronstad, R. (2016). Arizona Ranching Budget: 2016 (az1734). The University of Arizona Cooperative Extension. https://extension.arizona.edu/sites/extension.arizona.edu/files/pubs/az1734-2017.pdf
- Torell, L.A., & Word, W.B. (1991). Range Livestock Cost and Return Estimates for New Mexico, 1989 (Research Report 656). New Mexico State University. https://nmsu.contentdm.oclc.org/digital/collection/AgCircs/id/64117/
- Torell, L.A., Williams, A., & Brockman, B.A. (1990). Range Livestock Cost and Return Estimates for New Mexico, 1986 (Research Report 639). New Mexico State University. https://nmsu.contentdm.oclc.org/digital/collection/AgCircs/id/54055/
- Vitale, P., Lillywhite, J., Regmi, M., Mikkelson, S., Blayney, D., Medina, E., & Patrick, M. (2024, August). Enterprise Budget Series 2/3: Understanding NMSU’s Crop Cost and Return Budgets (Guide Z-121). New Mexico State University Cooperative Extension Service. https://pubs.nmsu.edu/_z/Z121/index.html
Read Part 1: Understanding NMSU’s Livestock Cost and Return Budgets

Pilja Vitale is an extension economist in the Cooperative Extension Service at New Mexico State University. She received her B.S. in Agricultural Economics from Seoul National University, an M.S. in Agricultural Economics from Texas A&M University, and a Ph.D. in Agricultural Economics from Oklahoma State University. Vitale worked with vegetable farmers in Oklahoma for about 20 years and her interest areas are crop and livestock budgets and production economics.
To find more resources for your business, home, or family, visit the College of Agricultural, Consumer and Environmental Sciences on the World Wide Web at pubs.nmsu.edu.
Contents of publications may be freely reproduced, with an appropriate citation, for educational purposes. All other rights reserved. For permission to use publications for other purposes, contact pubs@nmsu.edu or the authors listed on the publication. New Mexico State University is an equal opportunity employer and educator. NMSU and the U.S. Department of Agriculture cooperating.
March 2025. Las Cruces, NM.