Guide Z-128
Pilja Vitale and Jay Lillywhite
College of Agricultural, Consumer and Environmental Sciences, New Mexico State University
Author: Respectively, Extension Economist, Department of Extension Economics (EE), and Director of Agricultural Experiment Station. (Print-friendly PDF)
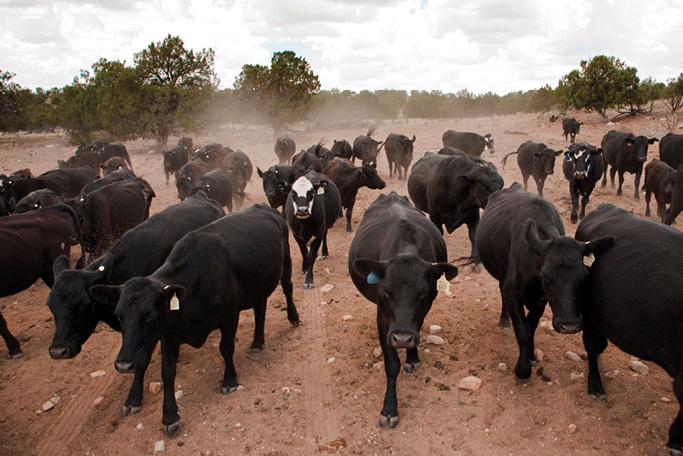
Photo by Geraint Smith. NMSJ, 2021.
New Mexico State University’s Cooperative Extension Service has developed and published livestock enterprise budgets since 1948.6 Budgets for the previous ten years, since 2013, are available on the university’s website (URL: https://costsandreturns.nmsu.edu/). This factsheet provides an overview about how these New Mexico livestock budgets are developed. In future articles, information about how ranchers can develop customized budgets that represent their specific operations will be provided.
NMSU’s cow/calf livestock budgets have been developed at five regional levels to account for variations in topography, forage production, ranch characteristics, and weather, among other factors observed within the state. The budgets for 2019 were prepared for representative farms located in five regions—Central, Northeast (NE), Northwest (NW), Southeast (SE), and Southwest (SW)—with different sizes (small, medium, large, and extra large) based on bred cow herds. For example, in the 2019 budget posting, the University published four budgets for the Southeast region representing different ranch sizes, e.g., extra-large (495 bred cows), large (360 bred cows), medium (180 bred cows), and yearlings (1,200 yearlings).
Budget Information
NMSU livestock cost and return budgets use information obtained from various sources, including primary information collected directly from ranchers and input suppliers, published secondary data most often from state and federal agricultural agencies, and market reports. The livestock budgets provide estimates of revenues and costs for a representative ranch. As such, the information in the budgets should be considered informational and users should recognize that individual rancher experiences may differ.
Budget Presentation
The budgets are summarized in two tables that include:
- Ranch livestock budget (Appendix A1)
- Ranch investments (Appendix A2)
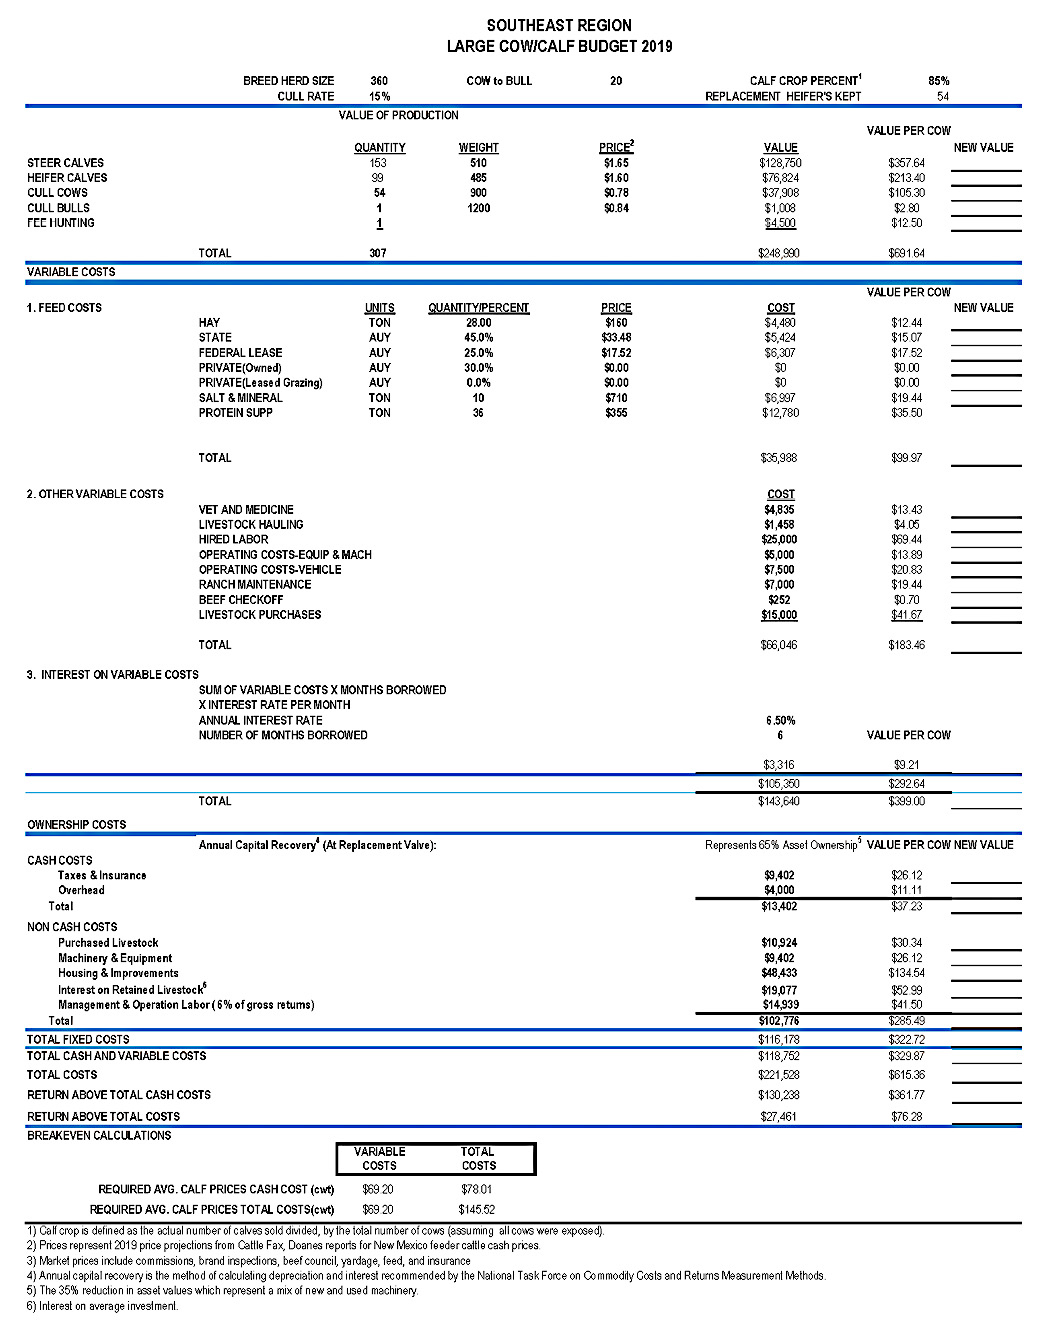
The following descriptions use the 2019 Southeast Large Cow/Calf Budget as a guide but are relevant to all the NMSU livestock budgets.
I. Ranch Livestock Budget Table (Appendix A1)
The livestock enterprise budgets are presented in six different sections:
- Ranch production performance assumptions
- Value of production (revenues)
- Variable costs
- Ownership costs
- Ranch performance measures in costs and returns
- Breakeven costs
1. Ranch Production Performance Assumptions
The two lines below the budget title, e.g., “Southwest Region Large Cow/Calf Budget 2019,” provide information about the representative ranch being modeled. Information in this section includes the number of bred cows on the ranch (ranch size), the assumed cow-to-bull ratio, the assumed calf crop percentage (where calf crop is defined as the actual number of calves sold, divided by the total number of cows, assuming all cows were exposed), the cull rate, and the number of replacement heifers kept on the ranch. The assumptions are reflected in the estimated returns and costs.
2. Value of production (Revenues)
The “Value of Production” section provides a summary of revenues generated on the ranch. Revenues can include sales of offspring, e.g., steer and heifer sales, as well as the sale of cull animals, e.g., cull bulls and cows. Additionally, the budget accounts for the potential for fee-based hunting opportunities on the ranch. The budget identifies the number of animals sold, an estimate of their average weight measured in pounds, and the sale price per pound. Fee-based hunting revenue is provided in the budget as a revenue per hunt. The market prices include commissions, brand inspections, beef council, yardage fees, and insurance (footnote 3 in 2019 livestock enterprises in the Central region large size).4
3. Variable Costs
The variable costs section provides a summary of feed costs, other variable costs, and interest on variable costs. Variable costs change prices depending on the number of livestock raised.
3.1 Feed costs
The feed costs section itemizes all feed items and their estimated costs, including hay, grazing, and lease/permit fees from private leases, state leases, and federal agencies, e.g., the U.S. Forest Service (USFS) and the Bureau of Land Management (BLM). It also includes grazing costs for privately owned land. Accounting for state and federal lease fees is especially important in New Mexico, since 55% of state rangelands are owned by the federal government, including the BLM, the USFS, and other federal agencies, while about 10% are owned by the state and managed by the State Land Office.
Leases (federal, state, and private) are delineated by animal units for the year (AUYs). An AUY is defined as a 1,000-pound cow and its calf or equivalent, consuming 26 pounds of grass daily for 365 days. Ranchers that hold federal and/or state grazing permits have a specific agreement detailing the number of AUYs allowed on each grazing allotment. The feed costs also include purchased hay required to satisfy nutrient and caloric requirements, salt and minerals, protein supplements, including protein blocks, liquid feed, and grains. The budgets provide a price per AUY and a percentage of the grazing obtained land ownership, e.g., state, federal or private (the percentages add up to 100%).
3.2 Other Variable Costs
Other variable costs include veterinary and medicine expenses, livestock hauling, hired labor, operating costs for equipment and machinery, vehicles, range maintenance, beef checkoff, and livestock purchases.
Vet and Medicine. Vet and medicine costs include costs of vaccines and deworming, medicines, veterinary services, and tagging. Tagging ensures that animals can be linked to their owners and is used to record changes in ownership when animals are sold.
Livestock Hauling. Livestock hauling includes transportation of cattle such as the costs for commercial hauling of the cattle between summer and winter grazing or between leased pastures.
Hired Labor. Hired labor includes full-time, seasonal, and contracted labor costs.
Operating Costs. The operating costs section contains two components: operating costs for equipment and machinery, and operating costs for vehicles. Operating costs for equipment & machinery include costs for repairs, fuel, and lubrication for dozers, tractors, horse tack, miscellaneous livestock equipment, and shop and other equipment costs. Operating costs for vehicles include repairs, fuel, and lube of vehicles including pickup trucks and gooseneck trailers.
Ranch Maintenance. Ranch maintenance includes maintenance of pipelines, wells (tanks and reservoirs), fences, corrals/working facilities, and barns & shops.
Beef Checkoff. A flat rate fee per head for beef promotion and research; the funds are split in half between the New Mexico Beef Council and the National Cattlemen’s Beef Promotion and Research Board.
Livestock Purchases. Livestock purchases include bull and horse purchases. Every year, about 20 percent of total bulls are purchased; horses are also purchased but less frequently. The costs also include marketing costs such as commissions, brand inspections, beef council fees, yardage, feed, and insurance for buying and selling livestock. The budget assumes all cows are obtained via retained heifers.
3.3 Interest on Variable Costs
Interest expense may include actual interest expenses associated with operating loans, or it may represent the opportunity cost associated with using ranch funds to cover costs, i.e., it accounts for lost interest revenue associated with forgone ranch funds used to pay for ranch expenses. The interest expense is based on variable costs, the interest rate, and the number of months borrowed. A good measure of interest rate could be an average of the period of study for the 30-year Treasury Rate. The detailed calculation is provided in Appendix A3 in this factsheet.
4. Ownership Costs
Ownership costs are those costs incurred due to ownership, but they do not change with the level of production. Such costs are known as fixed costs but is also true that they’re linked to big expenses and investments disclosed under cash and non-cash costs.
4.1 Cash Costs of Ownership
Cash costs include taxes, insurance, and overhead.
Taxes. This includes all taxes levied on estate property owned by the ranch, including land, barns, machinery, and livestock. Livestock is valued according to Property Tax Division orders and is taxed based on the number of months of grazing in New Mexico. The tax rate is approximately 0.3% of the total value of each type of livestock, such as bulls, cows, replacement heifers, and yearling heifers.
Insurance. Insurance includes farm property insurance that covers buildings and equipment, as well as liability insurance that covers expenses the ranch becomes legally obligated to pay, such as bodily injury claims on the ranch property and damages to another person’s property by their animals.
Overhead. Overhead includes costs for electricity, telephone, heating fuel, etc.
4.2 Non-cash Costs of Ownership
Non-cash costs include purchased livestock, machinery and equipment, housing, and improvement. These costs are calculated using the annual capital recovery method. Details of this method are in Appendix A3 in this factsheet. The values of each item are calculated in the Ranch investment table bringing to the non-cash costs of ownership of the budget tables.
5. Measures of Ranch Management Performance
The Measures of Ranch Management and Performance provides a summary of estimated costs and the returns above costs, both for the ranch as a whole and on a per-cow basis. Four summary measures are provided in the NMSU livestock cost and return budget. They include:
- Total Cash and Variable Costs = Total Cash Costs + Total Variable Costs
- Total Costs = Total Variable Costs + Total Fixed Costs
- Return Above Total Cash Costs = Value of Production (Revenue) – Total Cash and Variable Costs
- Return Above Total Costs = Return Above Total Cash Costs – Total Fixed Costs
The Return Above Total Cash Costs is important as it is a measure of cash flow. A ranch that does not have a positive return will not be able to operate in the long run. The Return Above Total Cost measure includes both cash and non-cash expenses. A ranch that has a negative return may be able to operate in the short run, but as it is not recovering non-cash expenses, it will not be able to survive in the long run. If a rancher finds themselves in this situation, i.e., negative Returns Above Total Costs, they must restructure or change management practices in such a way that ranch revenues can cover total costs.
6. Breakeven Costs
This section has two components: 1) required average calf prices for cash cost per cwt, and 2) required average calf prices for total costs per cwt.
To break even, i.e., have profits of zero, the ranch must earn the value of calf production to cover their minimum variable costs, or total cash and variable costs, or total costs. The detailed calculations are in Appendix A3.
II. Ranch Investments Table
The ranch investment table defines the typical assets associated with the ranching operation (Appendix A2). The table is divided into five sections: 1) land values, 2) buildings, improvement, 3) machinery & vehicles, 4) purchased livestock, 5) retained livestock.
1. Land Value
This section includes the total acreage of private land owned and the estimated number of animal units for the year (AUY). Generally, AU values are larger than the breed heard size, as they include bulls, replacement heifers, and other livestock classes. The number of AUs represents the combination of both private and public land.
2. Building & Improvements
Building ownership and improvements constitute a significant part of capital investment in New Mexico. The actual ownership of range assets depends on the location of the asset. Range assets purchased and installed under a cooperative agreement located on Bureau of Land Management or U.S.Forest Service lands are considered property of the United States.7 Only those assets purchased and installed by the rancher on private, state, and federal lands are considered a ranch’s asset in this budget.
The items are pipelines, wells, fences, corrals/working facilities, and barns and shops.
3. Machinery & Vehicles
Machinery includes tractors and miscellaneous livestock equipment, while vehicles include pickups and trailers.
4. Purchased Livestock
Bulls and horses are the only animals calculated as purchased in this budget. The numbers for cows (e.g., price, interest rate, and salvage value) are included but not in the section’s total.
5. Retained Livestock
The total number of cows and replacement heifers are considered retained livestock, with the numbers coming from the herd summary reported on the ranch budget table. An interest charge on average investment is used to represent the opportunity cost of retaining livestock. The interest for retained livestock reflects the capital invested in livestock that could have earned interest or other revenue in alternative risk-free investment opportunities.
Summary
NMSU’s Livestock Cost and Return Budgets are estimates of the costs and returns associated with producing livestock throughout the state. The budgets are developed and presented in forms consistent with formats that the USDA has suggested. The budgets provide estimates of the costs and returns that might be expected for “typical” New Mexico ranchers across different regions and different herd sizes. As previously indicated, users should view the budgets as a guide rather than the exact return and costs they might expect for their operation.
Reference
- American Agriculture Economic Association. (2001). Commodity Costs and Returns Estimation Handbook. https://ageconsearch.umn.edu/record/269451?ln=en&v=pdf
- Gray, J.R., Jones, M.L., & Folwer, J.M. (1981). Organization, Costs, and Returns of Cattle Ranches in Southwestern New Mexico, 1979 (Bulletin 684). New Mexico Agricultural Experiment Station. https://nmsu.contentdm.oclc.org/digital/collection/AgCircs/id/60553/
- Hawkes, J.M., & Libbin, J.D. (2007, November). Range Livestock Costs and Returns for New Mexico, 2000 (RITF 73). Range Improvement Task Force, New Mexico State University. https://pubs.nmsu.edu/_ritf/RITF73.pdf
- New Mexico State University. (n.d.). Livestock Budgets. Cost and Returns Estimates for Farms and Ranches 2013-2019. https://costsandreturns.nmsu.edu/
- Ozeran, R.K., Stewart, D., & Summer, D.A. (2019). 2019 Sample Costs for Beef Cattle: Cow – Calf Productions Central San Joaquin Valley. University of California Agriculture and Natural Resources, Cooperative Extension. https://coststudyfiles.ucdavis.edu/uploads/cs_public/2e/90/2e901c98-7f60-42bf-83e5-43fac1e9a571/2019beefcowcalfcentralsanjoaquinvalleyamended92319.pdf
- Pingrey, H.B. (1948). Cattle ranching in Southeastern New Mexico (Bulletin 336). https://nmsu.contentdm.oclc.org/digital/collection/AgCircs/id/32337/
- Teegerstrom, T., & Tronstad, R. (2016). Arizona Ranching Budget: 2016 (az1734). The University of Arizona Cooperative Extension. https://extension.arizona.edu/sites/extension.arizona.edu/files/pubs/az1734-2017.pdf
- Torell, L.A., & Word, W.B. (1991). Range Livestock Cost and Return Estimates for New Mexico, 1989 (Research Report 656). New Mexico State University. https://nmsu.contentdm.oclc.org/digital/collection/AgCircs/id/64117/
- Torell, L.A., Williams, A., & Brockman, B.A. (1990). Range Livestock Cost and Return Estimates for New Mexico, 1986 (Research Report 639). New Mexico State University. https://nmsu.contentdm.oclc.org/digital/collection/AgCircs/id/54055/
- Vitale, P., Lillywhite, J., Regmi, M., Mikkelson, S., Blayney, D., Medina, E., & Patrick, M. (2024, August). Enterprise Budget Series 2/3: Understanding NMSU’s Crop Cost and Return Budgets (Guide Z-121). New Mexico State University Cooperative Extension Service. https://pubs.nmsu.edu/_z/Z121/index.html
Appendix A1: The Livestock Budget Example: Southeast Region Large Cow/Calf Budget, 2019.
Appendix A2: A Ranch Invest Example: Southeast Region Large Ranch Investment Table
|
Number |
Land Values |
Price Per |
10 Yr Avg Rate of |
Purchase Price |
Salvage/Cull Value |
Useful Life |
Livestock |
Annual Capital |
|
6,000 |
Acres of private |
$375 |
3.9% |
$2,250,000 |
$2,250,000 |
|||
|
400 |
AU Values1 |
$2,450 |
3.9% |
$980,000 |
$980,000 |
|||
|
Sub Totals |
$3,230,000 |
|||||||
|
Number |
Buildings, |
Price Per |
|
|
|
|
|
|
|
12 |
Miles of pipeline |
$4,000 |
3.9% |
$48,000 |
$4,800 |
25 |
100 |
$2,923 |
|
6 |
Wells |
$20,000 |
3.9% |
$120,000 |
$12,000 |
25 |
100 |
$7,308 |
|
75 |
Miles of Fence |
$8,000 |
3.9% |
$600,000 |
$60,000 |
25 |
100 |
$36,542 |
|
1 |
Corrals/Working Facilities |
$10,000 |
3.9% |
$10,000 |
$1,000 |
30 |
100 |
$553 |
|
1 |
Barns & Shop |
$20,000 |
3.9% |
$20,000 |
$2,000 |
30 |
100 |
$1,106 |
|
|
|
|
Sub Totals |
$798,000 |
|
|
|
$48,433 |
|
Number |
Machinery & |
Price Per |
Interest Rate3 |
Price |
Salvage/Cull |
|
|
|
|
1 |
3/4 ton pickup |
$45,000 |
4.0% |
$45,000 |
$9,000 |
7 |
50 |
$3,179 |
|
1 |
1 ton pickup |
$45,000 |
4.0% |
$45,000 |
$9,000 |
7 |
50 |
$3,179 |
|
0 |
Dozer/Tractor |
$7,000 |
4.0% |
$0 |
$0 |
7 |
100 |
$0 |
|
2 |
Gooseneck trailer |
$7,000 |
4.0% |
$14,000 |
$2,800 |
7 |
100 |
$1,978 |
|
1 |
Horse tack |
$4,000 |
4.0% |
$4,000 |
$800 |
10 |
100 |
$427 |
|
1 |
Misc. equipment |
$6,000 |
4.0% |
$6,000 |
$1,200 |
10 |
100 |
$640 |
|
Sub Total |
$114,000 |
$9,402 |
||||||
|
Head |
Purchased |
Price Per |
Interest Rate3 |
Price |
Salvage/Cull |
|
|
|
|
8 |
Horses |
$1,200 |
4.0% |
$9,600 |
$3,648 |
10 |
100 |
$880 |
|
18 |
Bulls |
$3,000 |
4.0% |
$54,000 |
$20,520 |
4 |
100 |
$10,044 |
|
80 |
Cows |
$1,500 |
4.0% |
$120,000 |
$45,600 |
8 |
100 |
$12,874 |
|
133 |
Total AUYs |
|||||||
|
Sub Total |
$63,600 |
$10,924 |
||||||
|
Head |
Retained |
Price Per |
Interest Rate |
Price |
Salvage/Cull |
|
|
Interest on |
|
360 |
Cows |
$1,500 |
4.0% |
$540,000 |
$205,200 |
|
$17,033 |
|
|
54 |
Replacement |
$1,200 |
4.0% |
$64,800 |
$24,624 |
$2,044 |
||
|
401 |
Total AUYs |
|||||||
|
Sub Total |
$604,800 |
$229,824 |
$19,077 |
|||||
|
Total |
$4,810,400 |
$76,913 |
Appendix A3: Various Equations for explaining Main text
1) Interest on Variable Costs
![]()
2) Calculation of the Annual Capital Recovery Method
Annual capital recovery is a method for calculating depreciation and interest, as recommended by the National Task Force on Commodity Costs and Returns measurement methods.1 Annual capital recovery is calculated through the following three steps in this study.
In the first step, we used the long-term interest rate used for calculating interest costs on capital investment. This includes the USDA-ERS’s 10-year average long-run Rate of Return on production assets for New Mexico, covering land, buildings, and improvements. It also considers a typical return on a low-risk investment (such as a 30-year Treasury bond) for intermediate assets such as machinery, vehicles, and purchased or retained livestock.
In the second step, capital recovery factors are calculated using the following equation (2) with the rate of return from the first step.

In the third step, calculate the capital recovery cost using the values from step 1 and step 2 and the following equation (3).
![]()
3) Breakeven Variable Costs Per CWT
Where “variable cost” is written in bold, it can be replaced to indicate the breakeven of total cost if the reader wants to know the breakeven total variable costs per cwt.


Pilja Vitale is an extension economist in the Cooperative Extension Service at New Mexico State University. She received her B.S. in Agricultural Economics from Seoul National University, an M.S. in Agricultural Economics from Texas A&M University, and a Ph.D. in Agricultural Economics from Oklahoma State University. Vitale worked with vegetable farmers in Oklahoma for about 20 years and her interest areas are crop and livestock budgets and production economics.
To find more resources for your business, home, or family, visit the College of Agricultural, Consumer and Environmental Sciences on the World Wide Web at pubs.nmsu.edu.
Contents of publications may be freely reproduced, with an appropriate citation, for educational purposes. All other rights reserved. For permission to use publications for other purposes, contact pubs@nmsu.edu or the authors listed on the publication. New Mexico State University is an equal opportunity employer and educator. NMSU and the U.S. Department of Agriculture cooperating.
March 2025. Las Cruces, NM.