Research Report 789
Jay Lillywhite and Erin Frye
College of Agricultural, Consumer and Environmental Sciences, New Mexico State University
Authors: Respectively, Professor, Department of Agricultural Economics and Agricultural Business, New Mexico State University; and private consultant. (Print friendly PDF)
Introduction
Food Cooperatives in the United States
Food cooperatives—retail grocery stores owned and operated by their customer-members—account for a relatively small portion of total retail food sales. Despite this, food cooperatives play a significant role in the food retailing sector, especially in intermediate supply chains (King et al., 2010)1. Their importance is often associated with giving small, local producers access to consumers while at the same time giving consumers access to locally produced foods. Additionally, food cooperatives have been associated with innovation within the retail food sector, promotion of societal interaction and well-being, and consumer education (Deller et al., 2009; Ipatenco, 2014; King et al., 2010).
While the exact number of food cooperatives operating in the United States is not kept by official government agencies, several sources can be used to identify the prevalence of food cooperatives in the country. For example, the National Co+op Grocers (a business services cooperative for retail food cooperatives) has 142 cooperative members operating 190 stores in 38 states (NCG, 2014). Researchers at the University of Wisconsin Center for Cooperatives estimated in 2009 there were 290 food cooperatives operating 446 establishments, with membership of nearly 0.5 million (Deller et al., 2009).
The popularity of and participation in consumer-owned cooperative grocery stores has waxed and waned over their history in the United States. Periods of their growth have often been associated with social, political, or economic turbulence (Deller et al., 2009). A resurgence of consumer interest in food nutrition and health (Rozin et al., 1996), food sources, and concern for local producers may indicate a positive future for food cooperatives. For example, Tice (2013) reports that of the top ten food trends ranked in the National Restaurant Association’s “What’s Hot in 2014,” four trends were related to sourcing locally produced food products. Cone Communications reports that 89% of Americans consider where a product was produced when making a food purchase decision, and two-thirds are willing to pay more for food that is sourced locally. Two-thirds of surveyed consumers indicated that their primary reason for purchasing locally sourced food was associated with supporting local businesses (Cone Communications, 2014).
Deller et al. (2009) estimated the economic impact of cooperatives in the United States for a large variety of different cooperative types, e.g., farm supply and marketing, credit unions, etc. Using input-output analysis, they estimated that total revenues for food cooperatives in 2009 were $2.10 billion. Direct revenues from cooperative sales translated into additional sales in associated industries of $26 million. The output multiplier associated with their analysis was 1.01. The corresponding employment multiplier was estimated to equal 1.13. The authors of the report indicate that they took a very conservative approach to estimating the economic impact of grocery cooperatives. For example, they use wages and benefits as a proxy for expenditures rather than revenue.

NMSU photo by John Garlisch.
|
Table 1. Food Cooperatives in New Mexico |
||||
|
Name |
Locations |
Years in |
Employees |
Membership |
|
La Montañita Co-op Food Market |
Albuquerque, Gallup, Santa Fe |
38 |
295 |
17,000 |
|
Dixon Cooperative Market |
Dixon |
9 |
9 |
350 |
|
Española Community Market |
Española |
2 |
0* |
300 |
|
Mountain View Market |
Las Cruces |
39 |
40 |
4,430 |
|
Los Alamos Cooperative Market |
Los Alamos |
3 |
37 |
1,700 |
|
Silver City Cooperative |
Silver City |
40 |
35 |
2,000 |
|
Taos Food Co-op |
Taos |
1 |
0* |
128 |
|
* Volunteers only |
||||
Food Cooperatives in New Mexico
New Mexico has seven food cooperatives with a total of twelve stores/outlets located in Albuquerque, Gallup, Dixon, Española, Las Cruces, Los Alamos, Santa Fe, Silver City, and Taos. Table 1 provides information about each of the state’s cooperatives, including name, location, years in business, number of employees, and the number of cooperative members.
New Mexico’s food cooperatives play an important role in bringing locally produced food and other grocery items from local producers to the state’s food customers. For example, La Montañita Cooperative Food Market, the largest of the state’s cooperatives, has six stores and sources more than 1,100 locally produced food and grocery items from about 400 local producers (La Montañita, 2014).
In 2013, New Mexico’s seven food cooperatives had estimated retail sales of nearly $44 million. Local (New Mexico) purchases of food and related grocery items were estimated to be over $5 million in 2013. The cooperatives’ operations, as well as their purchases of items produced within the state, not only have a direct contribution to the state’s economy but they also help support sales in other industries because dollars spent on cooperative operations (e.g., electricity) and locally purchased grocery items (e.g., produce) are re-spent in facilitating transactions in these related industries.
The analysis described in this report attempts to quantify the significance of these activities within the state’s economy. The “significance” of retail food cooperatives in the state might be thought of as the cooperatives’ contribution to the state’s output (or total number of jobs); that is, the activities of the cooperatives that “support” output (sales) and employment. Contributions are different than “impacts,” a term used to describe policies that either bring new outside revenues (through exports) into the economy or retain revenues in the economy that would otherwise leave via imports (Watson et al., 2007). Impacts in the case of food cooperatives would be significantly lower than the contributions described later because it is probable that local food producers would continue to sell to consumers through other marketing channels, e.g., farmers’ markets and retail stores (other than food cooperatives).
Data and Methodology
Data Collection and Classification
Information regarding sales and local purchases made by New Mexico’s seven food cooperatives was provided by Bob Tero, La Montañita Cooperative Operations Manager. Based on personal conversations with all seven stores’ cooperative management, records shared between cooperatives, and personal experience in the industry, Mr. Tero estimated the seven cooperatives (twelve stores) generated $43.9 million in total retail sales in 2013. Costs of goods sourced and purchased from producers and manufacturers in New Mexico were estimated to equal $5.1 million.
A breakdown of local purchases into eleven store departments, provided by La Montañita Cooperative management, was used to allocate local purchases to various IMPLAN industry segments, e.g., dairy, produce, etc. Since only La Montañita provided a breakdown of sales by department, percentages obtained for La Montañita were assumed to hold for the other food cooperatives. Local purchases were allocated to eleven grocery department categories as shown in Figure 1.
In order to allocate cooperative purchases from the eleven store departments into IMPLAN industry sectors with associated North American Industry Classification System (NAICS) industry sectors, analysts reviewed La Montañita cooperative records of annual purchases from local vendors in 2013. Using vendor names and information obtained from available vendor websites, dollar amounts of local purchases were allocated into IMPLAN industry sectors2. The percentage of local sales allocated to each industry sector was assumed to hold for all New Mexico food cooperatives.
The economic contribution of New Mexico’s food cooperatives was modeled in two parts. First, the contribution of the cooperatives’ general operations was modeled by accounting for the dollar sales from cooperative customers that remain in the state to cover cooperative expenses such as payroll, utilities, advertising, etc. Margins for IMPLAN’s industry sector 324 (Retail Stores–Food and beverage) were assumed to hold for New Mexico’s food cooperatives3. In addition to these “operating” contributions, contributions associated with the cooperatives’ purchases of locally produced food and grocery items were modeled as well. The $5.1 million in purchases made in New Mexico by the cooperatives were allocated to different IMPLAN sectors as described previously.
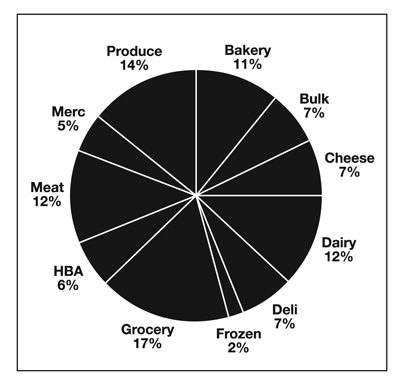
Figure 1. Percent of local purchases by store
department.
Input-Output Analysis
Background
The economic significance that food cooperatives have in New Mexico’s economy as a result of cooperatives’ operations and purchases of locally produced food and grocery products was estimated using input-output analysis. Input-output analysis, a well-known and commonly used tool to explore the effects of changes in one economic sector on other related sectors, was formalized and popularized by the Nobel Prize-winning economist Wassily Leontief in the early 1900s. The methodology uses a system of linear equations to model interdependencies between sectors within an economy, allowing practitioners to assess the impacts or contributions of various economic stimuli on local, regional, and/or national economies.
While providing important insights into the impacts or contributions that a particular event—e.g., purchasing locally produced food items—may have on the economy, input-output analysis has a number of strong simplifying assumptions that should be recognized (Leatherman, 1994). Among these are assumptions regarding the use of inputs such as (1) factor substitution is not allowed within the analysis period, regardless of changes in factor prices; (2) factors of production are fully utilized, and excess capacity is not recognized; (3) factors of production are unlimited in their availability; and (4) production functions are linear so that economies of scale are not recognized.
An additional acknowledgment regarding potential limitations of input-output analysis as applied to cooperatives should be made. Because common input-output models are based on aggregate data that does not make a distinction for cooperative business structures, the methodology may fail to fully account for the unique relationship cooperatives have within a local economy. For example, cooperatives are generally believed to purchase more of their inputs locally than other non-cooperative firms. If differences in local spending patterns are not reflected in the model then the significance of cooperative businesses may be underestimated (Zeuli and Deller, 2007).
The analysis conducted for this report has attempted to mitigate these limitations to the extent possible, e.g., modeling local purchases made by food cooperatives separately from the effects of cooperative operations, and allocating patronage refunds into the system via adjustments to household spending patterns. Additionally, the IMPLAN sectors used to model the contributions that New Mexico’s food cooperatives have within the state are based on relationships observed for all industry players within that sector. For example, IMPLAN’s industry sector 324 (Retail Stores–Food and beverage) models spending patterns and relationships associated with all food and beverage retail stores. The analysis may under- or overestimate the contribution of cooperatives to the extent that cooperatives have different relationships than those exhibited by the industry as a whole.
Commonly Used Summary Measures
Input-output models generally report impacts or contributions as three distinct effects: direct effects, indirect effects, and induced effects. Direct effects are the dollar impacts or contributions to the economy resulting from initial changes associated with the industry of interest. For example, sales of apples grown by farmers in the region would have a direct effect on the region’s economy. Indirect effects or contributions occur as the result of input suppliers purchasing products from other sectors within the economy, e.g., an apple farmer purchasing orchard equipment from a local implement dealer. Induced effects or contributions represent the value of increased spending by households resulting from incomes that were generated through direct and indirect effects, e.g., implement dealer employee’s purchase of groceries (IMPLAN Group, LLC, 2013).
Multipliers are a key feature of input-output analyses often reported with estimates of dollar and employment impacts. Multipliers summarize, in the form of a ratio, the total contribution associated with a particular activity, i.e., changes in output as a result of an initial investment or activity (Crawford, 2011). Figure 2 illustrates an economic multiplier by showing how one dollar of spending in an industry cycles through an economy. In the example, 60% of the initial (direct) effect—and of each subsequent expenditure round—is “leaked” outside of the economy. The example shows a total of six expenditure rounds as the initial expenditure slowly leaks out of the economy. The multiplier is found by adding up the expenditures that remain in the economy for each round and dividing that number by the initial expenditure: ($1.00 + $0.40 + $0.15 + $0.06 + $0.02 + $0.01) / $1.00 = 1.64. The multiplier in the example suggests that for each dollar of initial expenditure, an additional $0.64 in output (sales) is generated as input suppliers purchase goods and services needed to meet the initial demand.
Two multipliers commonly reported in input-output analyses are output multipliers and employment multipliers. Output multipliers summarize the total changes in sales or output in the study region resulting from an initial one-dollar change in output in the target industry. Similarly, employment multipliers summarize the relationship between changes in direct employment and total employment within the study region.
Multipliers that reflect the total effects (direct, indirect, and induced), as well as impacts such as commuting, taxes and social security, and household savings, are called “SAM” multipliers. The magnitude of multipliers depends on the spending patterns in the industries under study, specifically the magnitude of spending that leaks outside of the study region (the lower the leakage, the higher the multiplier). As such, multipliers associated with larger economic regions—like national or state economies—will be larger, all other considerations held constant, than those associated with smaller economic regions—like counties. Because economic regions vary in size and industries within a particular economic region vary in their spending patterns, it is difficult to predict an exact multiplier. Mulkey and Hodges (2012) suggest that total effect (SAM output) multipliers usually range between 1.5 and 2.5.
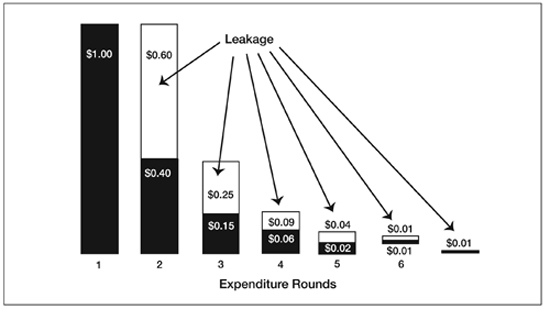
Figure 2. Visual representation of the economic multiplier.
|
Table 2. Estimated Economic Effects from New Mexico Food Cooperatives |
||||||
|
|
Operations |
NM Purchases |
Combined |
|||
|
Impact Type |
Employment |
Output |
Employment |
Output |
Employment |
Output |
|
Direct Effect |
214.6 |
$12,467,601 |
17.5 |
$4,905,154 |
232.1 |
$17,372,755 |
|
Indirect Effect |
20.0 |
2,386,814 |
13.5 |
2,013,715 |
33.5 |
4,400,529 |
|
Induced Effect |
40.7 |
4,630,698 |
12.8 |
1,442,320 |
53.5 |
6,073,018 |
|
Total Effect |
275.3 |
$19,485,113 |
43.7 |
$8,361,189 |
319.0 |
$27,846,302 |
IMPLAN Software
The input-output analysis used in this study used IMPLAN Group, LLC’s IMPLAN software and accompanying 2012 databases. The IMPLAN software was originally developed under the direction of the U.S. Forest Service in the 1970s and was privatized in 1993. Today, the IMPLAN Group, LLC has exclusive rights to license and distribute the software. IMPLAN is a popular software program and is used by federal and state government agencies, academic institutions, non-profit organizations, and a host of private firms such as consultants.
Results
Food and beverage stores are an important segment of the U.S. Economy. The U.S. Census Bureau reports sales for New Mexico food and beverage stores in 2009 of $2,542,000,000 (U.S. Census, 2012) or approximately $1,265 per person per year4. While a relatively small component of the state’s food sales (local food expenditures by the seven identified food cooperatives accounted for just over $5 million in 2013 or approximately $2.50 per person per year [0.2% of total food and beverage sales]), these food cooperatives play an important role in providing access to locally produced food. In addition, direct expenditures made by New Mexico’s food cooperatives support other industries via indirect and induced contributions.
Economic Output
New Mexico’s food cooperatives had total sales of $43.9 million in 2013. After margining these sales to account for expenditures that immediately leave the state, New Mexico’s food cooperatives had a direct contribution to the state’s output5 of $12,467,601. An additional $7,017,512 of output associated with indirect and induced effects were added to the direct contribution, for a total contribution from retail food cooperatives of $19.5 million.
New Mexico food cooperatives spent $5.1 million on New Mexico-produced food and grocery items, with a direct contribution to the state’s economy of $4,905,1546. These expenditures resulted in additional indirect and induced expenditures of $3,456,035, for a total output (the value of industry production) of $8,361,189. When contributions from operations are combined with those associated with purchases made from New Mexico producers, the total contribution of New Mexico’s cooperatives toward the state’s economy is $27,846,302. The output multiplier associated with the food cooperatives’ operations and New Mexico purchases was estimated to equal 1.60.
|
Table 3. Top Ten Industries Affected (Output) by Cooperative Operations |
|
|
Sector Description |
Output |
|
Retail Stores–Food and beverage |
$12,559,783 |
|
Imputed rental activity for owner-occupied dwellings |
721,593 |
|
Real estate establishments |
688,422 |
|
Food services and drinking places |
378,507 |
|
Monetary authorities and depository credit |
345,177 |
|
Wholesale trade businesses |
286,318 |
|
Telecommunications |
285,961 |
|
Private hospitals |
271,712 |
|
Offices of physicians, dentists, and other health |
267,061 |
|
Electric power generation, transmission, and distribution |
213,056 |
|
Table 4. Top Ten Industries Affected (Employment) by Cooperative Operations |
|
|
Sector Description |
Employment |
|
Retail Stores–Food and beverage |
216.2 |
|
Food services and drinking places |
6.6 |
|
Real estate establishments |
4.6 |
|
Offices of physicians, dentists, and other health |
2.3 |
|
Employment services |
2.0 |
|
Private hospitals |
1.9 |
|
Retail Stores–General merchandise |
1.7 |
|
Wholesale trade businesses |
1.7 |
|
Nursing and residential care facilities |
1.3 |
|
Business support services |
1.2 |
|
Table 5. Top Ten Industries Affected (Output) by Cooperative New Mexico Purchases |
|
|
Description |
Output |
|
Vegetable and melon farming |
$771,729 |
|
Fluid milk and butter manufacturing |
682,039 |
|
Bread and bakery product manufacturing |
644,930 |
|
Animal (except poultry) slaughtering, rendering, |
638,145 |
|
Cheese manufacturing |
434,487 |
|
Cattle ranching and farming |
333,437 |
|
Dairy cattle and milk production |
316,367 |
|
Food services and drinking places |
277,986 |
|
Wholesale trade businesses |
242,588 |
|
Coffee and tea manufacturing |
241,950 |
|
Table 6. Top Ten Industries Affected (Employment) by Cooperative New Mexico Purchases |
|
|
Description |
Employment |
|
Food services and drinking places |
4.9 |
|
Bread and bakery product manufacturing |
3.8 |
|
Vegetable and melon farming |
2.6 |
|
Support activities for agriculture and forestry |
2.3 |
|
Animal (except poultry) slaughtering, rendering, |
2.0 |
|
Cattle ranching and farming |
1.8 |
|
Dairy cattle and milk production |
1.5 |
|
Wholesale trade businesses |
1.4 |
|
Real estate establishments |
1.1 |
|
Animal production, except cattle and poultry and eggs |
1.1 |
Employment
Cooperative operations were estimated to have a direct employment effect of 215 jobs, with an additional 61 jobs associated with indirect and induced effects. Cooperative purchases of New Mexico-produced products had a direct employment effect of 18 jobs, with indirect and induced effects equal to an additional 26 jobs. When combined, New Mexico food cooperatives supported an estimated 319 jobs in the state. The combined employment multiplier, which accounts for both operations and purchases of New Mexico products, was 1.37. Table 2 shows estimated employment and output effects for cooperative operations and New Mexico purchases. Tables 3 through 6 show the top ten industry sectors affected by cooperative operations and New Mexico purchases.
Conclusion
Food cooperatives play a significant role in the food retailing sector, even though they account for a relatively small portion of total retail food sales. In addition to contributing to economic output, food cooperatives are credited with giving small, local producers access to consumers and giving consumers access to locally produced foods. Food cooperatives can also spur innovation within the food sector and promote societal interaction and consumer education (Deller et al., 2009; Ipatenco, 2014; King et al., 2010).
This research has explored the economic contribution that New Mexico food cooperatives make to the state’s economy. Using input-output analysis, facilitated via the use of IMPLAN, we found that food cooperatives in the state contribute more than $27 million annually to the state’s total output. The analysis also found that New Mexico food cooperatives supported an estimated 319 jobs within the state.
Footnotes
1 Intermediate supply chains are defined as supply chains for local products that reach consumers through one or more intermediaries (King et al., 2010).(back to top)
2 In some cases it was not possible to identify the type of product sold by the vendor. In these cases, allocation to a particular industry sector was not made, and the dollar amount from the vendor was not included in the calculation of the percent of purchases to industry sectors. Some vendors may sell products that could be allocated to more than one industry sector, but their sales were allocated to the sector that appeared to be most appropriate or for which they are best known.(back to top)
3 In order to account for the “non-profit” nature of cooperatives and patronage refunds, proprietors’ income in the IMPLAN program was set equal to zero, and the estimated $250,000 in patronage refunds associated with the 2013 operating year were incorporated as an increase in household income via a separate activity. The inclusion of household income in the model assumes that households that receive patronage refunds spend refunds in a manner consistent with their general spending patterns.(back to top)
4 Calculated using a population estimate of 2,009,671 (U.S. Census Bureau, 2014).(back to top)
5Represents industry production. For manufacturers, output equals sales plus changes in inventory. For service industries, output equals sales. For retail and wholesale trade industries, output equals gross margin (IMPLAN Group, LLC, 2014).
(back to top)
6The effects of cooperative purchases of New Mexico products might be thought of in two different ways. Since they support retail sales, the IMPLAN-generated direct effects might be more appropriately thought of as first-round indirect effects (purchases made to support cooperative sales). Alternatively, if one considers purchases of New Mexico food and related grocery products as an “output” of the food cooperative (a separate operation from purchases of products produced outside of the state) then the IMPLAN direct effects might be considered a second source of direct effects and can be added to operational direct effects. The latter approach was taken in this analysis.(back to top)
References
Cone Communications. 2014. 2014 Cone Communications food issues trend tracker. Available at http://www.conecomm.com/2014-food-issues-trend-tracker
Crawford, T. 2011. Income multipliers in economic impact analysis [Guide Z-108]. Las Cruces: New Mexico State University Cooperative Extension Service. Available at https://pubs.nmsu.edu/_z/Z108.pdf
Deller, S., A. Hoyt, B. Hueth, and R. Sundaram-Stukel. 2009. Research on the economic impact of cooperatives. Madison: University of Wisconsin Center for Cooperatives. Available at http://reic.uwcc.wisc.edu/sites/all/REIC_FINAL.pdf
IMPLAN Group, LLC. 2014. Glossary. Available at http://implan.com/index.php?option=com_glossary&view= glossary&glossid=13&Itemid=1481
Ipatenco, S. 2014. The advantages of food cooperatives. SFGate. Available at http://healthyeating.sfgate.com/advantages-food-cooperatives-2200.html
King, R.P., M.S. Hand, G. DiGiacomo, K. Clancy, M.I. Gómez, S.D. Hardesty, L. Lev, and E.W. McLaughlin. 2010. Comparing the structure, size, and performance of local and mainstream food supply chains [USDA Economic Research Report Number 99]. Available at http://www.ers.usda.gov/media/122609/err99_1_.pdf
La Montañita. 2014. Get to know us. Available at http://lamontanita.coop/mission/
Leatherman, J.C. 1994. Input-output analysis of the Kickapoo River Valley [Staff Paper 94.2]. Madison: University of Wisconsin Center for Community Economic Development. Available at http://www.aae.wisc.edu/cced/942.pdf
Mulkey, D., and A.W. Hodges. 2012. Using Implan to assess local economic impacts [FE168]. Gainesville: University of Florida Extension. Available at http://edis.ifas.ufl.edu/pdffiles/FE/FE16800.pdf
National Co+op Grocers. 2014. About us. Available at https://www.ncg.coop/about-us
Rozin, P., M. Ashmore, and M. Markwith. 1996. Lay American conceptions of nutrition: Dose insensitivity, categorical thinking, contagion, and the monotonic mind. Health Psychology, 15, 438–447.
Tice, C. 2013, Dec. 12. What you’ll eat next: Tasty food trends for 2014. Forbes. Available at http://www.forbes.com/sites/caroltice/2013/12/22/what-youll-eat-next-tasty-food-trends-for-2014/
United States Census Bureau. 2012. Table 1059. Retail trade and food services—Sales by type of store and state: 2009. In Statistical Abstract of the United States: 2012. Available at < http://www.census.gov/
compendia/statab/2012/tables/12s1059.pdf
United States Census Bureau. 2014. Annual estimates of the resident population: April 1, 2010 to July 1, 2013; 2013 population estimates. Available at http://factfinder2.census.gov/faces/tableservices/jsf/pages/productview.xhtml?pid=PEP_2013_PEPANNRES&prodType=table
Watson, P., J. Wilson, D. Tilmany, and S. Winter. 2007. Determining economic contributions and impacts: What is the difference and why do we care? The Journal of Regional Analysis & Policy, 37, 140–146.
Zeuli, K., and S. Deller. 2007. Measuring the local economic impact of cooperatives. Journal of Rural Cooperation, 35, 1–17.
For more on this topic, see the following publications:
TR-44: New Mexico Farmers' Markets
https://pubs.nmsu.edu/research/economics/TR44/index.html
RR-785: Economic Impact of Agriculture in the Southern Albuquerque, New Mexico Metropolitan Area
https://pubs.nmsu.edu/research/economics/RR785/index.html
RR-786: The South Valley—A Look at Small Farm Practices and Objectives Near Albuquerque, New Mexico’s Largest City
https://pubs.nmsu.edu/research/economics/RR786/index.html

Dr. Jay Lillywhite is an Associate Professor in the Agricultural Economics and Agricultural Business Department at New Mexico State University. He earned his Ph.D. in Agricultural Economics from Purdue University. Dr. Lillywhite's research addresses agribusiness marketing challenges and opportunities.
To find more resources for your business, home, or family, visit the College of Agriculture and Home Economics on the World Wide Web at aces.nmsu.edu
Contents of publications may be freely reproduced for educational purposes. All other rights reserved. For permission to use publications for other purposes, contact pubs@nmsu.edu or the authors listed on the publication.
New Mexico State University is an equal opportunity/affirmative action employer and educator. NMSU and the U.S. Department of Agriculture cooperating.
October 2015