RITF-88
College of Agricultural, Consumer and Environmental Sciences, New Mexico State University
Casey N. Spackman, Samuel T. Smallidge, Douglas S. Cram, and Marcy A. Ward
Authors: Respectively, Extension Range Specialist, Coordinator/Professor/Extension Wildlife Specialist, Extension Forest & Fire Specialist, and Extension Livestock Specialist, Range Improvement Task Force, New Mexico State University. (Print Friendly PDF)
Introduction
Rangeland monitoring in the Southwest is critical for assessing ranch- and pasture-level conditions and making management decisions. A variety of methods exists to collect rangeland monitoring data, but many are complex and labor-intensive. In 2007, the Range Improvement Task Force (RITF) developed the Rapid Assessment Methodology (RAM) to simplify and expedite rangeland monitoring. The technique incorporates the scientific method with regard to quantification and repeatability. RAM quantifies surface cover, species composition, stubble height, available forage, and relative animal visitation utilizing a step-point transect. While remote sensing and drone technologies for range monitoring are advancing quickly, there remains a need for simple and efficient rangeland monitoring, and RAM continues to be widely used by private landowners and agency personnel across New Mexico. This annotated document is intended to be used as a quick reference guide, supplementary to the more detailed procedures found in Allison et al. (2007).
Definitions
Exclusion cage: A structure used to temporarily fence an area within a pasture to prevent livestock and wildlife from foraging in order to assess annual forage production. Cages should be established prior to the start of grazing season, and sampling should occur at the end of the growing season.
Forage sampling hoop: Circular hoop of known size used to sample forage.
Growing season: In temperate climates, that portion of the year when temperature and moisture permit plant growth. In tropical climates, it is determined by availability of moisture.
Key area: A relatively small portion of a range selected as a monitoring point for grazing use because of its location, use, or grazing value. It is assumed that key areas, if properly selected, will reflect the overall acceptability of current grazing management over the range.
Pellet group: Animal fecal pellets of about the same size, shape, and age, with a minimum of 15 pellets representing a single defecation event.
Sampling bags: Breathable, paper bags that allow for vegetation to dry without molding.
Standing crop: The total amount of plant material per unit of space at a given time.
Transect: Path between two points where measurements are taken at specified intervals. A step-point transect uses the length of a walking pace as the interval, whereas a belt transect uses a rectangular area centered on the transect path, and measures all items of interest (e.g., fecal droppings, rare plants) within the rectangular area.
|
FIELD SUPPLIES FOR MONITORING |
||
|
Photo-points |
Transect data |
Forage collection |
|
|
|
|
|
|
|
|
|
|
|
|
Where To Monitor
- Select a key area for assessment that, due to its location, plant community, soil characteristics, grazing/browsing value, and/or use, serves as an indicative sample of forage production, trend, or degree of use by animals within the range unit.
- The total size of the range unit that the key area represents should be greater than five acres.
- Avoid livestock and wildlife congregation and travel areas (i.e., roads, fences, supplementation sites, and watering locations).
- Slopes should be less than 15%.
- Key areas should be 1/4 to 1 mile from watering locations.
When To Monitor
- In autumn at the conclusion of the growing season to estimate forage production and document grazing management outcomes.
- Repeat annually during same time period to create a baseline to estimate long-term trends.
- Additionally, at any time of the year to make adaptive or short-term management decisions.
How To Collect Monitoring Data
1. Mark the transect starting point with a T-post (or something similar; Figure 1) and record the location coordinates on a datasheet (see Appendix A) using a global positioning system (GPS).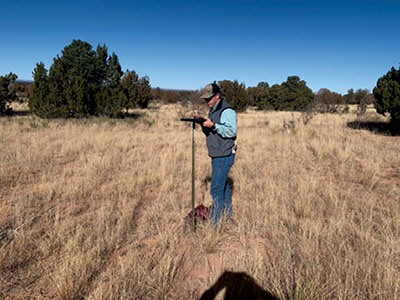
Figure 1. Marking the transect starting point with a T-post and recording GPS coordinates.
2. Record the cardinal direction or compass heading of the transect (i.e., the direction you will be walking) on a datasheet.
3. Record information that provides distinct monitoring identity on a datasheet.
a. Ranch or allotment name
b. Pasture name
c. Date (including year)
d. Transect number
4. Take photo-points (Figures 2 and 3).
a. Use a whiteboard to display specific information (e.g., date, pasture, transect number, heading, etc.)
b. Take a landscape photo (with whiteboard) in the direction of the transect. Include a landmark (e.g., rock, hill, or outcrop) in the photo so the same photo location can be used each year.
c. Take a ground-level photo on the transect at least 10 feet from starting point (with whiteboard and ruler).
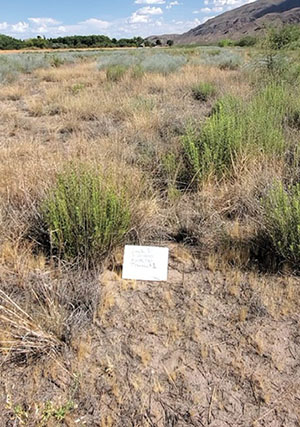
Figure 2. A landscape photo-point taken in the direction of the transect.
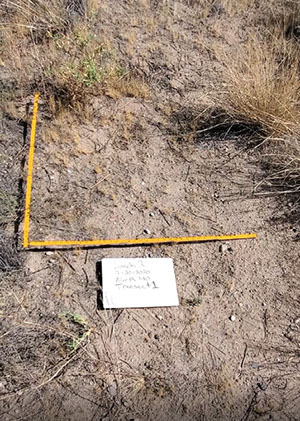
Figure 3. A ground-level photo-point.
5. Mark the point of preferred boot for the step-point transect assessment (Figures 4 and 5).
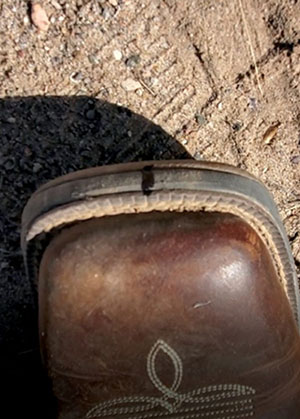
Figure 4. Marked boot tip for determining step-point transect measurements.
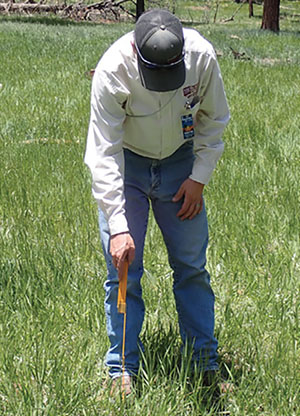
Figure 5. Step-point transect; taking a measurement point from the mark on the boot tip.
6. Record monitoring data (Figure 6) at every pace (i.e., two steps; usually about 5 feet in distance) as determined by the fall of the marked boot tip (also called a “hit” point). Repeat for 100 points. Do not look down when pacing to avoid selection bias.
a. Record ground cover classification at each hit.
i. V for vegetation
ii. L for litter
iii. R for rock
iv. B for bare ground/soil
b. Record plant species by common name or abbreviation.
i. For a grass vegetation hit, record grass species.
ii. For a non-vegetation hit, record nearest grass species.
iii. For a non-grass vegetation hit, record non-grass species and nearest grass species.
c. Record stubble height of grass species (Figure 7).
i. Using a ruler, measure the vertical leaf length from the stem base to the nearest 1/2 inch of average leaf length of the majority of leaf blades. For plants less than 2 inches, record length to the nearest 1/4 inch.
d. Collect a standing crop sample at every 20th hit for five total samples (Figure 8).
i. After recording data (Steps 6a–6c), place a sampling hoop (or quadrant) at tip of boot.
ii. Clip all livestock forage (i.e., grass) within the hoop to ground level.
iii. Place clipped forage in a labeled sampling bag (include date, pasture, transect, and sample number).
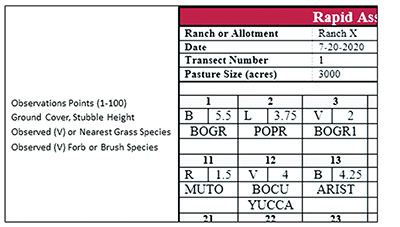
Figure 6. Sample data sheet demonstrating the placement (clockwise from upper left of each observation point cell group) of ground cover type, stubble height, and nearest plant species. For example, point 12 was a yucca (YUCCA) basal vegetation hit (V), and sideoats grama (BOCU) was the nearest forage plant for which a stubble height measurement (4 inches) was taken.
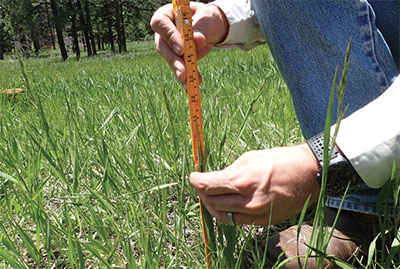
Figure 7. Measuring stubble height by extending leaves vertically.
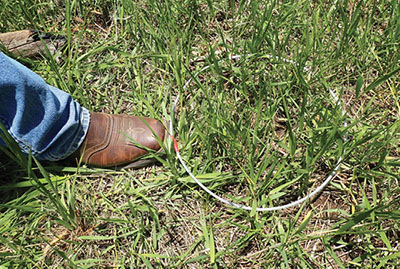
Figure 8. Placed standing crop sampling hoop (0.96 ft2 in area) for forage collection.
7. Walk back to the transect starting point while recording animal fecal droppings/pellet groups (dot tally) using a 6-foot belt transect approach (i.e., 3 feet on either side of transect); remove, destroy, or mark pellets with spray paint so as not to re-sample in subsequent monitoring events.
8. Dig a 12-inch soil pit adjacent to the transect starting point and record depth of soil moisture in inches (Figure 9).
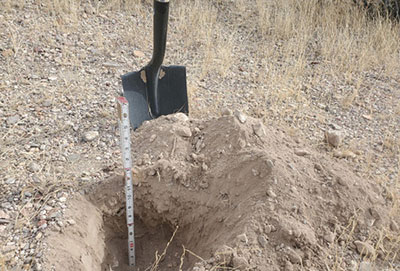
Figure 9. Twelve-inch soil pit to assess soil moisture depth.
9. Sample a minimum of three grazing exclusion cages (Figure 10).
a. Place sampling hoop in the center of each cage.
b. Clip all grass forage within the hoop to the plant crown and place in a labeled sampling bag.
c. Move cage at least 30 feet from current location for subsequent sampling year.
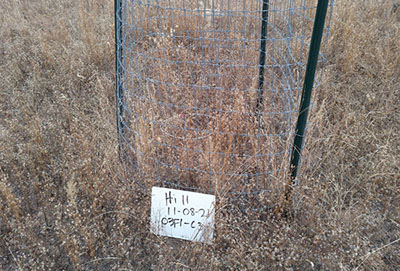
Figure 10. Grazing exclusion cage (10.75 ft2 in area) with sampling hoop placed in the center for forage collection.
10. Dry the standing crop and exclusion cage forage samples.
a. Use a low temperature (less than 140°F) drying oven and dry the bags for 24 hours.
b. Alternatively, place bags on a vehicle dashboard in direct sunlight (Figure 11) until forage is completely dry (~48 hours).
c. Determine the forage sample weight by weighing the sample plus the bag (Figure 12), then subtracting the bag’s weight; record the sample weight in grams for each clipping or sample.
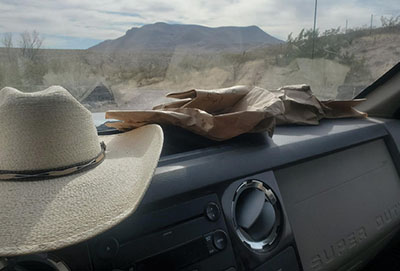
Figure 11. Drying forage samples on a vehicle dashboard in direct sunlight.
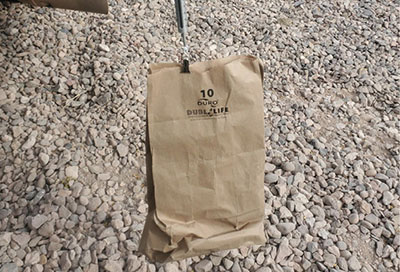
Figure 12. Weighing forage sample in grams with bag.
11. Find the conversion factor (Table 1) for your sample hoop or quadrant size used to convert grams of collected sample to pounds of forage per acre; record the conversion factor on the datasheet.
a. To estimate standing crop from dried forage samples, add all transect samples together (if not already combined) and divide by five. The same is done for exclusion cage samples, but dividing by three. Multiply the resulting quotient by the appropriate conversion factor (Table 1; e.g., for a sampling hoop with an area of 0.96 ft2, the conversion factor is 100).
b. Alternatively, you may contact NMSU’s Extension Range Management Specialist for calculations and interpretation of the collected information.
|
Table 1. Range Sampling Conversion Factors for Circular and Square (Quadrant) Dimensions to Determine Pounds of Forage Per Acre (reported in Pratt and Rasmussen, 2001). |
||||
|
Plot Size (area) |
Conversion Factor |
Hoop Radius |
Hoop |
Square (Quadrant) |
|
0.96 ft2 |
grams × 100 |
0.55 ft |
3.5 ft |
0.98 × 0.98 ft |
|
1.92 ft2 |
grams × 50 |
0.78 ft |
4.9 ft |
1.39 × 1.39 ft |
|
2.40 ft2 |
grams × 40 |
0.87 ft |
5.5 ft |
1.55 × 1.55 ft |
|
4.80 ft2 |
grams × 20 |
1.24 ft |
7.8 ft |
2.19 × 2.19 ft |
Appendix A—Rapid Assessment Methodology (RAM) Datasheet
Download Microsoft Word format
Literature Cited
Allison, C.D., J.L. Holechek, T.T. Baker, J.C. Boren, N.K. Ashcroft, and J.M. Fowler. 2007. Rapid assessment methodology for proactive rangeland management. Rangelands, 29(2), 45–50.
Pratt, M., and G.A. Rasmussen. 2001, May. Calculating available forage. Utah State University Extension. Available at https://digitalcommons.usu.edu/cgi/viewcontent.cgi?article=1991&context=extension_histall
For Further Reading
RITF-85: An Introduction to NEPA: The National Environmental Policy Act of 1969
https://pubs.nmsu.edu/_ritf/RITF85/index.html
RITF-83: Wilderness Designation and Livestock Grazing: The Gila Example
https://pubs.nmsu.edu/_ritf/RITF83.pdf
RITF-82: Elk and Livestock in New Mexico: Issues and Conflicts on Private and Public Lands
https://pubs.nmsu.edu/_ritf/RITF82.pdf
Casey Spackman is an Assistant Professor and Extension Range Management Specialist at New Mexico State University. He earned his Ph.D. at Utah State University. His Extension efforts aim to assist producers, land managers, and agency personnel in monitoring and developing management objectives that maintain or improve natural resource health and sustainability.
To find more resources for your business, home, or family, visit the College of Agricultural, Consumer and Environmental Sciences on the World Wide Web at pubs.nmsu.edu
Contents of publications may be freely reproduced for educational purposes. All other rights reserved. For permission to use publications for other purposes, contact pubs@nmsu.edu or the authors listed on the publication.
New Mexico State University is an equal opportunity/affirmative action employer and educator. NMSU and the U.S. Department of Agriculture cooperating.
November 2022 Las Cruces, NM