Basic Research on the Use of Polarization to Sort Chile Peppers1,2
New Mexico Chile Task Force Report 17
By Michael DeAntonio, Ryan Herbon and Jeff Montgomery
College of Agriculture, Consumer and Environmental Sciences, New Mexico State University
Authors: Respectively, Assistant professor, Department of Physics, agricultural engineer, M-TEC, and undergraduate student, Department of Physics, respectively, all at New Mexico State University, Las Cruces.
Introduction
The increase in foreign competition for New Mexico chile farmers has prompted New Mexico Chile Task Force and New Mexico State University (NMSU) engineers to investigate new methods for sorting machine-harvested chile. The goal is to increase chile industry profitability by reducing labor costs associated with hand sorting and to improve efficiency by reducing dependence on scarce hand labor. In addition to developing mechanical methods to sort chiles, NMSU engineers have investigated a color sorter that relies on the differences in color between harvested chile pods and unwanted material. Unfortunately, the color sorter can be used only for red chile crops because green chile pods and chile plants are nearly the same color. Even in red chile crops, the pods and plants have similar coloration after frost, making color sorting problematic. While refinements in color sorting and subsequent analysis could solve this problem, another possible solution is use of polarization, which does not rely on chiles’ color, shape or size characteristics.
A polarization sorter would rely on reflective properties of the objects to be sorted. Initial measurements indicate that the specular reflection produced by a chile pod’s surface does not change significantly throughout the season. Thus, a polarization sorter may be able to sort a green or post-frost red chile harvest as accurately as it could sort pre-frost red chile.
The polarization sorter concept
Light is a transverse wave. Its oscillation direction is perpendicular to its path of motion (fig. 1). When light strikes a surface, some of it is transmitted, some is absorbed and some is reflected. When it is reflected off relatively smooth surfaces, light is partially polarized so that all of the light is oscillating in nearly the same direction. This light is said to be reflected specularly. At an incident angle specific to the reflecting surface, called the Brewster’s angle, the specularly reflected light is polarized completely. Polarized light can be filtered out easily by transmitting it through a polarized filter that is turned to allow only light of the opposite polarization to pass (fig. 2).
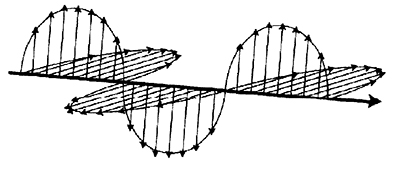
Figure 1. Unpolarized light oscillating in both transverse directions.
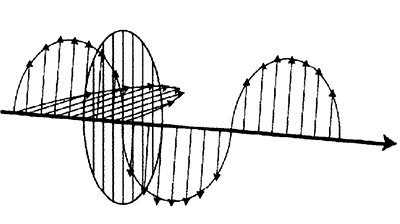
Figure 2. A polarizer can be used to block one component, and thus polarize the light wave.
In contrast, some surfaces do not reflect light well, or they diffusely reflect the light. A rough surface causes multidirectional faces to reflect the light with many polarizations in many different directions. The light reflecting from rough surfaces cannot be filtered out with a polarizer.
Chile pods (and many other fruits, such as tomatoes and apples) tend to be very smooth and highly reflective throughout the season. Chile stems and leaves are much rougher, especially late in the season. A polarization sorter would operate on the concept that the light reflected specularly from chile pods at a certain angle (or a range of angles around the Brewster’s angle) is easy to filter out, while that reflected off the diffusely reflecting sticks and leaves is not.
In the polarization sorter conceptualized by NMSU researchers (fig. 3), chile pods are flooded with bright light in a way that the angle between the incident light and the reflected light is approximately twice the Brewster’s angle. (Both the incident and reflected angles are at the Brewster’s angle.) The reflected light is split, and each beam is viewed through two different polarizers. One polarizer is set so that its polarization angle is parallel to a chile pod surface, enabling all of the polarized light reflected from the chile to pass through the filter. The other is oriented perpendicularly to the chile pod surface, so that a minimum amount of light reflected from the pod passes through it.
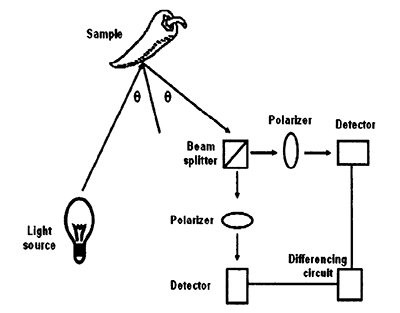
Figure 3. Flow diagram of a polarizing sorter.
The light reflecting off a stick or leaf will pass through each polarizer with the same intensity, while the light from a chile will have a much higher intensity exiting the parallel polarizer. Two detectors are placed after each polarizer. The signal received through the perpendicular polarizer is subtracted from that received through the parallel polarizer. After thresholding to remove the small amount of polarized light reflected from the unwanted material, a signal exists only when a chile pod is in the detectors’ fields of interest.
Research
To verify a polarization sorter’s usefulness throughout an entire harvest season (green through dry red), we first measured the Brewster’s angle throughout the season to determine whether it changed as plant characteristics changed and, if so, how much. This data would allow a machine to be adjusted throughout the season for optimal efficiency. Second, we determined the threshold level required to completely filter out the unwanted material.
To determine the Brewster’s angle, we built three generations of a measuring device, each improving on the accuracy of its predecessor. We measured the angle at which a polarizer could minimize the amount of reflected light from a chile pod’s surface. At this early research stage, the measurements appeared to show that the Brewster’s angle does not change drastically throughout the season.
To find the threshold level, we again built three successively more sophisticated devices. These devices were designed to take nearly identical photographs of chile pods and sticks through a rotating polarizer. To measure the threshold, the pictures had to be identical in all respects, except for the viewing polarizer’s angle. The threshold was found by using a software program written for this project. The required threshold was recorded for each picture set. While data on the best threshold level are inconclusive, there appears to be a significant threshold gap between chile pods and stems.
Brewster’s angle measurements
The first device designed to measure Brewster’s angles was developed quite rapidly and had many shortcomings. Only six intensity-versus-angle measurements were taken and no direct Brewster’s angle measurements were made. This device was intended to infer the Brewster’s angle from the minimum of the curve.
To build this device, we disassembled a General Electric spectrometer base, model BR type 1, and modified it to allow for measurements at different angles. We removed the sample holder, slit device and viewing device holder and taped a Pasco light onto the movable arm. We designed a cardboard polarizer holder to hold the polarizer and collector for a Pasco/CDL Relative Intensity (RI) Meter, model 8020. We constructed a non-reflective cardboard sample holder with a 1-in.2 sample surface and placed it in the center of the spectrometer base. Samples were obtained from a bag of dried red chile pods from the previous season’s harvest.
Pod preparation included the following:
- The pods were soaked in hot, near-boiling water for 15-20 minutes, until soft.
- Sections of pods were flattened, cut into1-in.2 pieces and dried overnight.
- The squares were glued with Elmer’s wood glue to 1-in.2 pieces of paper, and the glue was allowed to dry overnight.
- The samples’ backs were labeled with a ballpoint pen
To obtain measurements, the following steps were taken:
- A sample was placed on the sample holder with Handi-Tak clay.
- All lights in the room were turned off.
- The spectrometer base was set at 70° (the visually estimated Brewster’s angle).
- The polarizer was rotated so that the RI meter gave a minimum reading. This placed the polarization at an angle perpendicular to the chile’s surface.
- The spectrometer base was reset to 40°.
- RI was recorded every five degrees until the Brewster’s angle was found (when the RI began to increase) or until 90° was reached. This ensured a full curve, as the Brewster’s angle is guaranteed to be acute.
- The data were plotted and a minimum on the curve was determined (fig. 4).
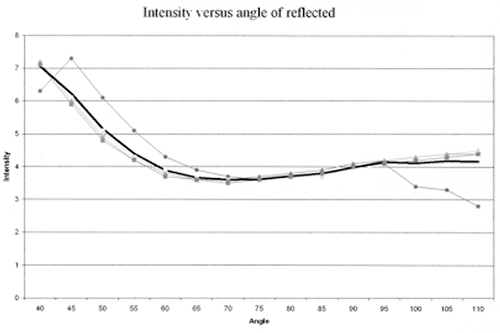
Figure 4. Initial Brewster’s angle measurement of a single red chile sample. (The thin curves are individual measurements of a single sample, while the thick curve is the average of all four measurements. This measurement demonstrates that the Brewster’s angle is in the 45°- 90° range.)
Many difficulties were encountered during the initial device’s testing, mostly involving sample preparation and source lighting. The chile samples tested were very dry. We thought that a flat surface was necessary to accurately determine the Brewster’s angle, so the chiles were flattened before measurements were taken. Samples were cut to identical sizes so that a comparison of the various chile pod reflectivity values could be made. We found both flattening and sizing unnecessary. The chile pod surfaces were smooth enough to determine the Brewster’s angle simply by measuring the minimum intensity of the light passing through the RI meter, just as with the flat chile pods. In the case of the cut chile surface, we found that the width of the intensity-versus-angle measurement might be smaller, but the Brewster’s angle occurred at approximately the same angle. The Brewster’s angle may vary slightly at different points on the chile pod. In this case, considering only small parts of each chile, rather than the entire pod, biased the measurement. In addition, we suspected that the pod preparation process itself might change the chiles’ optical properties. Later measurements showed that soaking the pods did not appear to change the pods’ reflectivity significantly. However, the measured Brewster’s angles (curve minimums) for the prepared chiles were much higher than for unprepared chiles.
Source lighting also presented problems in this initial experiment. First, light directly from the source that had not reflected off the pod entered the collector at low angles. This gave us an asymmetric curve, with low angles receiving a much higher intensity than high angles. In addition, light reflecting off the chile pod was barely bright enough to be detected by the photometer. The photometer’s highest setting was used to obtain measurements. At this level, the photometer’s signal-to-noise ratio was too high to obtain a precise reading. Second, light reflected specularly from surrounding metal equipment with a very high intensity relative to the pods. It reflected back onto the chile pods or directly into the collector, giving a much higher background for the measurement and obscuring the Brewster’s angle measurement. Third, it was impossible to achieve total darkness in the laboratory, despite pasting paper over the window in the lab door. This compounded the photometer sensitivity and polarized reflections problems. Lastly, determining a minimum for the obtained curves was difficult because the resolution of the measurement was too low. Thus, determining a precise Brewster’s angle was difficult.
The second device built to measure Brewster’s angles was much improved in principle, but was not operable. Immediately after the first measurements were made, the light source ceased to function. We replaced it with a small handheld MAGLITE AAA flashlight and constructed a small holder for it. On this model, we constructed more sturdy mounts (RI collector holder, light shield and sample holder). We built a more easily rotated polarizer holder and attached it to the new RI collector holder, allowing minimum RI to be found more easily in the Brewster’s angle measurements.
There were many difficulties associated with this device. The flashlight used as a light source was even dimmer than the initial source and was not bright enough for our purpose. The RI meter was set on its highest sensitivity during each measurement, thus background fluctuations heavily influenced measurements. Also, the flashlight’s brightness fluctuated far more than the previous source, making precise measurements even more difficult, as the measured RI fluctuated significantly over a period of seconds.
In spite of precautions taken to minimize them, reflections from other equipment in the room were still a problem. This was exacerbated when coupled with the heightened sensitivity of the RI meter.
The 1-in.2 samples constructed for the first device posed an even greater problem with this device. The small surface reflected very little light back to the collector, and the signal into the RI meter was too small to measure accurately.
The third, and final, device built to measure Brewster’s angles corrected most problems associated with the initial two devices, and the procedure was refined somewhat to match the new equipment. This device gave a precise reading of the light intensity reflected from a whole chile pod. It was set up in a new laboratory that had the advantage of complete darkness. Both intensity-versus-angle measurements and direct Brewster’s angle measurements were taken. In addition, measurements were made every degree rather than every five degrees.
The MAGLITE AAA was replaced with a Dyonics snake light, model 375A. This light source was bright and constant enough to overcome the residual background reflections. The sample holder was redesigned to hold an entire chile pod by its stem. The polarizer and collector holder also were redesigned and rebuilt for better shielding and easier polarizer rotation. The collimator was removed because the snake light sent out a nearly collimated beam by itself.
To obtain intensity-versus-angle measurements, the following steps were taken:
- The snake light was turned on and given one hour to warm up. Immediately after being turned on, the light is unstable, but after one hour the intensity stabilized.
- A chile pod was fit into the sample holder. The holder was designed to hold chiles of various sizes, but some highly curved pods were trimmed to fit the holder’s vertical dimension.
- The spectrometer base was set at 60° (Brewster’s angle as determined by the previous device). The polarizer was turned until a minimum intensity reading was given on the RI meter.
- A direct measurement of the Brewster’s angle was taken, and the RI meter was set so that the intensity at this angle was 66% (normalization).
- Measurements were made every 1° for each pod.
- The pod was rotated 90° in its holder, and steps 4 and 5 were repeated. Four intensity-versus-angle measurements were made for each pod.
To obtain direct Brewster’s angle measurements, the following steps were taken:
- The snake light was turned on at least one hour before taking measurements.
- A chile pod was fit into the sample holder.
- The spectrometer base was set at 60° (the Brewster’s angle determined by the previous device), and the polarizer was turned until a minimum intensity reading was given on the RI meter.
- A direct measurement of the Brewster’s angle was taken and recorded.
- The RI meter was set so that the intensity at this angle is 90% (normalization).
- The spectrometer base angle was turned left and right until 100% RI was reached. The maximum change in angle required to obtain 100% RI was recorded.
- Data were plotted and Brewster’s angles determined (figs. 5 and 6).
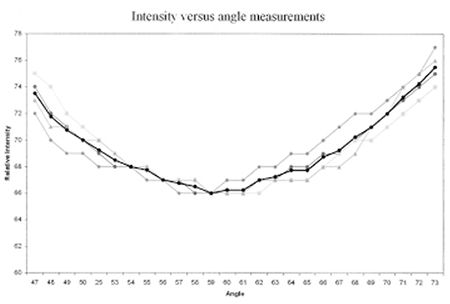
Figure 5: Final Brewster’s angle measurement of a single red chile pod. (The thin, light curves are individual measurements, while the heavy, dark curve is the average of each. The curve has a definite Brewster’s angle of 59°, with an error of about 2°.)
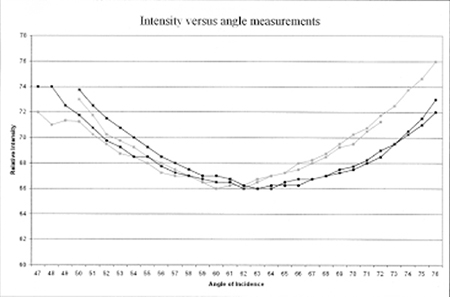
Figure 6. Final Brewster’s angle measurement of four chile pods of differing colors. (Each line is the average of four individual measurements for a single sample. The dark curves are measurements for green pods, while the light curves are measurements for red pods. The minimum is between 58° and 66°.)
Despite many improvements made during the three generations of device development, acquiring data was still time consuming because the angles were changed mechanically. A stepper motor exists inside the spectrometer base, but needs a stepper motor controller to function. To use this device, a chart recorder capable of accepting the analog signal from the RI meter must be found. With these improvements, the time needed to take a measurement could be drastically reduced.
The snake light used was much brighter and more stable than initial light sources, but fluctuated noticeably even with a considerable warm-up time. In addition, the RI meter gave less stable readings at higher resolution intensity settings. To make any measurements, the RI meter had to be configured at its highest setting. A much brighter light source, coupled with adequate shielding, would decrease the signal-to-noise ratio significantly and thus increase measurement precision.
Threshold measurements
The first device developed to obtain threshold measurements consisted of a Kodak EasyShare CX4230 digital camera secured to a table with clear tape. In its field of view, a single chile pod was taped onto a piece of scrap 2 x 4 lumber. A small Pasco light was placed off axis at approximately 130°, directly illuminating the pod. Between the sample and the camera, a Newport RSP-1T rotating polarizer holder and polarizer (#16579) with marked angles of rotation was placed on a stand and secured to the optical table.
To obtain the images, the following steps were taken:
- A chile sample was taped to the wooden background.
- The light source was turned on, and the chile was viewed through the camera view screen.
- The polarizer was rotated until the observed specular reflections were minimized. This angle was noted and recorded. (This is the angle at which the polarizer is perpendicular to polarization of the reflected light.)
- The polarizer was rotated until the observed specular reflections were maximized. This angle was noted and used for each collection of pictures. (This is the angle at which the polarizer is parallel to the reflecting surface.)
- The polarizer was rotated back to its perpendicular setting and a picture taken.
- The polarizer was then rotated to its parallel setting and another picture taken.
- This procedure was repeated several times for each sample chile pod, to show that the pictures were properly registered.
The calculation used to obtain the threshold values is very simple. The Adobe Photoshop program was used initially to subtract the images. Later the Physics Chile Subtraction program, designed by Ryan Herbon, was used to perform the same subtractions to ensure that all data were obtained consistently. This software program subtracted each picture, pixel by pixel, using RGB values (the program subtracted the red value from the red value, the green from the green and the blue from the blue). The program then converted the color values to HSL (hue, saturation, luminosity) values, and took the threshold of the luminosity value only. Hence, both the subtraction and the threshold were full-color calculations.
To calculate threshold measurements, the following steps were taken:
- The pictures were downloaded onto a computer.
- The pictures were shrunk to the size necessary for the image subtraction.
- The pictures were subtracted and the subtracted images were saved in a separate folder with a name identical to the original image.
- With the Physics Chile Subtraction program, the threshold level was increased until only the chile pod remained in the image. This threshold level was recorded.
- The threshold level was increased until the image was completely lost. This threshold level was recorded.
The light source for this initial setup proved too dim to obtain visible subtracted images, and the parallel and perpendicular polarization pictures were visually indistinguishable from each other. Many photographs taken were not registered correctly because the camera position shifted.
Only four samples were successfully photographed with this device. In these samples, the mean threshold needed to remove the sticks from the image was 13, with a standard deviation of 1, a minimum of 12 and a maximum of 14. The mean threshold needed to remove the entire pod was 26, with a standard deviation of 14, a minimum of 16 and a maximum of 51. The threshold of 51 was obtained in a photo set in which the first photo was taken with the room lights on, which explains why the threshold required to completely eliminate the image is so high. Even so, the threshold required to remove the chile from the image was always higher than the threshold required to completely remove the stem. In these samples, a minimum threshold of 114 would remove every piece of unwanted material, leaving part of every pod.
Many difficulties were encountered during use of this camera setup. First, the light source was far too dim to obtain useful pictures. The threshold required to remove the entire chile from the picture was at most 51 with the room lights on, while the amount of threshold needed to remove the sticks was far too small. Second, the experiment was hampered by an unstable camera. As the camera shifted between snapshots, the images were not registered and the subtracted images could not be analyzed using threshold. The differences between the two images, due to the camera shift, were usually far greater than the differences due to the polarization. Next, as in the Brewster’s angle measurements, polarized light reflected off polarizing materials in the laboratory causing most of the initial picture sets to have a substantial overall difference. Pods, stems and background were all visible in the subtraction, and threshold was insufficient to remove the unwanted material. Last, the initial wooden background had a noticeable polarizing effect. This made subtracting out the background images very difficult.
The second setup was much more effective than the first. It employed a new camera, light source and better mounting technique. The Kodak camera was replaced with a Canon PowerShot A60 digital camera, which has a threaded 1/4-in. mounting slot on the bottom. This allows the camera to be mounted using standard optical mounting equipment, greatly reducing image shifting from mount instability. The Newport rotating polarizer holder and polarizer were replaced with a large glass polarizer and clamp base (unknown make and model). The polarizer was clamped into the base and fastened to the optics table directly in front of the camera lens. The light source was replaced with the Dyonics snake light model 375A, which proved to be a very good light source for photography. Finally, a cardboard box was modified to be a chile holder. Holes were cut into the top so that a chile could be hung by its stem from the top of the box. In this way, all background was eliminated, as would be the case on an actual polarizing machine, which would sort chiles as they fell through space.
The snake light was allowed to warm up for an hour before any pictures were taken. The chile was hung by its stem inside the sample holder. The remaining procedure was the same as for the previous setup.
Eleven samples were photographed during the beginning of the chile harvest season. In these samples, the mean threshold needed to remove the sticks from the image was 65, with a standard deviation of 19, a minimum of 30 and a maximum of 96. The mean threshold needed to remove the entire pod was 103, with a standard deviation of 27, a minimum of 62 and a maximum of 131.
In these samples, there was no minimum threshold that removed every stick without removing pods. However, a threshold level of 79 would allow only two sets of unwanted material, and would reject only two chile pods. A threshold level of 96 would remove 5 of 11 chile pods. The amount of threshold required to completely remove the image seemed to be proportional to the size of each sample.
While the second generation device was a clear improvement over its predecessor, several problems emerged during testing. Freshly picked chile plants dry out very quickly. While the polarization properties of the pods and stems do not appear to change due to humidity, the stems and leaves become noticeably less reflective upon drying. Hence, many of the pictures required a much lower threshold to remove all stems and leaves than would be the case during a fresh harvest. Reflective surfaces in the lab also remained a problem. Although many were identified and covered, a few remained. Even small, uncovered parts of the optics table far away from the experiment were significant reflection sources. Although camera instability was greatly reduced, there were still noticeable differences between images, showing up as edge lines in most of the subtraction pictures.
For the final camera setup, steps were taken to completely stabilize the camera mount, eliminate every reflecting surface in the lab and improve the quality of the chile samples and the sample mounting technique. To stabilize the polarizer, the Newport rotating polarizer holder and polarizer (used in the initial setup) were recovered and fixed to a post on a magnetic base. To stabilize the camera, a steel camera mount was constructed from 4-in. by 6-in. steel square piping, cut 6-in. long. Four 1/4-in. holes were drilled in the bottom and two possible camera mount holes were drilled in the top. The mount was secured to the table with four 1/4-in. optical screws, and the camera was secured to the top of the mount with a single 1/4-in. optical screw and washers. The rotating polarizer was fixed to a 3-in. optical post, inserted into a Newport standard 1/2-in. optical base, fixed to a Newport magnetic base. This device was placed so that the polarizer itself was less than 1 mm from the camera lens, and the magnetic mount on the base was lowered. The chile pods were mounted on a rotating background with Handi-Tak clay. The rotating background was a cardboard box, covered with white paper, affixed to the table with a 1/4-in. optical screw. The pods were mounted to a sheet of paper, and the paper was mounted on the background. The entire metal optics table was covered with white paper to eliminate polarized reflections. In addition to photographs of chile pods and chile pods with sticks, images of sticks only were captured, and the threshold required to remove a stick from the picture was found.
The following steps were taken to acquire the images:
- The snake light was given an hour to stabilize.
- Each sample, or set of samples, was mounted on a piece of white paper with Handi-Tak clay.
- The paper was mounted on the rotating background with Handi-Tak clay.
- The camera was aimed at the center of the background.
- The background was rotated until its normal made a 60° angle with the camera axis.
- The angle of reflection was measured and drawn on the table.
- The light source was placed along this line.
- The polarizer was rotated until the observed specular reflections were minimized. This angle was noted and used throughout the collection of pictures (perpendicular setting).
- The polarizer was rotated until the observed specular reflections were maximized. This angle was noted and used throughout each collection of pictures (parallel setting).
- The polarizer was rotated to its perpendicular setting and a picture taken.
- The polarizer was rotated to its parallel setting and another picture taken.
- This procedure was repeated several times for each sample chile pod, in an attempt to ensure registration of the pictures.
The image subtraction and threshold measurements procedure was the same as for the initial setup.
In this phase of research, 18 pods were photographed. The mean threshold needed to remove the sticks from the pictures completely was 85, with a standard deviation of 14, a minimum of 46 and a maximum of 107. The mean threshold needed to remove the entire chile was 148 with a standard deviation of 16.5, minimum of 121 and a maximum of 187.
In addition to pods, individual pictures of the sticks were taken and the threshold technique applied. The mean threshold from the sample of 21 sticks was 78, with a standard deviation of 16, which agrees with the required threshold needed to remove the sticks from pictures with pods. From these numbers it appears that, with the light source used, a threshold of 110 will remove every stick from every picture, and no chile will be eliminated completely.
While this third generation device for subtracting and measuring thresholds eliminated most of the problems associated with its predecessors, some difficulty was still experienced related to sample freshness. We found that if samples were not analyzed as soon as they were picked, the sticks dried out and the difference between reflectivity of the pods and the other material was much greater. To obtain an accurate threshold measurement, fresh chile must be analyzed. Image processing time also proved to be a constraint. After the photographs are taken, they must be resized individually, loaded and subtracted with the Physics Chile Subtraction program. This is a time consuming, repetitive process that could be automated with an upgraded subtraction program.
Conclusions
This research project developed the method for measuring the Brewster’s angle and necessary threshold levels. A season-long study of Brewster’s angle and threshold levels is needed before a prototype polarization sorter can be built to test suitability for sorting chile pods from trash. This study could be done concurrent with prototype construction, if the incident angle of the prototype illumination mechanism is designed to be adjustable. Refitting the spectrometer base with a stepper motor controller will enable fast intensity-versus-angle measurements, and integrating a bright, stable, variable-height, collimated light source into the intensity-versus-angle measurement device and photography apparatus will improve threshold measurement accuracy. Enough threshold data should be taken to determine the distributions of thresholds needed to remove a chile pod and the sticks and unwanted material.
If a prototype polarization sorter were integrated with a color sorter, through which harvested material travels on a conveyor belt, a row light source should be used to illuminate the entire belt. The light source could be placed (fig. 7) before the polarization sorter. However, the belt material may polarize the light reflecting from it. In this case, the region of interest would be moved simply by rotating the polarization sorter/light source setup while keeping the relative angle between them (with respect to the belt surface) constant. This relative angle should be adjustable, allowing for the measurement of the Brewster’s angle in parallel with the construction of the polarization sorter. A filter will be needed to block light reflected from chiles not being measured by each detector. Each detector must only detect chiles in its own region of interest. Instead of splitting the beam, a possible detection scheme might be to cover two collectors with polarizers, one aligned perpendicularly and one parallel to the belt surface. These collectors should be placed very close together and a small registration calculation performed on the signal from each. The signals would then be subtracted and the threshold determined. Redundant detectors should be placed for each separate field of interest to increase accuracy. All data from this research show that the polarization concept for sorting machine harvested chile from unwanted material merits further investigation. The next step in developing a polarization sorting mechanism would be to incorporate these research findings into the development of an industrial-scale prototype for further testing and refinement.
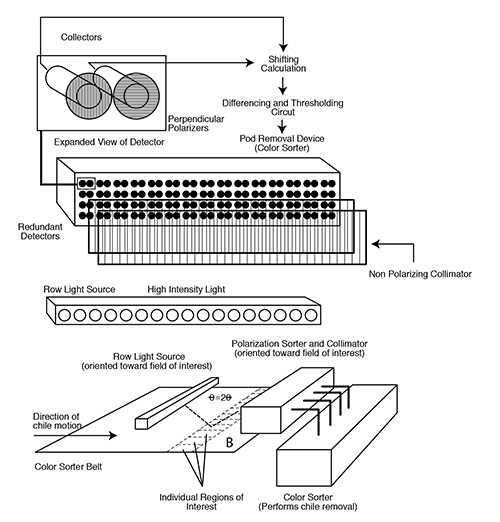
Figure 7. Prototype chile polarization sorter. The detector is shown above, with an expanded view of a single collector. The row light source is shown in the middle. On the bottom is a possible orientation of the light source and polarization sorter, integrated into the current color sorter machine.
Footnotes:
1The authors thank the New Mexico Chile Task Force for funding this project. We also thank the NMSU Departments of Physics and Electrical and Computer Engineering and the Manufacturing Technology and Engineering Center (M-TEC) for their aid in completing this project.
2 This paper was reviewed by Chris Wilson, senior member, Technical Staff, Intelligent Systems and Robotics Center, Sandia National Laboratories, Albuquerque, NM; and Erin M. Silva, assistant professor, and Stephanie Walker, Extension vegetable specialist, both with the Department of Agronomy and Horticulture, New Mexico State University, Las Cruces.
For Further Reading
CTF-26: Good Agricultural Practices: What Growers Should Know
https://pubs.nmsu.edu/research/horticulture/CTF26/index.html
CTF-27: Red Chile Pod Reclaimer Evaluations
https://pubs.nmsu.edu/research/horticulture/CTF27/index.html
CTF-28: Chile Machine Harvesting Trials
https://pubs.nmsu.edu/research/horticulture/CTF28/index.html
To find more resources for your business, home, or family, visit the College of Agricultural, Consumer and Environmental Sciences on the World Wide Web at aces.nmsu.edu
Contents of publications may be freely reproduced for educational purposes. All other rights reserved. For permission to use publications for other purposes, contact pubs@nmsu.edu or the authors listed on the publication.
New Mexico State University is an equal opportunity/affirmative action employer and educator. NMSU and the U.S. Department of Agriculture cooperating.
December 2004, Las Cruces, NM