Research Report 790
Jay M. Lillywhite, Jennifer E. Simonsen, and Rhonda Skaggs
College of Agricultural, Consumer and Environmental Sciences, New Mexico State University
Authors: Respectively, Professor (575-646-5321, lillywhi@nmsu.edu), Former Senior Research Specialist, and Professor Emerita, Department of Agricultural Economics and Agricultural Business, New Mexico State University. (Print friendly PDF)
Introduction
The maturity and saturation of some U.S. food market segments are driving food industry efforts to differentiate products in order to gain or increase market shares. Food chain participants inform consumers about attributes that are unique to their product or service with the desire that increased awareness leads to increased sales and profits. These attributes may be intrinsic, such as shape or size (Stefani et al., 2005), or extrinsic—that is “related to the product, but are physically not part of it”—such as region of origin (Steenkamp, 1990, p. 313). Agricultural products grown or produced in a specific region may include tangible or intangible attributes that add value to the product in the eyes of consumers.
Incorporating production region identification and differentiation attributes has been used as a marketing strategy in a number of food industries, such as the wine, cheese, apple, and onion industries. Information about a food’s production region can convey cues about its quality (Stefani et al., 2005), safety (Becker, 2000; Loureiro and Umberger, 2003), or flavor (Kemp, 2012). Production region certifications with accompanying certification marks can facilitate the transfer of credible region of production information to consumers in a cost-effective manner, reducing consumer search costs.
Indeed, a belief that value is created via region of production (ROP) labeling and certification has likely contributed to the number of regional brands observed within the food industry. In the United States, regional branding often occurs through state and federal fruit and vegetable marketing orders or under the auspices of state departments of agriculture. Efforts to defend and protect established regional product identities have been aggressive and successful in Europe (e.g., Parma ham and Champagne). Previous market research has explored consumer preferences for ROP-identified food products and the degree to which consumers living in and outside of a brand-name region respond to regional branding. Although it has been noted that “consumers might not care where their food comes from” (Krissoff et al., 2004, p. 6), a segment of consumers appears willing to pay a premium for some food products labeled with production region information (e.g., Loureiro and Umberger, 2003; Menapace et al., 2011).
Premiums can vary, however, depending on the food product in question. For example, between 1992 and 2000, Vidalia onions commanded $0.02 to $0.20 per pound retail premiums over other onions (Boyhan and Torrance, 2001, as cited in Carter et al., 2006). Texas Ruby Red grapefruit have sold at a premium over other grapefruit available in the U.S. market (Major, 2004, as cited in Carter et al., 2006). Pure (100%) Kona coffee retails for approximately nine times the average roasted coffee retail price (Teuber, 2010)1.Region of production labeling has also been shown to be of value to local vegetable consumers. Arizona residents were willing to pay higher prices for spinach and carrots labeled “Arizona Grown” (Nganje et al., 2011), and South Carolina residents were willing to pay a premium for “South Carolina grown” produce (Carpio and Isengildina-Massa, 2009). Batte et al. (2010) found that Ohio and Kentucky residents were willing to pay $0.34 more per jar for blackberry jam labeled as a “Product of the Appalachian region.” While much of the published research has documented within-region consumer willingness to pay higher prices for regionally branded local foods, the effect has also been found for some consumers living outside of branded regions (e.g., Teuber, 2010).
While studies have shown that ROP certification can be valuable for some agricultural commodities, there is no guarantee the benefits outweigh the costs of such certification. Moreover, a certification program that is financially viable may not generate sufficient revenue at the farm level to improve the industry’s viability. For example, the price premiums realized by Washington state apple certification have declined over time (Carter et al., 2006). Although the Florida Department of Citrus has created a “Made with Florida Citrus” certification mark to aid Florida growers, some Florida orange industry stakeholders “are finding it increasingly difficult to survive” (Perret and Thevenod-Mollet, 2010, p. 14). The difficulties faced by these farmers may be due in part to insufficient or eroding premiums associated with region of production marks. There is no research evidence to suggest, however, that the influence of ROP branding is waning for most food products.
For traditionally generic or commodity fruits and vegetables, an ROP certification may be less successful. U.S. markets for apples, apple juice, and orange juice are large, and demand for these products is relatively price- and income-inelastic (own price elasticity of -0.45, -0.79, and -0.15, respectively; Brown, 1986; Henneberry et al., 1999). These products are produced for the mass market, traded internationally, and are essentially commodities. Attempts to establish or maintain regional identities may be futile for large-market commodities for which ROP is a diluted attribute; that is, its impact could be reduced since blended products often include ingredients from multiple regions (e.g., apple and orange juice). In contrast, ROP branding for small, niche market specialty crops may present better opportunities for creating price premiums, building consumer awareness, and establishing consumer loyalty.
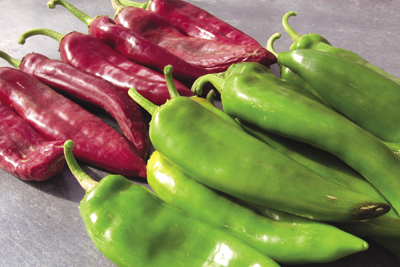
The New Mexico chile pepper is an example of a specialty crop that might benefit from an ROP certification program. The chile pepper (genus Capsicum) is a New World crop that has become identified with various Old and New World cuisines. Chile peppers are consumed in fresh and processed forms, with a variety of pepper sub-types, including green, jalapeño, cayenne, paprika, and simply red (Hall and Skaggs, 2003). The peppers are also dried, ground into powders, and used in sauces and seasonings. New Mexico is the historic heart of the U.S. chile pepper industry for both farm-level production and processing. New Mexico produced 43% of total U.S. chile pepper acreage in 2013 (although California topped New Mexico in chile pepper production value; NASS, 2014). New Mexico grows a greater variety of chile pepper types than any other state, and peppers are frequently used in logos or symbols representing New Mexico.
Although chile pepper production is a key component of crop rotations and supplies raw material to numerous U.S. food product manufacturers, chile pepper acreage in New Mexico declined 17% between 2000 and 2010 (NASS, 2012a). Chile pepper imports, primarily from Mexico, more than doubled during the same period as per capita consumption of chile continues to rise (ERS, 2012; Figure 1). A variety of factors have driven the growth in U.S. chile pepper imports and concurrent decreases in New Mexico production, including pest pressures, government regulations, urbanization, resource competition (e.g., land and water), rising domestic production costs, labor availability, and the increasingly global nature of agriculture (Diemer et al., 2002).
The New Mexico State Legislature recently responded to what was perceived as a signature industry in distress. The New Mexico Chile Advertising Act of 2011 makes it unlawful for a person to knowingly advertise, describe, label, or offer for sale a product as containing New Mexico chile unless the chile peppers or peppers contained in the product were grown in New Mexico (New Mexico Chile Advertising Act, NMSA § 25-11, 2011). In 2012, the New Mexico Chile Labeling Act established additional advertising requirements for New Mexico chile pepper products (New Mexico Chile Labeling Act, NMAC § 21-16-7, 2012). These defensive regulations are premised on the underlying notion that New Mexico chile peppers have value based on their origin and this value should not be undermined by counterfeit or non-New Mexico products. However, the laws apply only to chile sold or consumed in New Mexico and have no influence outside of the state.
New Mexico ROP certification has been proposed for chile peppers due to the pressures facing the state’s pepper industry and the economic impacts of reduced local farm-level production and processing. It is believed that the state’s pepper industry would be able to maintain and improve its competitive position in the U.S. market if New Mexico growers could obtain a premium for their chile peppers (e.g., Frosch, 2011; Hawkes, 2013).
Market research is an important component to developing any ROP certification program, but there is no such published research for New Mexico chile peppers. The costs and benefits of current and future regulations regarding advertising of New Mexico chile peppers could also be more effectively assessed if more is known about consumers’ attitudes toward the product. Overall, better understanding of the marketing environment for New Mexico chile peppers will help the industry make more informed decisions about the relative potential for ROP certification program success. This report identifies the types of U.S. consumers who currently purchase chile pepper products and gauges consumer interest in purchasing a New Mexico-certified chile pepper.
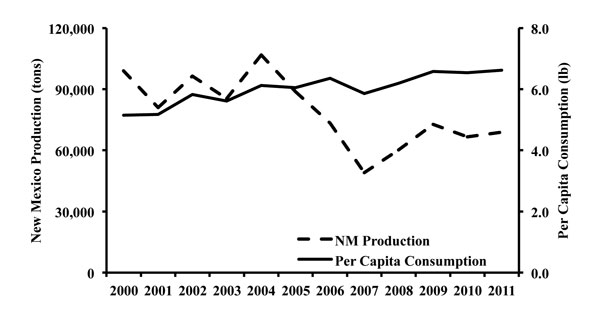
Figure 1. U.S. per capita consumption and New Mexico production of chile peppers, 2000–2011 (ERS, 2012).
Data and Methodology
Chile pepper preferences of U.S. food consumers were investigated using a web-based panel survey conducted between December 3 and 7, 2012. A demographically representative sample of consumers, in terms of U.S. census region of residence, was invited to participate in the survey. Consumers (13,771) were randomly invited from a standing online panel to participate in the survey via email to meet a sample quota of 1,000 respondents; 1,023 responses were used in the analysis presented here. Survey respondents were members of Cint, a market research company that manages online market research panels. Cint compensates respondents for their participation in market research surveys. Survey respondents were required to be at least 18 years of age.
The survey instrument was pretested with a convenience sample of local food consumers to improve clarity before administering to online panelists. The survey instrument was organized into three sections. In the first section, respondents identified their chile pepper purchase and consumption habits. For example, respondents were asked how frequently they purchase chile peppers in any form. In the second section, respondents completed a series of stated preference questions related to chile peppers. Stated preference approaches are considered appropriate to explore consumer preferences toward products or product attributes that do not currently exist, such as ROP certification (Louviere et al., 2010). The third section asked a number of demographic and lifestyle questions, such as income, food expenditures, and interest in food and cooking.
Both the questionnaire scope and key terms used in the survey instrument were defined for consumers. Survey participants were informed that the study was most interested in shopping preferences for foods consumed at home, especially spicy peppers, which were defined in the survey as “Spicy peppers come in a mix of varieties and colors. They can be used to add heat (spiciness) and flavor to foods.” Respondents were provided with information regarding the term “chile pepper” to help clarify the study vegetable. Survey participants were also provided images of peppers, along with their names, to denote what types of peppers were considered spicy peppers for the purposes of this study.
As previously noted, the New Mexico chile pepper industry produces numerous pepper varieties. A number of product variations also exist, and these products differ in processing level (e.g., fresh green chile; canned or frozen chopped green chile; and dried, ground red chile, paprika, or cayenne powder). To help account for these various product combinations, consumer preferences toward two specific chile pepper products were explored. These two products represent a large proportion of the New Mexico chile pepper market: in 2010, 45% of the state’s chile acreage was devoted to long green chile (often sold fresh) and 22% was devoted to long red chile (often dried and ground for red chile powder; NASS, 2012b). Half of the respondents (n = 436) were asked to identify their willingness to pay for a fresh green chile pepper, hereafter referred to as the “green product.” The remaining respondents (n = 587) were asked to identify their willingness to pay for a dried and ground red chile pepper package, hereafter referred to as the “red product.”
Respondents were asked to rate the importance of five attributes when selecting chile peppers using a Likert scale, with one being very unimportant and five being very important. As discussed earlier, previous research suggests that ROP certifications may imply flavor, quality, or food safety claims, while growing and processing region are distinct production characteristics that may be mutually exclusive parts of a certification program’s design. For this reason, these five attributes were considered germane to the stated preference question.
Chile Product Purchasers
To explore what types of consumers currently purchase chile pepper products, respondents were asked to identify if they had purchased either fresh green chile peppers or a dried, ground red chile powder in the past three months2.Frequencies generated through the PROC FREQ3 procedure in SAS were used to explore relationships between survey respondents who indicated that they had purchased chile in the past three months and those who had not.
A probit model4 was used to predict the probability that a particular individual purchased a red or green chile pepper product within the last three months (purchase = yes/no). This probability was hypothesized to be a factor of attributes related to the chile pepper product (product-specific attributes) and attributes related to the individual consumer (consumer-specific attributes). Based on consumer preference theory and previous literature, several consumer-specific variables were also included in the model. Demographic factors (e.g., age, income) have been shown to influence U.S. consumers’ preferences and willingness to pay for carrots and spinach (Nganje et al., 2011). Shopping location may also influence consumers’ willingness to pay for region-oriented production attributes (Umberger et al., 2003). Since both the green and red chile pepper products are typically used as a cooking ingredient, consumers who eat a larger proportion of their food at home (e.g., prepare and cook meals) may be more willing to purchase either a fresh green or dried, ground red chile pepper product. Similarly, those consumers who enjoy spicy foods may be more willing to purchase chile peppers. Those consumers with more disposable income (as measured by food expenditures per household member) may be more able to purchase a chile pepper product because these products are typically used to enhance foods rather than as a primary ingredient. A brief description and summary of the variables included in the analyses are identified in Table 1. Estimated coefficients can be interpreted as the marginal effects of the attribute variable (i.e., consumers who enjoy spicy foods) on the probability that the individual purchases either a red or green chile pepper product (depending on the model under consideration).
|
Table 1. Name and Description of Variables Included in the Probit Models |
||
|
Variable |
Description |
Mean |
|
Product-Specific Attributes |
|
|
|
Importance of flavor |
Equals 1 if rated flavor “important” or “very important” to their chile pepper purchase decision |
0.87 |
|
Importance of growing region |
Equals 1 if rated growing region “important” or “very important” to their chile pepper purchase decision |
0.49 |
|
Importance of processing region |
Equals 1 if rated processing region “important” or “very important” to their chile pepper purchase decision |
0.47 |
|
Importance of quality |
Equals 1 if rated quality “important” or “very important” to their chile pepper purchase decision |
0.78 |
|
Importance of safety |
Equals 1 if rated safety “important” or “very important” to their chile pepper purchase decision |
0.83 |
|
Consumer-Specific Attributes |
|
|
|
Age |
|
|
|
Under 35 |
Equals 1 if respondent under 35 years of age |
0.20 |
|
35–54 |
Equals 1 if respondent between 35 and 54 years of age |
0.36 |
|
55–64 |
Equals 1 if respondent between 55 and 64 years of age |
0.13 |
|
65 or older |
Equals 1 if respondent 65 years of age or older |
0.30 |
|
Annual household income |
|
|
|
Less than $25,000 |
Equals 1 if annual household income less than $25,000 |
0.24 |
|
$25,000–$49,999 |
Equals 1 if annual household income between $25,000 and $49,999 |
0.34 |
|
$50,000–$99,999 |
Equals 1 if annual household income between $50,000 and $99,999 |
0.31 |
|
$100,000 or more |
Equals 1 if annual household income $100,000 or more |
0.11 |
|
Census region of residence |
|
|
|
Northeast |
Equals 1 if respondent lives in the following states: CT, MA, ME, NH, NJ, NY, PA, RI, VT |
0.18 |
|
Midwest |
Equals 1 if respondent lives in the following states: IA, IL, IN, KS, MI, MN, MO, ND, NE, OH, SD, WI |
0.26 |
|
South |
Equals 1 if respondent lives in the following states: AL, AR, MD, DC, DE, FL, GA, KY, LA, MS, NC, OK, SC, TN, TX, VA, WV |
0.36 |
|
West |
Equals 1 if respondent lives in the following states: AK, AZ, CA, CO, HI, ID, MT, NM, NV, OR, UT, WA, WY |
0.19 |
|
Enjoys spicy foods |
Equals 1 if “enjoy some” or “love” spicy foods |
0.75 |
|
Percent of food consumed at home |
Amount of food consumed at home (%) |
0.82 |
|
Purchases some vegetables from a specialty food store or direct from farmer |
Equals 1 if purchased some vegetables from specialty food store or direct from farmer |
0.58 |
|
Weekly food expenditures |
$/per household member |
50.62 |
Interest in Certified Chile Products
Following closely Grannis and Thilmany (2002) and Umberger et al. (2009), respondents were also asked to complete a payment card to identify if a specific product premium was reasonable to pay, beginning to be expensive, or too expensive (Figure 2). Following Lusk (2003) and others (e.g., Cummings and Taylor, 1999), before completing the payment card respondents were presented with a script that explained hypothetical bias to participants in an effort to obtain more realistic willingness to pay valuations. Price premium increases were reported in 5-cent increments for both the green and red pepper products. Baseline per pound (in the case of the green product) or per 1.25-oz package (in the case of the red product) prices for the conventional, non-certified version of the pepper product represented retail grocery prices for the product at the time of the survey: $0.99 and $1.29 for the green and red products, respectively. The use of the payment card in the survey allowed us to evaluate the potential market size for both red and green products at a range of product premiums.
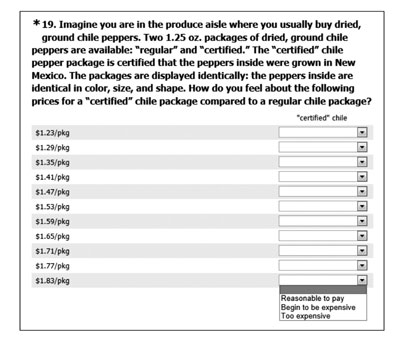
Figure 2. Example of the payment card question posed to survey participants.
Results and Discussion
Comparing demographic characteristics between survey participants who indicated they had purchased fresh green chile in the last three months (“consumers”) and those who had not purchased fresh green chile in the last three months (“non-consumers”) using frequency tables and chi-squared tests, we found statistically significant relationships between consumption and age, place of residence (geography), and income. Additional demographic comparisons among fresh green chile consumers and non-consumers, as well as demographic comparisons among red chile powder consumers (those who indicated they had purchased dried, ground red chile powder in the last three months) and non-consumers, are available in Appendix I. As a general rule, consumers of fresh green chile were younger (Figure 3), lived in the U.S. Census-defined “West” region (Figure 4), and had higher incomes, greater than $100,000 annually (Figure 5). Other demographic variables examined (gender and ethnicity) did not show statistically significant relationships. Similar comparisons made for dried, ground red chile powder did not show statistically significant differences. The lack of observable statistical relationships between consumption and demographics for dried chile may be related to the nature of the product. Dried red chile powder is a common ingredient in many foods bridging different cuisines.
Further exploration regarding factors that affect the probability of chile consumption was made via two probit models. The first model was designed to provide insight into the types of consumers who currently purchase fresh green chile and the second to provide insight into the types of consumers who currently purchase dried, ground red chile powder. Data from the survey’s payment card were then plotted to explore consumers’ willingness to pay (potential demand) for a New Mexico ROP-certified version of each chile pepper product.
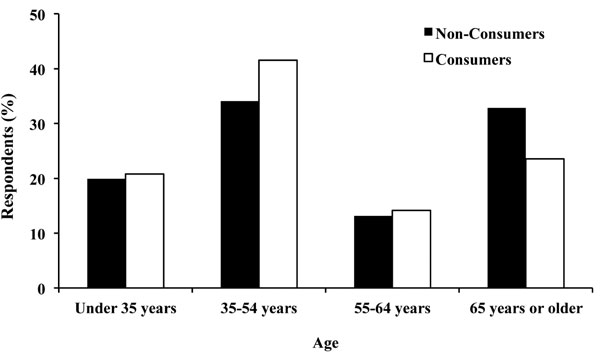
Figure 3. Age of fresh green chile consumers and non-consumers responding to web-based survey (n = 1023).
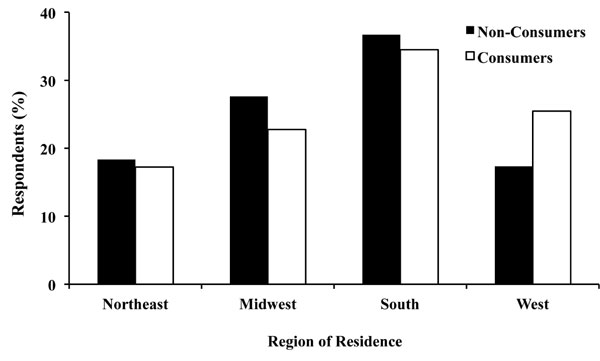
Figure 4. Census region of residence of fresh green chile consumers and non-consumers responding to web-based survey (n = 1023).
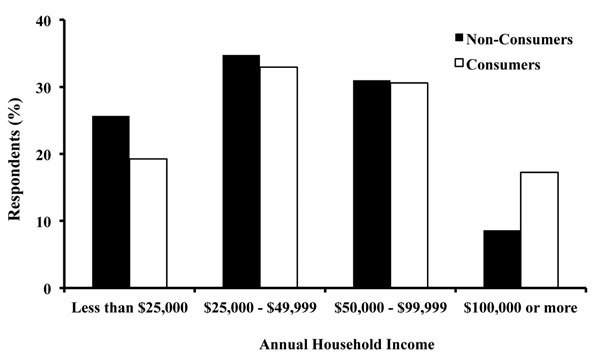
Figure 5. Annual household income of fresh green chile consumers and non-consumers responding to web-based survey (n = 1023).
|
Table 2. Probit Model Results: Probability Consumers Have Purchased Green or Red Chile Pepper Products Within the |
||||
|
Variable |
Green Chile Product |
Red Chile Product |
||
|
Coefficient |
SE |
Coefficient |
SE |
|
|
Constant |
-2.21** |
0.57 |
-1.08** |
0.39 |
|
Product-Specific Attributes |
|
|
|
|
|
Importance of growing region |
0.34 |
0.22 |
-0.10 |
0.17 |
|
Importance of processing region |
-0.18 |
0.22 |
-0.27 |
0.17 |
|
Importance of flavor |
0.30 |
0.32 |
-0.10 |
0.22 |
|
Importance of safety |
-0.26 |
0.28 |
0.17 |
0.20 |
|
Importance of quality |
0.04 |
0.26 |
0.31* |
0.17 |
|
Consumer-Specific Attributes |
|
|
|
|
|
Age1 |
|
|
|
|
|
Under 35 |
0.46** |
0.21 |
0.10 |
0.17 |
|
35–54 |
0.45** |
0.19 |
0.46** |
0.14 |
|
55–64 |
0.21 |
0.26 |
0.28 |
0.18 |
|
Annual household income2 |
|
|
|
|
|
$25,000–$49,999 |
0.19 |
0.19 |
0.24 |
0.15 |
|
$50,000–$99,999 |
0.09 |
0.20 |
0.46** |
0.15 |
|
$100,000 or more |
0.66** |
0.27 |
0.38* |
0.21 |
|
Census region of residence3 |
|
|
|
|
|
Northeast |
-0.56** |
0.23 |
-0.16 |
0.18 |
|
Midwest |
-0.42** |
0.21 |
-0.10 |
0.17 |
|
South |
-0.35* |
0.19 |
0.10 |
0.16 |
|
Enjoys spicy foods |
1.02** |
0.23 |
0.28** |
0.13 |
|
Percent of food consumed food at home |
0.43 |
0.48 |
0.65** |
0.30 |
|
Purchases some vegetables from specialty food store or direct from farmer |
0.41** |
0.16 |
0.13 |
0.12 |
|
Weekly food expenditures ($) per household member |
0.00* |
0.00 |
0.00 |
0.00 |
|
Log Likelihood Function |
-205.94 |
-360.43 |
||
|
Sensitivity (actual 1s correctly predicted) |
21.1% |
88.1% |
||
|
Specificity (actual 0s correctly predicted) |
94.2% |
29.6% |
||
|
* Represents significance at p < 0.10. |
||||
Chile Product Purchasers
Almost one-quarter (24.9%) of respondents stated that they had purchased fresh green chile peppers within the past three months, while 47.3% stated they had purchased dried, ground red chile powder within the past three months. These consumers represent potential New Mexico ROP-certified chile pepper consumers if they find value in an ROP certification. Consumers answering that they do not currently purchase either product (45.8% of respondents) represent growth potential in the national chile pepper market if they can be transformed from non-consumers into consumers. Results suggest some consumers are more likely to purchase a New Mexico ROP-certified red or green chile pepper product (Table 2)5 .For example, surveyed consumers who enjoy or love spicy foods are more likely to purchase both green and red chile pepper products (p < 0.05). Respondents who believed quality was an important part of their fresh green chile pepper buying decision were more likely to purchase a red chile product (p < 0.05).
Consumers in households with higher per-person food budgets were less likely to purchase fresh green chile peppers (p < 0.05). More affluent consumers (those earning more than $50,000 annually in the case of a red product or $100,000 annually in the case of a green product) are more likely to purchase a chile product than consumers earning less than $25,000 annually. Because food consumers with higher household incomes typically have higher disposable incomes, they have the purchasing power to buy chile peppers, which are arguably a superior good (that is, consumers increase consumption of specialty vegetables such as chile peppers as their incomes increase).
Respondents were more likely to purchase dried, ground red chile peppers if they consume a larger percentage of their food at home (p < 0.05). This is expected because a dried red product is often purchased for use as a flavor enhancer, making it a popular ingredient in home-prepared foods. Food consumers who tend to shop at specialty food stores or purchase directly from a farmer are more likely to purchase a green chile product. This may be a function of availability: fresh green chile is not readily available nationwide via traditional grocery outlets, and it may be more likely to be carried in specialty stores or by farmers who produce a smaller amount for local sale.
Interest in Certified Chile Products
The majority of consumers participating in the survey were willing to purchase a New Mexico certified green or red chile pepper product at the current market price of a non-ROP-certified product ($0.99 per pound and $1.29 per 1.25-oz package, respectively). Since the costs of labeling an ROP-certified food product may outweigh the value consumers place on this information (Krissoff et al., 2004), the potential market size associated with a premium-priced certified product must be examined. Developing a certification program could be a costly endeavor, and producers may need to receive a minimum premium in order to cover the increased costs associated with certification. Some vegetable consumers appear willing to pay premiums for ROP-labeled produce: South Carolina residents are willing to pay a 27% premium for produce labeled that it was grown in South Carolina (Carpio and Isengildina-Massa, 2009) and Arizona residents are willing to pay a 12% premium over the mean price for carrots labeled “Arizona Grown” (Nganje et al., 2011). Vidalia onions command premiums ranging between 8% and 400% of the retail price of other non-ROP certified onions (Carter et al., 2006).
Almost one-third (31.4%) of food consumers surveyed were willing to pay a 20% premium for the ROP-certified green chile pepper product (Figure 6). More than one-third (42.6%) of surveyed consumers were willing to pay a 19% premium for the ROP-certified red chile pepper product (Figure 7). To the extent that the respondents in this survey represent U.S. food consumers as a whole, these results suggest retail premiums could be realized for a New Mexico ROP-certified chile pepper product.
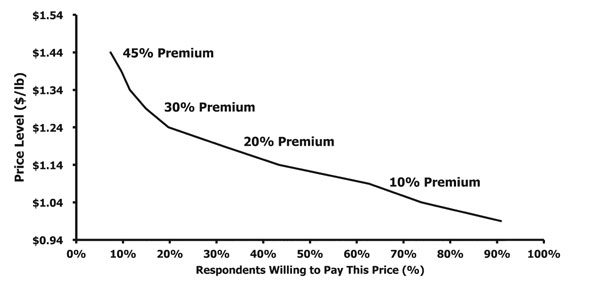
Figure 6. Willingness to pay for New Mexico region of production-certified fresh green chile pepper product (n = 436).
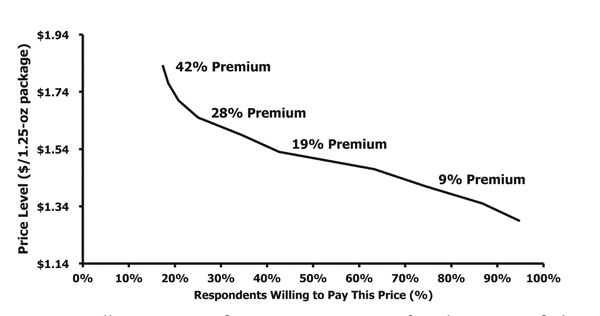
Figure 7. Willingness to pay for New Mexico region of production-certified dried, ground red chile pepper product (n = 587).
Conclusions
This study explored the types of consumers who purchase two common types of chile pepper products—fresh green chile and dried, ground red chile powder—and provided an analysis of the market potential for a region of production-differentiated chile pepper by gauging consumer interest in red and green New Mexico ROP-certified chile products. The data provide evidence that socio-demographic differences exist among chile pepper consumers and that a potential niche market exists for both red and green chile pepper products that are “Certified New Mexico.”
A “chilehead” is someone who loves hot peppers in all their forms. Food product manufacturers in New Mexico and elsewhere have shown great creativity in capitalizing on the growing demand for “fiery foods”6 by producing and marketing a wide variety of food products, such as candy (e.g., “hot” fudge), chile pepper-flavored wine and beer, and gelato. Annual per capita consumption of chile peppers in the United States has increased from 5.2 to 6.6 pounds over the past decade (ERS, 2012). Chile peppers are now more integrated into the U.S. food market than ever before. If the prevalence of new products being developed using chile peppers is any indication, growth in the nation’s “chilehead” population isn’t slowing down, although both acreage and production trends for the New Mexico chile pepper industry are not positive. Given the globalization of the world’s chile pepper market, a New Mexico ROP certification program could generate additional value for and improve the economic sustainability of the state’s pepper industry. ROP certification would help the state’s peppers establish and maintain their reputation among new and existing chile consumers.
However, developing a certification program requires a significant resource commitment from the industry and supply chain participants. The New Mexico chile pepper industry is small—even by many specialty crop standards—and will have a limited number of marketing dollars to spend. Appropriate allocation of these marketing resources will help improve the chances of program success. The results of this study may be used by industry stakeholders as a starting point in exploring potential targeted marketing efforts aimed at those consumers willing to pay a premium for the New Mexico ROP-certified product. Additional research is needed to explore the willingness of consumers to pay a premium for New Mexico ROP certification associated with other chile pepper products seen in the market, such as frozen or canned chopped green chile peppers. The relationship between processing level and willingness to pay a premium for an ROP-certified vegetable is not well understood. New Mexico chile peppers are the key ingredients in many established food products (e.g., brand-name hot sauces and flavor mixes) that are not marketed with New Mexico ROP identification.
As noted previously, new regulations to preserve the identity of New Mexico chile peppers are being implemented. These regulations will impose new costs on the state’s food product manufacturers and marketers. Some of these manufacturers source raw chile peppers from several locations (both in New Mexico and elsewhere), often balancing complex pepper quality (e.g., heat and/or color intensity) and quantity requirements. If the new origin regulations are not accompanied by market research and marketing efforts to increase consumer awareness and demand for New Mexico chile peppers, regulatory costs are likely to outweigh benefits. Our research has shown that ROP certification or branding has the potential to increase the prices paid by some consumers for New Mexico-produced red and green chile, thus helping to improve the industry’s economic status. Consumer-level research and documentation of the state’s chile pepper quality characteristics are also needed in order to better understand and distinguish between consumer perceptions of intrinsic and extrinsic attributes embedded in the New Mexico ROP concept.
Do consumers value a New Mexico ROP certification for chile peppers because they want to know where a product was produced? Or do consumers value the ROP certification for New Mexico-grown chile peppers because the certification conveys quality and/or safety information by way of identifying region of production? Further research would clarify the findings reported here regarding the influence of quality metrics and inferences on the value of ROP certification for fresh and processed vegetables. Additional information regarding the influence of marketing on consumers’ willingness to purchase—and pay a premium for a New Mexico- or U.S.-grown ROP-certified chile pepper product—is also needed. How marketing efforts influence consumer preferences related to this product will have a large impact on an ROP certification program’s potential for success.
The results of this study should be viewed with awareness of the study’s methodological limitations. Web-based surveys can suffer from limited distribution (Miller and Dickson, 2001), difficulties in measuring representativeness of the sample or sampling frame (Miller and Dickson, 2001; Evans and Mathur, 2005; Wright, 2005), and other issues common with self-administered surveys, such as an inability to focus respondent attention on the survey task (Miller and Dickson, 2001). To comply with Institutional Review Board policy, respondents were provided information regarding the purpose of the survey (i.e., gaining insights into consumer preferences for spicy peppers) and given the opportunity to decline participation if they were not interested in the topic. As a result of this policy, it is possible (and even likely) that survey participants had some affinity for chile peppers, and “chileheads” may be over-represented in the results. Because survey respondents diverged from the general U.S. population on several demographic variables, care should be taken when attempting to use the results of this study to make broader generalizations about all U.S. food consumers.
Acknowledgments
This material is based upon work supported in part by capacity funding from the National Institute of Food and Agriculture, U.S. Department of Agriculture. Any opinions, findings, conclusions, or recommendations expressed in this publication are those of the author(s) and do not necessarily reflect the view of the U.S. Department of Agriculture.
Footnotes
1 It is possible that confounding factors, such as supply controls, rather than solely intrinsic product quality attributes influence premiums for regionally branded products. Indeed, it has been noted that supply and market entry restrictions can affect ROP-certified product prices (Carter et al., 2006).(back to top)
2 Corresponded to the months of September, October, and November 2012.(back to top)
3SAS documentation on this procedure is available at http://support.sas.com/documentation/cdl/en/procstat/63104/HTML/default/viewer.htm#procstat_freq_sect006.htm.(back to top)
4A probit model allows researchers to model how various factors influence the probability of an event happening or not happening. For a more detailed discussion of probit modeling, see Liao (1994).(back to top)
5Further exploration of the relationships identified in this model is needed to improve the model’s fit (e.g., low prediction capability as measured by sensitivity and specificity).(back to top)
6For example, the National Fiery Foods and Barbecue Show is held annually in Albuquerque, NM, and regularly features more than 1,000 different spicy food products (http://www.fieryfoodsshow.com).(back to top)
References
Batte, M.T., F.N. Van Buren, W. Hu, T. Woods, and S. Ernst. 2010. Do local production, organic certification, nutritional claims, and product branding pay in consumer food choices? Selected paper prepared for presentation at the Agricultural and Applied Economics Association 2010 AAEA, CAES, and WAEA Joint Annual Meeting, Denver, Colorado, July 25–27, 2010.
Becker, T. 2000. Consumer perception of fresh meat quality: A framework for analysis. British Food Journal, 102, 158–176.
Brown, M.G. 1986. The demand for fruit juices: Market participation and quantity demanded. Western Journal of Agricultural Economics, 11, 179–183.
Carpio, C.E., and O. Isengildina-Massa. 2009. Consumer willingness to pay for locally grown products: The case of South Carolina. Agribusiness, 25, 412–426.
Carter, C., B. Krissoff, and A.P. Zwane. 2006. Can country-of-origin labeling succeed as a marketing tool for produce? Lessons from three case studies. Canadian Journal of Agricultural Economics, 54, 513–530.
Cummings, R.G., and L.O. Taylor. 1999. Unbiased valuation estimates for environmental goods: A cheap talk design for the contingent valuation method. American Economic Review, 89, 649–645.
Diemer, J.A., R. Phillips, and M. Hillon. 2002. An industry-university response to global competition [New Mexico Chile Task Force Report No. 1]. Las Cruces: New Mexico State University College of Agriculture and Home Economics. Retrieved from https://pubs.nmsu.edu/research/horticulture/CTF1.pdf
Frosch, D. 2011, February 26. New Mexico takes its chile very seriously: Even the spelling. New York Times. Retrieved from http://www.nytimes.com/2011/02/27/us/27chile.html?_r=0
Grannis, J., and D.D. Thilmany. 2002. Marketing natural pork: An empirical analysis of consumers in the mountain region. Agribusiness, 18, 475–589.
Greene, W.H. 2000. Econometric analysis, 4th ed. Englewood Cliffs, NJ: Prentice Hall.
Hall, T.Y., and R.K. Skaggs. 2003. New Mexico’s chile pepper industry: Chile types and product sourcing [New Mexico Chile Task Force Report No. 8]. Las Cruces: New Mexico State University College of Agriculture and Home Economics. Retrieved from https://pubs.nmsu.edu/research/horticulture/CTF8.pdf
Hawkes, L. 2013, March 6. New Mexico chile law to get facelift. Southwest Farm Press. Retrieved from http://southwestfarmpress.com/vegetables/new-mexico-chile-law-get-facelift
Henneberry, S.R., K. Piewthongngam, and H. Qiang. 1999. Consumer food safety concerns and fresh produce consumption. Journal of Agricultural and Resource Economics, 24, 98–113.
Kemp, B.P. 2012. State vegetable [Online]. Georgia Secretary of State. Retrieved from http://www.sos.ga.gov/archives/state_symbols/state_vegetable.html
Krissoff, B., F. Kuchler, K. Nelson, J. Perry, and A. Somwaru. 2004. Country-of-origin labeling: Theory and observation [Report No. WRS-04-02]. Washington, D.C.: U.S. Department of Agriculture Economic Research Service.
Liao, T.F. 1994. Interpreting probability models: Logit, probit, and other generalized linear models. Thousand Oaks, CA: Sage Publications, Inc.
Loureiro, M.L., and W.J. Umberger. 2003. Estimating consumer willingness to pay for country-of-origin labeling. Journal of Agricultural and Resource Economics, 28, 287–301.
Louviere, J.J., D.A. Hensher, and J.D. Swait. 2010. Stated choice methods: Analysis and application. New York, NY: Cambridge University Press.
Lusk, J.L. 2003. Effects of cheap talk on consumer willingness-to-pay for golden rice. American Journal of Agricultural Economics, 85, 840–856.
Menapace, L., G. Colson, C. Grebitus, and M. Facendola. 2011. Consumers’ preferences for geographical origin labels: Evidence from the Canadian olive oil market. European Review of Agricultural Economics, 38, 193–212.
Nganje, W.E., R.S. Hughner, and N.E. Lee. 2011. State-branded programs and consumer preference for locally grown produce. Agricultural and Resource Economics Review, 40, 20–32.
Perret, A.O., and E. Thevenod-Mottet. 2010. The Florida oranges local agro-food system: Geographical indication or commodity? Paper prepared for the 116th EAAE Seminar, “Spatial Dynamics in Agri-food Systems: Implications for Sustainability and Consumer Welfare.” Parma, Italy, October 27–30, 2010.
Sheehan, K.B. 2002. Online research methodology: Reflections and speculations. Journal of Interactive Advertising, 3, 56–61.
Steenkamp, J.B. 1990. Conceptual model of the quality perception process. Journal of Business Research, 21, 309–333.
Stefani, G., D. Romano, and A. Cavicchi. 2005. Consumer expectations, liking and willingness to pay for specialty foods: Do sensory characteristics tell the whole story? Food Quality and Preference, 17, 53–62.
Teuber, R. 2010. Geographical indications of origin as a tool of product differentiation: The case of coffee. Journal of International Food and Agribusiness Marketing, 22, 277–298.
Umberger, W.J., D.M. Fuez, C.R. Calkins, and B.M. Sitz. 2003. Country-of-origin labeling of beef products: U.S. consumers’ perceptions. Journal of Food Distribution Research, 34, 103–116.
Umberger, W.J., D.D. Thilmany McFadden, and A.R. Smith. 2009. Does altruism play a role in determining U.S. consumer preferences and willingness to pay for natural and regionally produced beef? Agribusiness, 25, 268–285.
U.S. Department of Agriculture, Economic Research Service (ERS). 2012. 2011 vegetables and melons yearbook. Retrieved from http://usda.mannlib.cornell.edu/MannUsda/viewDocumentInfo.do?documentID=1212
U.S. Department of Agriculture, National Agricultural Statistics Service (NASS). 2012a. 2007 Census of Agriculture. Retrieved from http://www.nass.usda.gov/Quick_Stats
U.S. Department of Agriculture, National Agricultural Statistics Service (NASS). 2012b. 2011 New Mexico Annual Statistical Bulletin. Retrieved from http://www.nass.usda.gov/Statistics_by_State/New_Mexico/Publications/Annual_Statistical_Bulletin/bulletin11.asp
U.S. Department of Agriculture, National Agricultural Statistics Service (NASS). 2014. 2013 survey data: Chile pepper acres harvested and production value. Retrieved from http://www.nass.usda.gov/Quick_Stats
Appendix I
|
Demographic Variations in Fresh Green Chile Consumers and Non-Consumers in a Recent Survey of U.S. Food Consumers |
|||||
|
|
|
Non-Consumers |
Consumers |
||
|
Age |
|
n |
% |
n |
% |
|
Under 35 |
|
153 |
19.9 |
53 |
20.78 |
|
35–54 |
|
262 |
34.1 |
106 |
41.57 |
|
55–64 |
|
101 |
13.2 |
36 |
14.12 |
|
65 or older |
|
252 |
32.8 |
60 |
23.53 |
|
|
Total: |
768 |
100.0 |
255 |
100.00 |
|
Annual Household Income |
|
|
|
|
|
|
Less than $25,000 |
|
197 |
25.7 |
49 |
19.22 |
|
$25,000–$49,999 |
|
267 |
34.8 |
84 |
32.94 |
|
$50,000–$99,999 |
|
238 |
31.0 |
78 |
30.59 |
|
$100,000 or more |
|
66 |
8.6 |
44 |
17.25 |
|
|
Total: |
768 |
100.0 |
255 |
100.00 |
|
Census Region of Residence |
|
|
|
|
|
|
Northeast |
|
141 |
18.4 |
44 |
17.25 |
|
Midwest |
|
212 |
27.6 |
58 |
22.75 |
|
South |
|
282 |
36.7 |
88 |
34.51 |
|
West |
|
133 |
17.3 |
65 |
25.49 |
|
|
Total: |
768 |
100.0 |
255 |
100.00 |
|
Gender |
|
|
|
|
|
|
Female |
|
399 |
52.0 |
131 |
51.37 |
|
Male |
|
369 |
48.1 |
124 |
48.63 |
|
|
Total: |
768 |
100.0 |
255 |
100.00 |
|
Marital Status |
|
|
|
|
|
|
Married |
|
400 |
52.1 |
135 |
52.94 |
|
Single |
|
187 |
24.4 |
58 |
22.75 |
|
Other |
|
181 |
23.6 |
62 |
24.31 |
|
|
Total: |
768 |
100.0 |
255 |
100.00 |
|
Race |
|
|
|
|
|
|
Black or African |
|
49 |
6.4 |
22 |
8.63 |
|
Hispanic |
|
26 |
3.4 |
15 |
5.88 |
|
White or |
|
647 |
84.2 |
204 |
80.00 |
|
Other |
|
46 |
6.0 |
14 |
5.49 |
|
|
Total: |
768 |
100.0 |
255 |
100.00 |
|
Demographic Variations in Red Chile Consumers and Non-Consumers in a Recent Survey of U.S. Food Consumers |
|||||
|
|
|
Non-Consumers |
Consumers |
||
|
Age |
|
n |
% |
n |
% |
|
Under 35 |
|
100 |
18.6 |
106 |
21.9 |
|
35–54 |
|
192 |
35.6 |
176 |
36.4 |
|
55–64 |
|
76 |
14.1 |
61 |
12.6 |
|
65 or older |
|
171 |
31.7 |
141 |
29.1 |
|
|
Total: |
539 |
100.0 |
484 |
100.0 |
|
Annual Household Income |
|
|
|
|
|
|
Less than |
|
142 |
26.4 |
104 |
21.5 |
|
$25,000–$49,999 |
|
185 |
34.3 |
166 |
34.3 |
|
$50,000–$99,999 |
|
158 |
29.3 |
158 |
32.6 |
|
$100,000 or more |
|
54 |
10.0 |
56 |
11.6 |
|
|
Total: |
539 |
100.0 |
484 |
100.0 |
|
Census Region of Residence |
|
|
|
|
|
|
Northeast |
|
98 |
18.2 |
87 |
18.0 |
|
Midwest |
|
148 |
27.5 |
122 |
25.2 |
|
South |
|
197 |
36.6 |
173 |
35.7 |
|
West |
|
96 |
17.8 |
102 |
21.1 |
|
|
Total: |
539 |
100.0 |
484 |
100.0 |
|
Gender |
|
|
|
|
|
|
Female |
|
267 |
49.5 |
263 |
54.3 |
|
Male |
|
272 |
50.5 |
221 |
45.7 |
|
|
Total: |
539 |
100.0 |
484 |
100.0 |
|
Marital Status |
|
|
|
|
|
|
Married |
|
286 |
53.1 |
249 |
51.5 |
|
Single |
|
131 |
24.3 |
114 |
23.6 |
|
Other |
|
122 |
22.6 |
121 |
25.0 |
|
|
Total: |
539 |
100.0 |
484 |
100.0 |
|
Race |
|
|
|
|
|
|
Black or African |
|
44 |
8.2 |
27 |
5.6 |
|
Hispanic |
|
19 |
3.5 |
22 |
4.6 |
|
White or |
|
442 |
82.0 |
409 |
84.5 |
|
Other |
|
34 |
6.3 |
26 |
5.4 |
|
|
Total: |
539 |
100.0 |
484 |
100.0 |
For more on this topic, see the following publications:
RR-704: National Market Analysis for Southwestern Herbs
https://pubs.nmsu.edu/research/economics/RR704/index.html
RR-780: Developing and Managing a Certification Program as an Agricultural Marketing Tool
https://pubs.nmsu.edu/research/economics/RR780/index.html
RR-784: Challenges and Opportunities Associated with U.S. Agricultural Certifications
https://pubs.nmsu.edu/research/economics/RR784/index.html

Dr. Jay Lillywhite is an Associate Professor in the Agricultural Economics and Agricultural Business Department at New Mexico State University. He earned his Ph.D. in Agricultural Economics from Purdue University. Dr. Lillywhite's research addresses agribusiness marketing challenges and opportunities.
To find more resources for your business, home, or family, visit the College of Agriculture and Home Economics on the World Wide Web at aces.nmsu.edu
Contents of publications may be freely reproduced for educational purposes. All other rights reserved. For permission to use publications for other purposes, contact pubs@nmsu.edu or the authors listed on the publication.
New Mexico State University is an equal opportunity/affirmative action employer and educator. NMSU and the U.S. Department of Agriculture cooperating.
October 2015