Research Report 781
Ted Sammis, Mick O'Neill and Junming Wang
College of Agricultural, Consumer and Environmental Sciences, New Mexico State University (Print Friendly PDF)
Authors:Respectively, Professor, Department of Plant and Environmental Sciences, New Mexico State University; Professor, Department of Plant and Environmental Sciences, NMSU; and Research Assistant Professor, Department of Agricultural and Environmental Sciences, Tennessee State University, Nashville, TN.
Abstract
Universities manage research projects through both internal funding and support systems for the generation of external grant funds. The management of a research project is full of uncertainty and complexity. An economic evaluation of university research projects can determine the economic impact on society and can generate a return on the investment from federal and state funds. This paper presents a simple method that uses an Excel spreadsheet to estimate the economic value of research at the project level. Three sample calculations were conducted for agricultural research projects (on pecan irrigation, a new variety of bigtooth maple tree, and evaluation of new alfalfa varieties) to demonstrate the methodology. The research on new alfalfa varieties obtained the highest benefit:cost ratio (123:244). This supports the concept that variety trials have one of the highest potential paybacks of any agricultural research. An economic analysis of the benefit:cost ratio and a net present value for most applied research are easy to compute with the presented Excel calculator. When the economic analysis includes a large number of environmental values, more time and effort are needed to conduct the analysis, but an economic analysis remains possible. If used as part of research proposal submission, the economic analysis could give reviewers another method to rank research proposals and select those proposals that not only propose good science but also have a potential reasonable return on taxpayers’ investments.
Introduction
Universities manage research projects through both internal funding and support systems for the generation of external grant funds. External grants are awarded by federal and state governments, private industry, and other organizations. The management of a research project is full of uncertainty and complexity. Research has elements of creativity and innovation, and predicting the outcome of research is difficult, but that should not preclude an estimate of the economic impact of that research on society.
Universities conduct applied as well as basic research. Applied research is an investigation to acquire new knowledge that is directed toward a specific, practical aim or objective; basic research, which is experimental or theoretical work, is undertaken to acquire new knowledge of the underlying phenomena and observable facts, without a particular application or use in view. Pure basic research is carried out for the advancement of knowledge, without working for long-term economic or social benefits and with no positive effort made to apply results to practical problems or to transfer the results to sectors responsible for their application.
Private industry allocates applied research dollars based on economic analysis. For example, if it is not cost-effective to develop orphan vaccines (vaccines for rare diseases), then private industry generally does not develop such vaccines until government intervenes to decrease the economic risk (Lang and Wood, 1999). Basic research probably should not be subjected to economic analysis, but universities and state and federal governments should base the allocation of applied research dollars on economic analysis so that tax dollars are spent more effectively. Hayami and Ruttan (1985) formalized and empirically verified their economic theory that the development of innovative technology through applied research is strongly linked with economic conditions. New innovations are more likely to emerge in response to scarcity and economic opportunities. For example, drip irrigation and other water-saving technologies are likely to be developed in locations such as the California desert where water constraints are binding. This means that requests for applied research proposals are driven by economics. The federal government also requires stakeholder involvement in applied research to help ensure that the research and outreach have an impact on society (Carmin et al., 2003). However, the process of selecting which research proposal to fund is not tied to an economic evaluation. Masters (1966) published a guide to evaluate the economic impact of agricultural research. The publication came with a spreadsheet for implementation and involved:
- The cost of the research and the change in production due to the new technology, as a proportion of total production.
- Adoption costs of the new technology, as a proportion of the product price.
- Net change in production costs, as a proportion of the product price.
- Change in the equilibrium quantity produced due to the new technology.
- Economic benefits from the adoption of research results.
- Net economic benefits after subtracting the costs of research and Extension.
Some of the inputs to this supply/demand economic analysis can only be acquired from data after research has been conducted and adopted, which does not allow for an economic evaluation of potential return on a proposed research project. But the economic analysis is sufficiently complicated that the process should be conducted only by a person trained in economics. A simpler economic analysis is needed for researchers who are not trained as economists.
All federally and state-supported agriculture project descriptions are in a central current research information system (CRIS) database (USDA, 2009a). This database contains not only information about the research project but also statements about the research’s impact on society. However, the CRIS form does not require an economic cost-benefit analysis or a net present value (NPV) calculation of a research project, and most CRIS reports have only general statements about who might use and benefit from the research results. Other federal agencies maintain databases of funded research, such as the U.S. Department of Energy’s Office of Biological and Environmental Research, which funds research in the areas of climate and environmental sciences and biological systems science (U.S. Department of Energy, 2010). These abstracts also do not contain economic cost-benefit statements or information on who will use the research.
Applied agricultural research that results in increased yield is easy to evaluate economically, but applied research that does not directly affect yield is harder—but not impossible—to evaluate economically. When agricultural research involves environmental issues, simplified assumptions are needed to conduct the economic analysis. All research and economic analyses have basic assumptions about knowledge that may be in error (Arrow, 1974), but these errors should not preclude conducting the analysis.
Diffusion Processes in Economic Analysis
Applied research can have a time frame for adoption of the research that extends substantially into the future. The key to economic analysis of the benefit of research is to project the adoption of that technology into the future with realistic adoption rates and benefits. Calculating the cost, as explained in the following discussion, is straightforward and requires knowledge only of the cost of the research presented in the proposal.
The total adoption rate of research is a function of the diffusion of innovations, a process by which new ideas are introduced and accepted over time. The four main elements of diffusion are innovation, communication channels, time, and the social system (Rogers, 1995). Each element must be addressed by the scientific community when trying to transfer new research results to the farming community. If the diffusion process is to be successful, it must be undertaken only when economic opportunity occurs (Sunding and Zilberman, 2001).
For researchers to start producing economic analyses of their projects, a diffusion process of that methodology is necessary, and a demand for that technology must exist. This can be accomplished by convincing researchers of the merit of such analyses and then training individual researchers in the process of simple economic analysis. Alternatively, the diffusion process itself can convince the organization to adopt the economic analysis strategy. Organizational learning consists of different orders of learning (Argyris and Schön, 1978). However, exploitation of an organization occurs only when external pressures are applied, such as when a grant-funding agency or state legislature requires an economic cost-benefit analysis to get or keep funding (Miller, 1992).
The objective of this paper is to describe a simple methodology that can be used by researchers who are not economists to calculate the net present value and cost-benefit analysis of their research projects using a simple, readily available economic spreadsheet. The second objective is to describe how this information can be used to justify research proposals to federal funding agencies, university administrators, and state legislatures.
Materials and Methods
Simple economic analysis requires input costs and output values. The methods to calculate the input costs are:
- Determined from the budget created for a research grant. This budget contains categories of salaries, fringe benefits for the salaries, overhead, operations, and capital equipment that represent input.
- Determined from the cost to produce one or more journal articles and Extension publications.
If a research budget is not available, then the general cost of that research can be estimated from the number of journal articles or Extension publications produced from that research. The cost per journal article can be determined by taking the total cost of conducting a research project and dividing that by the average number of journal articles/Extension publications produced by the research unit.
In agricultural research, output is the value of the increase in yield or environmental benefits. Journal articles and Extension publications are the main product of applied research produced by researchers, graduate students, and post-doctoral students. In the process of producing the publications, students are trained to be researchers. This is also an output of the research, but this output value is not included in the analysis because of the difficulty of evaluating it.
The methods to calculate output values are two fold:
- Determine the increase in yield that can occur from the application of the research, and then calculate the value of this increased yield over the area that produces this yield at the rate of adoption.
- If the output value is not caused by increased yield then the output is the economic value of the environmental change that the research will bring about if applied through rules and regulations or outreach.
Examples for this article were drawn from USDA research projects conducted at New Mexico State University that represented outputs ranging from yield increases as a result of management changes to planting a new variety to decreased soil erosion potential. The agricultural community is used for this example of the value of economically evaluating research, but the methodology is applicable to any research conducted at any university. The Microsoft Excel Business Net Present Value Calculator spreadsheet (Microsoft, 2009) was used to calculate the net present value of the project based on a cost input for the duration of the project and a return period of profits for 10 years after the end of the project. The Excel spreadsheet was modified to include not only input and output information but also a linear adoption rate transfer function (c), where the total adoption amount (Ai) is considered to be a function of the number of years (i) specified to reach that value:
Ai = c × i (1)
The spreadsheet was modified to calculate a benefit:cost ratio for the projects. Output values of the projects were calculated based on the increased yield as calculated from the difference in yield between the USDA agricultural statistics of county yield averages for a minimum of two years and yield data from the research farms.
To compute the adoption rate of new technology, the agriculture survey documentation literature was searched for the change in conservation tillage acreage; the change in acreage of Bt (Bacillus thuringiensis) cotton, wheat, and barley varieties planted over time; and the change in crop acres irrigated with micro irrigation and sprinkler irrigation over time.
Results and Discussion
Adoption Rate of Research
In addition to transferring knowledge to the end user, the goal of the diffusion process of research in all aspects of science is to transfer the value of the knowledge to funding agencies and administrators who supervise the execution of the research. If the economic benefits are marginal for the end user but are highly beneficial in terms of environmental economic benefits, state or federal regulations may be needed to encourage the use of the technology. In agriculture, this was demonstrated in a nitrogen monitoring and nitrogen efficiency research project. The application of excess nitrogen pollutes surface and groundwater and contributes to greenhouse gases, but farmers in the study stated in a survey that they would not adopt the technology unless use of the technology was required by government regulatory agencies (Al-Jamal et al., 2001).
The success of the diffusion process by universities depends on the allocation of people over a sufficient period to conduct the diffusion process using a strategy that is cost-effective. In agriculture, the USDA Cooperative State Research, Education, and Extension Service assumes this role by trying to convince producers to adopt best management practices. Bultena and Hoiberg (1983) reported that many farmers continue to reject the use of recommended best management practices even though they are aware that the practices have been presented with valid and persuasive arguments based on research. Lovejoy and Napier (1986) blamed farmers’ failure to accept new best management practices on trying to motivate them by explaining the negative environmental effects of their production systems. Farmers adopting alternative practices strive for profitable and ecologically sound ways to use the unique potential resources of their farms. Adopting new agricultural technologies has played a prominent role in increasing productivity per unit area, as well as protecting the environment from pollution. But the diffusion rate and total number of farms that will adopt new research can vary considerably. The problems of the diffusion process are not limited to the agricultural sector. The adoption rate for non-agricultural research also can vary considerably. The adoption rate for implementing an electronic medical records system is currently only 36.1% in physicians’ offices, an increase of 3.2% per year, similar to the adoption rate of Bt cotton in agriculture (Fierce Healthcare, 2010).
Huffman and Evenson (1993) estimate the time period for adoption of agricultural research to be 10–15 years. Consequently, annual simple economic analyses or annual rate-of-return analyses must be integrated over this time period to quantify the value of the research. The value of the research in the future must be calculated back to the net present value. Recently, it has been shown that, based on long-term, state-specific data on agriculture in the United States, the duration of the effect of research on agricultural production could be 35–50 years (Alston et al., 2009). In the United States, the lag peaks at about 24 years and then decreases. However, new plant varieties can have effects that last as few as 10 years.
The adoption rate can be increased by mandating, through government regulations, that the technology be adopted, or by giving financial incentives to increase adoption. In agriculture, the adoption rate of conservation tillage in the United States shows a linear function starting at 0% in 1985 and reaching 38% in 2004 (Conservation Technology Information Center, 2004), or an adoption rate of 2% per year (Figure 1). The starting date of 1985 was based on the 1985 U.S. Farm Bill that mandated soil erosion control (Brock et al., 2009).
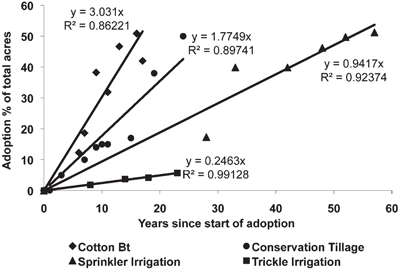
Figure 1. Adoption rate of conservation tillage, Bt cotton cultivation, and sprinkler and trickle irrigation.
Bt cotton adoption not mandated by government has had a linear adoption rate of 3% per year (Figure 1) starting in 1996 (Mississippi State University, 2009). The adoption rate for conversion from flood irrigation to sprinkler, and then from flood and sprinkler to trickle irrigation (USDA, 2009b), was less than Bt cotton or conservation tillage because the cost of adoption was higher for this technology (Bosch et al., 1992) and the technology required more expertise or training.
Adoption rates in agriculture generally fit linear functions with coefficients of determination ranging from 0.82 to 0.99. The maximum adoption rate for agricultural technology may be around 50% when other alternatives are available. The adoption rate of new plant varieties is rapid, peaking after four to five years, staying at the peak for one to two years, and then declining as new varieties are released (Figure 2). Consequently, the adoption time frame for research connected with new varieties is short compared to other types of agricultural research, and the economic cost-benefit analysis should reflect these differences in adoption rate and duration.
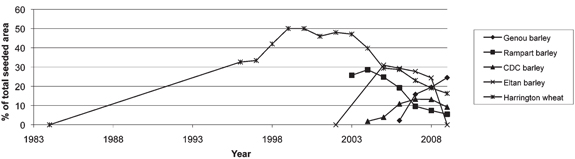
Figure 2. Percent of total seeded areas for barley and wheat varieties.
The adoption rate for new technologies is higher than the adoption rate for research because the financial risk associated with adoption is much lower. The adoption rate for televisions was 63% after eight years but then took an additional 30 years to reach a 98% adoption rate. Computer and Internet use reached 55% adoption after nine years beginning in 1994 and reached 80% in 2008, with an average adoption rate of 5.7% per year (Angwin, 2010). An economic analysis must use the appropriate adoption rate, which may have to be a best-guess estimate based on the adoption rate of similar technologies.
Economic Analysis
When establishing an economic spreadsheet of benefits, both positive and negative effects must be considered in three general categories: income, monetary value of environmental impacts, and monetary value of quality of life. A large volume of literature is available to put a monetary value on quality-of-life factors, such as recreational value, noise pollution, and health. The scientific literature also places a monetary value on air and water quality and on other environment values, including decrease in soil erosion, ecosystem health, water availability for drinking, recreation, food, manufacturing, and flood control (Wilson and Carpenter, 1999; Furberg et al., 2005), as well as quality of life factors, including recreation, wildlife, health of humans, and aesthetic beauty (Welsch, 2006).
Case Study of Pecan Irrigation Management
The spreadsheet, available online from Microsoft, shows a setup for a business operation (Figure 3). The input costs for research were changed to reflect the cost of the research as shown for a five-year CRIS research project on irrigation management of pecans in Las Cruces, NM (Table 1). The input table was also changed to include the maximum adoption rate of the research, potential change in yield, value of the yield change, and years to maximum adoption. The interest rate used to discount future profits to the current value was left at 5%, as in the original calculator.
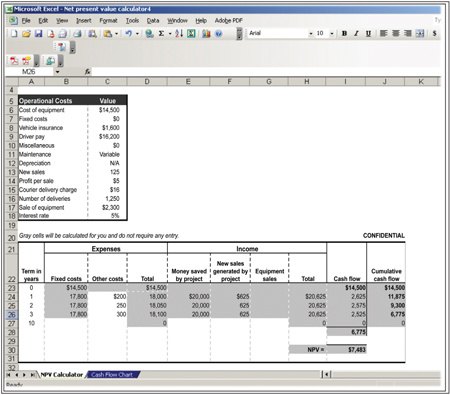
Figure 3. Microsoft net present value calculator spreadsheet.
Table 1. Input Information for Economic Spreadsheet on Pecan Research.
| Operational Costs | Value |
| Equipment | $30,000 |
| Salaries | $472,000 |
| Fringe | $141,000 |
| Operations | $30,000 |
| Maximum adoption after 11 years | 25% |
| Potential yield change | 565 lb/ac |
| Value of yield/lb | $1.62 |
| Acres affected | 23,745 |
| Interest rate | 5% |
The pecan research was conducted in a farmer’s field where best management practices for irrigation, fertilization, pruning, and integrated pest management were used, and the resulting yields were 565 pounds per acre above the average county yields. The income section of the spreadsheet had an adoption rate column added that decreases the potential profits to the projected profits based on the adoption rate. The profits in dollars (P) are calculated as:
P = Y × V × A × AD (2)
where Y = increased yield in lb/ac, V = value of pecans in $/lb, A = acreage amount in Doña Ana County, NM, and AD = adoption fraction of total acreage in Doña Ana County.
The affected acres could be expanded to include other counties, but the majority of mature orchards are in Doña Ana County. If an adoption rate of 25% after 11 years is assumed, the net present value of the research was $21,514,123, and the benefit:cost ratio would be 32 (Table 2).
Table 2. Years, Expenses, and Income for Pecan Research from Economic Spreadsheet.
| Year | Expenses | ------------- Income ------------- | ||
| Profits from increased adoption |
Adoption amount |
Cumulative profits |
||
| 1 | $673,0000 | $0 | 0.00 | − $673,000 |
| 2 | $0 | $987,900 | 0.05 | $313,900 |
| 3 | $0 | $1,481,850 | 0.07 | $1,796,750 |
| 4 | $0 | $1,975,800 | 0.09 | $1,377,250 |
| 5 | $0 | $2,469,750 | 0.11 | $6,242,300 |
| 6 | $0 | $2,963,700 | 0.14 | $9,205,999 |
| 7 | $0 | $3,457,650 | 0.16 | $12,663,649 |
| 8 | $0 | $3,951,600 | 0.18 | $16,615.249 |
| 9 | $0 | $4,445,550 | 0.2 | $21,060,799 |
| 10 | $0 | $4,939,500 | 0.23 | $27,060,799 |
| 11 | $0 | $5,433,450 | 0.25 | $31,433,748 |
| Net present value = $21,514,123 | ||||
| Benefit:cost ratio = 31.97 | ||||
The potential yield change used in Table 1 was calculated from Wang et al. (2007) and New Mexico Agricultural Statistics (2007) and was equal to a best management practices yield (2002–2005) from Wang et al. (2007) minus the average county yields in 2005 and 2006. The value of pecans was averaged from 2002 to 2005. Acres used were also listed in New Mexico Agricultural Statistics.
All of the pecan growers in this study were in one small area, and therefore assuming an adoption rate of 25% is not unrealistic if proper diffusion of the research is conducted. If only 18% is used (for conservation tillage) as the maximum diffusion percentage of best management practices for pecan production after 10 years, the benefit:cost ratio is still 23. However, the difference is $6.2 million, or $620,000 per year.
This simple economic analysis shows the benefit of increasing the diffusion process to the pecan growers by increasing the economic resources to hire more USDA Cooperative State Research, Education, and Extension Service personnel to conduct that process. An alternative to increasing the number of people conducting the diffusion process is to evaluate the effectiveness of the current diffusion process and change it to a more effective method using computers or video conferencing rather than the traditional methods of short courses, conferences, demonstrations, and personal contact.
If the Extension outreach is not successful and the adoption rate is lower than assumed, the benefits of the research can decrease considerably. Consequently, applied research without an effective diffusion process has limited value.
The limitation of a university’s ability to implement an effective diffusion process for all research conducted at a university, not just agricultural research, is a major stumbling block for society to benefit from applied research conducted at universities. This problem was pointed out by Nelson (1959) and Hill (2006) when they demonstrated that universities are more suited to conduct basic rather than applied research compared to private industry based on an economic analysis.
The Case Study Approach
The case study method provides a clear cause-and-effect relationship between research and productivity growth (Fuglie and Heisey, 2007), but published research using this approach is limited to successful research. When allocating resources, the case study of individual projects allows the research to be evaluated and changed if it does not have a net benefit:cost ratio greater than one. Fuglie and Heisey (2007) reviewed 18 journal articles and found that the average rate of return for agricultural research is 45%, which can be converted to a net cost:benefit ratio of about 10, depending on the duration of increased returns. These studies were statistical analyses and were not for individual projects. The pecan research had a potential cost:benefit ratio of 32, considerably higher than the average value for agriculture.
Project of a New Bigtooth Maple Variety
A second CRIS project was selected that does not represent an increase in production yield but instead was a research project to develop a new bigtooth maple (Acer grandidentatum) variety that was drought-resistant and could replace existing tree varieties commonly used for landscaping. The economic analysis does not include a savings in water because the research was to develop a drought-resistant variety that would survive for short durations of drought, not a variety that used less water. The research results identified a new bigtooth variety (Bsoul et al., 2006) that is currently being made available to homeowners. The economic value of a tree is a function of the tree diameter (size of the tree) and type of tree. Larger trees offer more shade, fruit, habitat for birds/wildlife, and greater aesthetics than smaller trees. The value of an individual tree was determined using the Casey tree economic calculator (Casey Trees, 2009) after estimating a diameter growth increase of 0.7 inch per year starting from two inches at planting (Maple-trees.com, 2009). The number of trees planted each year was estimated by the number of new houses built each year (12,000) in New Mexico (Rancho Viejo, 2009). The adoption planting rate was set at 21% at the end of 10 years, which assumes that the new tree variety was planted instead of other tree species at 21% of the new houses. The cost of the research, because a cost budget was not available, was estimated at $400,000 based on two journal articles published from the research. The value of the trees is the current year’s planting plus the value of the previous years’ plantings based on an increase in growth for each year since planting. The economic analysis resulted in a benefit:cost ratio of 1.52, but the value of the research is not paid for until eight years after the study (Table 3).
Table 3. Years, Expenses, and Income for Bigtooth Maple Research.
| Year | Expenses | ------------- Income ------------- | |||
| Value for current year |
Value past amount |
Adoption | Total | ||
| 1 | $400,000 | $0 | $0 | 0.00 | − $400,000 |
| 2 | $0 | $1,833 | $1,833 | 0.04 | − $398,167 |
| 3 | $0 | $6,873 | $8,705 | 0.06 | − $389,462 |
| 4 | $0 | $11,913 | $20,618 | 0.08 | − $368,844 |
| 5 | $0 | $18,327 | $38,945 | 0.10 | − $329,898 |
| 6 | $0 | $28,865 | $67,811 | 0.11 | − $262,087 |
| 7 | $0 | $38,487 | $106,298 | 0.13 | − $155,789 |
| 8 | $0 | $62,313 | $168,611 | 0.15 | $12,822 |
| 9 | $0 | $90,720 | $259,331 | 0.17 | $272,153 |
| 10 | $0 | $112,255 | $371,585 | 0.19 | $643,738 |
| 11 | $0 | $136,080 | $507,665 | 0.21 | $151,404 |
| Net present value = $608,085 | |||||
| Benefit:cost ratio = 1.521 | |||||
The Casey tree calculator website says the values are a first guess and represent imperfect knowledge. Consequently, the assumptions made in the calculator could be questioned, but the analysis accepting this limitation results in a positive benefit:cost ratio and points out how research to develop a new tree variety for landscaping could pay for itself—but not at the same potential value of research for an agricultural production system for pecans. There is generally more research money available for production agriculture research than for landscape research, and this analysis shows why that is the case. Also, this analysis shows why the average benefit:cost ratio for agricultural research is only 10 (Fuglie and Heisey, 2007).
Project of Alfalfa Variety
The third CRIS project represents crop field trials that were conducted at New Mexico State University’s Agricultural Science Center in Farmington, NM, and three other NMSU Agricultural Science Centers. Figure 2 indicates that, except for Harrington wheat, the adoption rate should rise for four years to a maximum of 30%, stay constant for two years, and then decline to 0% over the next four years. The input file of costs was based on the expenditures for research at the four sites, including labor, equipment, fertilizer, herbicide, and the return from the entry fee paid by commercial breeding programs for alfalfa (Table 4).
Table 4. Input Information for Economic Spreadsheet of Alfalfa Variety Trial Research.
| Operational Costs | Value |
| Labor at four sites | $68,000 |
| Equipment at four sites | $4,000 |
| Fertilizer at four sites | $300 |
| Herbicide at four sites | $100 |
| Total input costs at four sites | $72,400 |
| Entry fee paid by private company at four sites | − $10,800 |
| Inputs less entry fee | $61,600 |
| Potential yield change (ton/ac) | 3.8 |
| Value of yield (per ton) | $140 |
| Area affected in New Mexico (ac) | 245,000 |
| Value of environmental benefits | 0 |
| Interest rate | 5% |
A comparison was made between the yields of the top alfalfa varieties (Table 5) minus the average state yield for the four locations of Las Cruces, Artesia, Los Lunas, and Farmington, all in New Mexico. Consequently, this project represents a large-scale state project consisting of four individual CRIS projects across sites.
Table 5. Years, Expenses, and Income of Alfalfa Yield Trials at Four Locations in New Mexico.
| Year | Expenses | ------------- Income ------------- | ||
| Profits from increased forage yield |
Adoption | Total current value |
||
| 1 | $61,600 | $0 | 0.00 | − $61,600 |
| 2 | $61,600 | $9,826,950 | 0.08 | $9,703,750 |
| 3 | $61,600 | $19,653,900 | 0.15 | $29,296,050 |
| 4 | $61,600 | $29,480,850 | 0.23 | $58,715,300 |
| 5 | $61,600 | $39,307,800 | 0.30 | $97,961,500 |
| 6 | $61,600 | $39,307,800 | 0.30 | $137,207,700 |
| 7 | $61,600 | $30,135,980 | 0.23 | $167,282,080 |
| 8 | $61,600 | $19,653,900 | 0.15 | $186,874,380 |
| 9 | $61,600 | $9,826,950 | 0.08 | $196,639,730 |
| 10 | $61,600 | $0 | 0.00 | $196,578,130 |
| Net present value = $150,854,347 | ||||
| Benefit:cost ratio = 244.89 | ||||
The benefit:cost ratio is 245 (Table 5), the highest of the three projects investigated. This supports the concept that variety trials have one of the highest paybacks of any agricultural research. Research on development of new alfalfa varieties is conducted both by private industry and universities. The cost of a commercial release of a new alfalfa variety is estimated at $60,000 for a breeding program that develops varieties for a large geographic area. Consequently, if the life expectancy of a new variety is 10 years and the variety trial needs a minimum of 10 varieties, a new variety must be developed every year at a cost of $60,000. If this cost is added into the fixed cost of the field trial research, the benefit:cost ratio decreases to 123, still higher than the other types of research described in this paper. Consequently, breeding research and crop field trials that result in the adoption of new varieties represent the highest return on agricultural research and are the reason that private industry is conducting this type of research for profit rather than other types of research conducted by U.S. universities’ agricultural experiment stations.
None of the analysis requires complicated economic knowledge, just a basic understanding of the cost of a project and the potential benefits. Most researchers would be surprised if they were to undertake an economic analysis of their research. Some would be disappointed because the analysis would suggest that they should spend their energy on other types of research, but as is the case of the pecan research and the field trial research, some researchers would find that the research was much more valuable than they could ever imagine and much higher than the average return on agricultural research. If a grant-funding agency or state legislature required an economic cost-benefit analysis on applied research proposals, then perhaps society could increase its return on tax-based research dollars.
Conclusion
The use of an economic spreadsheet provides a mechanism to determine what benefits result from research and what economic benefits can be derived from changes brought about by knowledge gained from the research. A benefit:cost ratio and a net present value economic analysis for most applied research are easy to compute with a net present value Excel calculator. When the economic analysis must include a large number of environmental values, more time and effort and more expertise are needed to conduct the analysis, but an economic analysis is still possible. The diffusion process that determines the rate of adoption of the research results is the most difficult analysis component because, although there are analyses of adoption, rates vary considerably depending on the cost, risk, learning curve to use the technology, and social, political, and institutional regulations that encourage or discourage the adoption of the technology. The ability to identify and work with all of the active earlier adoptors affects the rate of adoption. The economic analysis shows that increasing the rate and total adoption usage could greatly increase the value of the research. Consequently, more resources are required to effectively transfer research knowledge using cost-effective diffusion methods. The economic tool, if used as part of a research proposal submission, could give reviewers another method to rank the research proposal and select those proposals that not only propose good science but also have a potential reasonable return on investment for taxpayers.
Acknowledgement
The work was supported in part by New Mexico State University’s Agricultural Experiment Station and the U.S. Department of Agriculture.
References
Al-Jamal, M.S., T.W. Sammis, and S. Ball. 2001. A case study for adopting the chloride technique for evaluating irrigation efficiency and nitrate-nitrogen to groundwater in farmers’ fields. Applied Engineering in Agriculture, 17, 601–610.
Alston, J.M., J.M. Beddow, and P.G. Pardey. n.d. Agricultural research, productivity, and food commodity prices [Online]. Retrieved March 13, 2013.
Angwin, J. 2001. Consumer Internet adoption rate slows mimicking patterns of past technologies [Online]. Retrieved March 13, 2013, from http://online.wsj.com/article/SB99523194427492031.html
Argyris, C., and D. Schön. 1978. Organizational learning: A theory of action perspective. Reading, MA: Addison-Wesley.
Arrow, K.J. 1974. Limited knowledge and economic analysis. The American Economic Review, 64, 159–178.
Bosch, D.J., N.L. Powell, and F.S. Wright. 1992. An economic comparison of subsurface microirrigation with center pivot sprinkler system. Journal of Production Agriculture, 5, 431–437.
Brock, B.G., J.H. Canterberry, and G.C. Naderman. n.d. Ten milestones in conservation tillage: History and role in the North Carolina conservation program [Online]. Retrieved March 13, 2013, from http://www.soil.ncsu.edu/about/century/tenmilestones.html
Bsoul, E., R. St. Hilaire, and D. VanLeeuwen. 2006. Bigtooth maples exposed to asynchronous cyclic irrigation show provenance differences in drought adaptation mechanisms. Journal of the American Society for Horticultural Science, 131, 459–468.
Bultena, G.L., and E.O. Hoiberg. 1983. Factors affecting farmers’ adoption of conservation tillage. Journal of Soil and Water Conservation, 38, 281–284.
Carmin, J., N. Darnall, and J. Mil-Homens. 2003. Stakeholder involvement in the design of U.S. voluntary environmental programs: Does sponsorship matter? The Policy Studies Journal, 31, 527–543.
Casey Trees. n.d. Tree benefit calculator [Online]. Retrieved March 13, 2013, from http://www.treebenefits.com/calculator/
Conservation Technology Information Center (CTIC). 2013. Crop residue management survey data for the United States (1994-2004) [Online]. Retrieved March 13, 2013, from http://www.ctic.purdue.edu/
Fierce Healthcare. 2010. EMR use inches up in physician offices [Online]. Retrieved May 5, 2011, from http://www.fierceemr.com/story/emr-use-inches-physician-offices/2010-02-18
Fuglie, K.O., and P.W. Heisey. 2007. Economic returns to public agricultural research [Economic Brief Number 10]. U.S. Department of Agriculture, Economic Research Service.
Furberg, M., and K. Preston. 2005. Health and air quality 2005 — Phase 2: Valuation of health impacts from air quality in the lower Fraser Valley airshed [Online]. Retrieved March 13, 2013.
Hill, K. 2006. Universities in the U.S. national innovation system [Online]. Retrieved March 13, 2013.
HowFindAjob.com. n.d. Over 57 percent of American homes have access to high-speed Internet service [Online]. Retrieved March 13, 2013, from http://www.howfindajob.com/over-57-percent-of-american-homes-have-access-to-high-speed-internet-service/
Huffman, W.E., and R.E. Evenson. 1993. Science for agriculture: A long-term perspective. Ames: Iowa State University Press.
Hayami, Y., and V.M. Ruttan. 1985. Agricultural development: An international perspective. Baltimore: Johns Hopkins University Press.
Lang, J., and S.C. Wood. 1999. Development of orphan vaccines: An industry perspective. Emerging Infectious Diseases, 5, 749–756.
Lovejoy, S., and T. Napier. 1986. Conserving soil: Sociology insight. Journal of Soil and Water Conservation, 41, 304–310.
Masters, W.A. 1996. The economic impact of agricultural research: A practical guide [Online]. Retrieved March 13, 2013.
Maple-trees.com. n.d. Canyon or bigtooth maple [Online]. Retrieved March 13, 2013, from http://www.maple-trees.com/pages/canyon-maple.php
Microsoft. 2009. Net present value calculator [Online]. Retrieved March 13, 2013, from http://office.microsoft.com/en-us/templates/TC100152681033.aspx?CategoryID=CT101444811033&AxInstalled=1&c=0
Mississippi State University. n.d. Cotton crop loss data [Online]. Retrieved March 13, 2013, from http://www.entomology.msstate.edu/resources/cottoncrop.asp
Miller, D. 1992. Environmental fit versus internal fit. Organization Science, 3, 159–178.
Nelson, R. 1959. The simple economics of basic scientific research. The Journal of Political Economy, 67, 297–306.
New Mexico Department of Agriculture. 2007. New Mexico agricultural statistics 2007 [Online]. Retrieved March 13, 2013, from http://www.nass.usda.gov/Statistics_by_State/New_Mexico/
Rancho Viejo. n.d. Retrieved May 5, 2011 from http://www.ranchoviejo.com/articles/rancho-viejo-solar-home
Rogers, E. 1995. Diffusion of innovations. New York: The Free Press.
Sunding, D., and D. Zilberman. 2001. The agricultural innovation process: Research and technology adoption in a changing agricultural sector. In B.L. Gardner and G.C. Rausser (Eds.), The Handbook of Agricultural Economics (pp. 707–728). Amsterdam: Elsevier.
U.S. Department of Energy, Office of Biological and Environmental Research. 2010. Biological & environmental research abstracts database. Retrieved March 13, 2013.
USDA. 2009a. Current Research Information System (CRIS). Retrieved March 13, 2013.
USDA. 2009b. U.S. Department of Agriculture irrigation survey [Online]. Retrieved March 13, 2013, from http://www.agcensus.usda.gov/Publications/Irrigation_Survey/
Welsch, H. 2006. Environment and happiness: Valuation of air pollution using life satisfaction data. Ecological Economics, 58, 801–813.
Wang, J., D.R. Miller, T.W. Sammis, V.P. Gutschick, L.J. Simmons, and A.A. Andales. 2007. Energy balance measurements and a simple model for estimating pecan water use efficiency. Agricultural Water Management, 91, 92–101.
Wilson, M., and S. Carpenter. 1999. Economic valuation of freshwater ecosystem services in the United States: 1971–1997. Ecological Applications, 9, 772–783.
To find more resources for your business, home, or family, visit the College of Agricultural, Consumer and Environmental Sciences on the World Wide Web at aces.nmsu.edu.
Contents of publications may be freely reproduced for educational purposes. All other rights reserved. For permission to use publications for other purposes, contact pubs@nmsu.edu or the authors listed on the publication.
New Mexico State University is an equal opportunity/affirmative action employer and educator. NMSU and the U.S. Department of Agriculture cooperating.
Printed and electronically distributed May 2013, Las Cruces, NM.