Research Report 778
Skyla Cockerham, William Gorman, Niels Maness, and Jay Lillywhite
College of Agricultural, Consumer and Environmental Sciences, New Mexico State University
Authors: Respectively, Graduate Research Assistant, Department of Agricultural Economics and Agricultural Business, New Mexico State University; Professor Emeritus, Department of Agricultural Economics and Agricultural Business, NMSU; Professor, Department of Horticulture and Landscape Architecture, Oklahoma State University; and Professor, Department of Agricultural Economics and Agricultural Business, NMSU.
Abstract
This study examines the feasibility of locating and operating a 2-million-pound-capacity pecan processing facility using a new extraction technology in southern New Mexico. The extraction technology is called the Oklahoma State University/ATEP process, which involves propane solvent extraction to produce two products: pecan oil and a de-fatted gluten-free pecan flour. We completed an in-depth market analysis, consumer product research, financial analysis, and sensitivity analysis. This project appears to be financially feasible, with a projected internal rate of return (IRR) of 18% over a 20-year project life based on paying $4.22 per pound for pecans. However, the price of pecans increased by nearly 40% in 2010 due to a large increase in exports of pecans to China. The IRR approaches zero with current prices of nearly $6.00 per pound. Therefore, it is recommended to delay the investment in such a facility until prices stabilize.
Introduction
This study seeks to provide an alternative market outlet for pecan producers. This study was based on using a new technology that extracts the oil from pecans to produce two final products: pecan oil and pecan flour. Specifically, this study focuses on the extraction process developed by Ambient Temperature Extraction Partners in cooperation with Oklahoma State University (OSU). The process yields 100% pure oil, which is low in saturated fat and high in heart-healthy unsaturated fatty acids, and de-fatted gluten-free pecan flour. These two ready-for-market products can be sold in the specialty gourmet food industry.
More U.S. consumers are purchasing foods to improve their physical and mental well-being, including heart-healthy and cancer-preventative products (Pirovano, 2010). They are also buying more specialty gourmet foods, particularly coffee, chocolate, specialty oils, cheese, and soft drinks (Wolfe, 2010). Sales of gluten-free products rose by 16% from 2009 to 2010 (Pirovano, 2010). These trends provide an opportunity to position pecan oil and flour in expanding markets.
Methods of Producing Pecan Oil and Flour
There are several techniques for extracting oil from pecans and similar nuts. The three that were considered were 1) mechanical extrusion, 2) traditional solvent extraction methods, and 3) a new solvent extraction method involving propane, referred to as the Oklahoma State University/Ambient Temperature Extraction Partners (OSU/ATEP) process.
Mechanical extrusion is the process of obtaining oil by pressing nuts with a screw press or expeller. This process is relatively simple and is not capital-intensive. The few companies that currently sell pecan oil utilize a screw-press process capable of extracting no more than 65 to 75% of the oil, which then requires filtering and refining, thus eliminating the pecan flavor (Walsh, 2009). This type of extraction is used by low-volume producers and generates heat, which can impair the flavor and nutritive value. The co-product of the screw-pressed pecan oil is a high-fat pecan meal that is high in calories and not shelf stable without refrigeration. Thus, it is not a suitable baking flour substitute. The majority of screw press machines contain moving parts, and maintenance is very expensive (Schumacher, 2007; Dunford, 2008).
The other method of extraction is solvent extraction in which oil is separated by way of a liquid solvent, such as hexane or supercritical carbon dioxide. In this process, the solvent solution solubilizes the oil in the oilseed and then passes through an extractor that filters the solution from the meal. The oil and meal are further processed to separate them from the solvent. This type of extraction is efficient and allows for bulk production.
Hexane extraction methods are not certified for use in organic products because of hexane’s potential carcinogenic and neurotoxic properties (Cornucopia Institute, 2010). Consumers of natural and organic foods make up a large portion of the market for pecan oil and flour, thus eliminating the option of using hexane extraction methods.
The supercritical carbon dioxide technique has been considered the next best alternative for extraction because there is no pollution. A disadvantage of this technique is the large capital cost of the extractor vessels, as well as high costs due to the large amount of energy needed to compress the CO2 into a liquid (Schumacher, 2007). However, the CO2 is recycled back through the system, which is a cost-saving advantage (Dunford, 2008).
The process selected for use in this feasibility study was an emerging technology developed by Ambient Temperature Extraction Partners and refined for use with pecans by Niels Maness, professor at OSU. This extraction process, referred to as the OSU/ATEP process, separates the oil from the pecan meat using propane (Maness, personal communication). Ambient Temperature Extraction Partners, LLC, is the company that owns the rights to this process.
The OSU/ATEP process falls under the solvent method of extraction; however, unlike hexane, propane is a non-carcinogenic and non-neurotoxic chemical. This method is cost-efficient because it removes nearly 100% of the oil, resulting in pure oil and a dry, defatted flour product. It was chosen for this study because it yields two marketable products. As with the supercritical carbon dioxide technique, there is no residual solvent left in the oil, and the propane is recycled back through the system. The propane method requires less energy to operate and is conducted with lower pressure and temperature than the supercritical carbon dioxide technique (Maness, personal communication). This process is approved by the USDA and meets the increasingly rigid health and environmental regulations.
Production of Pecan Oil and Flour for Research
The OSU/ATEP process is not yet available for commercial production. New Mexico State University (NMSU) sent a sample of New Mexico pecans to OSU’s Department of Horticulture and Landscape Architecture labs for extraction using their pilot production facilities. Samples of the roasted and non-roasted oil and flour were sent to Silliker Commercial Labs in Chicago for an independent nutritional analysis (Silliker, 2010). The remaining oil and flour were sent to NMSU for use in market research.
Product Description
Pecans are made up of about 65 to 75% oil, depending on location, variety, and growing conditions. Pecan oil consists of mostly unsaturated fats, with oleic (omega-9) and linoleic (omega-6) acids accounting for the largest portion (Toro-Vazquez et al., 1999). The OSU/ATEP process yielded 68% oil and 32% dry defatted gluten-free flour from the raw pecan nuts used in this study. The pecan oil is 100% pure, thus eliminating the need for filtering or other refinement, and is high in unsaturated fats, important omega acids, antioxidants, and vitamin E. The dry defatted gluten-free flour is high in fiber, iron, and calcium, making it a highly desirable flour substitute. These two products are superior in nutritive value compared to most competing products.
Pecan Oil
The pecan oil’s main competitors in the market are expected to be virgin olive oil and other gourmet specialty oils. According to Silliker’s laboratory analysis, the pecan oil derived from the OSU/ATEP extraction process has 40% less saturated fat than olive oil and three times the amount of “good” polyunsaturated fats, including omega-3s and -6s (Silliker, 2010) (Table 1). Pecan oil also has three times as much Vitamin E as virgin olive oil.
Table 1. Comparison of Oil Benefits
| Attributes (serving size 1 Tbsp) | Pecan Oila |
Virgin Olive Oilb |
Grapeseed Oilb |
Walnut Oilb |
| Calories per serving | 126 | 120 | 119 | 119 |
| Saturated fats | 8.37% | 13.81% | 9.63% | 9.1% |
| Monounsaturated fats (Omega-9) | 58.25% | 72.96% | 16.30% | 22.8% |
| Polyunsaturated fats (Omega-3 & -6) | 32.94% | 10.52% | 69.63% | 63.3% |
| Omega-3 | 1.28% | 0.76% | 0% | 10.4% |
| Omega-6 | 31.65% | 9.76% | 69.59% | 52.9% |
| Vitamin E (gamma-Tocopherol) | 31.03 mg | 12 mg | 3.9 mg | 0 mg |
| Sources: aSilliker Labs, 2010;bUSDA-ARS, 2011 | ||||
Saturated fats are considered the “bad” fats that tend to raise levels of LDL (bad) cholesterol, while monounsaturated and polyunsaturated are “good” fats that help reduce LDL cholesterol while raising HDL (good) cholesterol. All the fatty acids as well as omega-3s, -6s, and -9s are important in a healthful diet; however, omega-3s and -6s are considered essential because our bodies cannot produce these and, therefore, they must be obtained from food or supplements. The body generally produces sufficient omega-9 (American Heart Association, 2011).
It is imperative that these three fatty acids be consumed in balance in order to be most beneficial. Even though grapeseed and walnut oil are good oils that are high in these essential fatty acids, pecan oil is the most balanced oil, with sufficient amounts of all fatty acids as well as a high amount of vitamin E. Vitamin E provides many health benefits, chief among which are anti-inflammatory properties that alleviate and prevent degenerative diseases.
The pecan oil can be produced with a roasted or non-roasted flavor. The raw pecan nuts are roasted before extraction in order to obtain the roasted flavor. Both oil products have identical nutritional characteristics but provide different flavor and aroma profiles. Pecan oil is an ideal healthful choice that can be used in salad dressings and in cooking.
Pecan Flour
Currently, defatted pecan flour is not available in the market. The defatted pecan flour product produced from the OSU/ATEP process is gluten-free and highly nutritious. This pecan flour has fewer calories and carbohydrates, more protein, more iron, and a higher percentage of fiber than rice flour (Table 2). Rice flour is a common flour substitute used by consumers who cannot tolerate wheat gluten; however, it lacks nutritive value compared to pecan flour. As shown in Table 2, rice flour is comprised mostly of carbohydrates.
Table 2. Comparison of Flour Benefits
| Attributes (serving size 36 g) | Pecan Floura | Rice Flourb |
| Calories per serving | 115 | 135 |
| Protein per serving | 15 g | 2 g |
| Carbohydrates per serving | 13 g | 29 g |
| Dietary fiber | 7 g | 1 g |
| Fiber % daily value | 28% | 4% |
| Iron % daily value | 20% | 0% |
| Calcium % daily value | 6% | 0% |
| 100% gluten-free | yes | yes |
| Sources: aSilliker Labs, 2010;bUSDA-ARS, 2011 | ||
Market Assessment
We expect the pecan oil and flour will have market potential when sold in consumer-sized packages to retail grocery shoppers. The products also have potential to be sold to food service distributors that supply restaurants. We evaluated both of these potential markets. Survey results and discussions with food service companies and restaurants indicated that selling to the restaurant segment presented greater marketing challenges than selling to consumers shopping in retail food stores. Consumers shopping in retail stores can be educated about the branded products through labels on packages and other forms of advertising, whereas restaurants use the products as ingredients in dishes with little information conveyed to consumers about the ingredients used. Also, many restaurant patrons, particularly those intolerant to gluten, tend not to trust meals prepared in restaurants. Therefore, the following marketing plan is based on selling through retail food stores.
Product Positioning
Pecan oil would be positioned as a healthful specialty gourmet product because pecan nuts are relatively expensive compared to most vegetable sources used for making salad and cooking oils. Also, there is not a sufficient supply of appropriate-sized pecan nuts to produce low-cost oil for the mass market. Pecan flour would be positioned as a healthful gluten-free alternative to wheat flour.
Industry Description and Market Size
According to the Nielsen Company, sales of food products advertising heart-healthy claims involving omega fatty acids increased by 42% from 2008 to 2009. During the same time period, food products claiming high antioxidant content also increased by 29% (Pirovano, 2010).
Sales of gluten-free products in the U.S. rose 74% from 2004 to 2009, and are estimated to increase another 15 to 25% by 2011, with annual revenues of $2.6 billion (Pirovano, 2010). Over 40 million consumers seek out gluten-free products when shopping because their digestive systems do not tolerate gluten or for weight loss reasons. Approximately 15 million Americans are intolerant to gluten, and 3 million have been diagnosed with celiac disease and cannot tolerate any gluten in their diet (Living Without, 2011).
In recent years, retail sales of gourmet foods have grown at a faster rate than the overall food industry, and specialty oils are among the five best performers (Wolfe, 2010). Food industry sources estimate sales of gourmet salad and cooking oils in the U.S. will total $424 million in 2013. Gourmet olive oil sales, the market leader, are forecasted at 85% of this market, with annual revenues of $360 million. Sales of a wide array of specialty nut and vegetable oils make up the remaining 15%, or $64 million.
Market Segments
The primary target market segment for pecan oil is consumers that follow a healthful eating lifestyle. The healthful eating lifestyle segment is made up of the 82 million Americans with one or more cardiovascular diseases and consumers of all ages that focus on healthful eating (Roger et al., 2011). Consumers in this segment have average annual household incomes of $70,000, 84% of the purchasers are female, and the majority have attended college (Healthy Cooking, 2010). A secondary market segment is consumers that seek out unique gourmet food products, particularly for home entertainment.
The primary target market for pecan flour is consumers following a gluten-free lifestyle. Most gluten-free lifestyle consumers have a college degree and average annual household incomes of more than $80,000, and they are active followers of social networking sites for information on gluten-free cooking (Living Without, 2011).
Key Market Influencers
Dieticians, celebrity chefs, health professionals, and the mainstream television media with their daily food and health stories are key influencers in this industry. Consumers’ word of mouth influences at least 50% of new food product purchases and, thus, is important in expanding information on healthful food products (Bughin et al., 2010).
Analysis of Market Competition
Pecan oil will be competing with gourmet olive oil, gourmet specialty oils, and other pecan oils for a share of the $424 million gourmet salad and cooking oil annual market.
Olive Oil
Gourmet olive oil sales are the industry leader, with prices ranging from $12 to over $30 for a 500-ml bottle. This market has been supplied primarily by imports from Italy, Spain, and other European countries, with many American companies, including olive companies in California, entering the market in recent years. These high-priced oils are generally not used for deep frying. Gourmet olive oils are sold in most U.S. grocery stores.
Much of the substantial growth of olive oil sales in the U.S. during the last decade has been attributed to public awareness of its health benefits. Popular chefs with cooking shows have also promoted olive oil by educating their audiences on the health benefits of using olive oil.
Specialty Oils
Walnut, pumpkin seed, avocado, sunflower, grapeseed, almond, and many other oils make up the specialty oil segment. Several, but not all, of these oils are heart-healthy and are low in saturated fats. Health food, gourmet specialty food, and many mainline supermarkets typically carry several of these specialty oils. The consumption of these oils is increasing and together is projected to have a $64 million market by 2013.
Other Pecan Oils
Kinloch, La Tourangelle, and Delta are currently three leading pecan oils on the U.S. market. Kinloch and Delta focus exclusively on marketing pecan oil, whereas La Tourangelle, a French company with operations in California, markets a wide array of food oils. Annual sales information for these companies is not available, but based on discussions with specialty product food wholesalers, their combined sales of pecan oil probably do not exceed $2 million annually. These oils are not available in most retail food stores. Most of their sales are through the Internet and select retail stores located in pecan-growing regions. They do not have large budgets for advertising and promotion programs directed toward selling pecan oil.
Market Share—Pecan Oil
We expect a 2-million-pound-capacity pecan nut extraction plant (the size selected for this feasibility analysis) to have pecan oil sales of $7 to $11 million dollars annually depending upon selling prices. This represents about 2.6% of the total gourmet oil market, 3% of virgin olive oils, and about 17% of the other specialty oil sales. These market shares are modest and should be achievable assuming an aggressive marketing plan.
Since olive oil dominates the market, one would expect that most of the market share for a new pecan oil company would come at the expense of olive oil sales. However, since the market for gourmet food oils (including olive oil) is growing, any new, relatively small competitor should not have a substantial impact on current sales of existing olive oil companies.
Market Share—Pecan Flour
Gluten-free flour products are an underserved market. Most of the products currently in the market are lacking in healthful nutrients, do not provide desirable tasting products, or are high in fat content. Discussions with gluten-free consumers and food retailers indicate that there is a large market for the healthful defatted pecan flour.
Consumer Product Research
The NMSU research team worked with the two products to develop recipes for their uses. The pecan oil proved to be an ideal ingredient in salad dressings and sauteing meats and vegetables. The pecan flavor was very distinct and complimented the other flavors in the dressings.
The NMSU research team conducted a group consumer survey with 41 participants on the NMSU campus. Participants were asked to taste products, evaluate nutritional information, and answer a series of questions. The oil taste tests included a blind taste comparison between olive oil and pecan oil, roasted versus non-roasted pecan oil, and salad dressings made with pecan oil. Out of 41 participants, 31 indicated they preferred pecan oil over olive oil during the blind taste testing. After participants were given nutritional information for both products, eight out of the 10 who had previously chosen olive oil changed their preference to pecan oil, demonstrating that nutritional information can influence consumer decisions.
Overall, the test group participants indicated high satisfaction with pecan oil used in bread dipping and in salad dressings.
The pecan flour was used to develop recipes for a variety of gluten-free baked goods, including pancakes, sugar cookies, and breads.
During the same consumer survey at NMSU, participants were asked to taste three different recipes made with pecan flour: pancakes, bread, and sugar cookies. One of the main concerns of gluten-intolerant consumers is the difficulty of finding a tasty flour substitute that mimics the consistency of wheat flour. Ten out of the 41 participants followed a gluten-free lifestyle and indicated that the three products made with pecan flour were exceptionally better in texture and taste than those made from other gluten-free flours they currently use or have tried.
With these results, it is apparent that there is a large interest in these two products on the part of consumers. These results, however, could be biased because all of the participants were New Mexico residents. Because they are new products and consumers know nothing about them, an aggressive advertising and promotional plan will be needed in launching these two products.
Retail Packaging
A 2-million-pound-capacity raw product processing facility will produce approximately 160,000 cases of oil and 140,000 cases of flour. Using suggestions from retailers and wholesalers, this study assumed packaging the oil in two sizes, 250-ml and 500-ml glass bottles, both packed 12 to a case. The flour will be packed in 12-ounce clear plastic bags with six to a case.
Estimated Sales Per Store
Health and gourmet food retailers estimated that pecan oil, being a new product, would probably sell about four cases per month per store on average. Pecan flour sales would also average about four cases per month per store. Using these estimates, the oil and flour products would have to be placed in approximately 2,800 stores, assuming the processing facility is operating at full capacity. The most practical way of reaching this many stores is through selected wholesale distributors.
The primary targets for our gourmet pecan oil and flour will be specialty food stores, including food co-ops, health and natural food stores, and gourmet food stores in the U.S. According to the U.S. Census Bureau’s Statistical Abstract of the United States: 2011, there were approximately 28,300 specialty food stores in 2007 (U.S. Census Bureau, 2011). The total annual sales were estimated at $19 billion in 2009 (U.S. Census Bureau, 2010). These stores would be the primary target for the pecan oil and flour products since they specialize in gourmet and local food items.
Pricing
Since the pecan flour is a new product in the market, there is no established retail price; a retail price for the pecan oil can be estimated based on current market prices for existing pecan oils. Positioned in the gourmet category, pecan oil and flour sales volumes are not expected to be highly related to prices. Discussions with health and gourmet food retailers suggested that a retail price point could range from $9.99 to $13.99 for pecan oil packaged in a 250-ml bottle and from $16.99 to $21.99 for a 500-ml bottle. This price range is in line with the lower end of gourmet virgin olive oils and specialty nut and vegetable oils.
The retail price range suggested for pecan flour packaged in a 12-ounce plastic bag could range from $8.99 to $13.99, which is slightly higher than rice flour but on the low end of other gluten-free flour and meal products. The typical gross margins charged by wholesalers for handling gourmet products range from 15 to 25%, and retail gross margins range from 35 to 40%.
Assuming the decision is to price the 250-ml oil product at $9.99 at retail and the 500-ml oil product at $16.99 at retail, the selling price from the processing plant to the wholesalers would be $4.91 for the 250-ml and $8.36 for the 500-ml. Assuming the flour sells $9.99 at retail, the price received by the processing plant would be $4.91 for the 12-ounce package. These prices are assumed by using a wholesale gross margin of 18% and a retail gross margin of 40%.
These prices were used as base prices for this feasibility study. The sensitivity analysis discussed later measures the impact of price changes on profitability.
Sales Projections
Sales projections are based on the prices received at the processing plant. These projections assume all product produced in that year will be sold that year. The number of stores carrying product will be 2,000 stores in Year 1, 2,400 stores in Year 2, and 2,800 stores by Year 3. Achieving these store goals would result in the sales projections as seen in Table 3. Total sales are approximately $9 million in Year 1 and increase to $15.5 million in Year 3.
Table 3. Sales Projections
| Year 1 | Year 2 | Year 3 | |
| Oil Sales | $6,682,930 | $9,136,163 | $11,430,156 |
| Flour Sales | $2,389,992 | $3,270,125 | $4,091,339 |
| Total | $9,072,921 | $12,406,289 | $15,521,496 |
Advertising and Promotional Plan
Launching a new consumer product where almost all potential consumers have not heard of nor tasted the products requires a substantial advertising and promotional program, beginning with the launch of the products (Table 4). The advertising program budget focuses on a combination of print advertisements in magazines read by consumers in the targeted market segments, fees charged by the advertising agency, and social media advertising, including developing advertisements for social networking sites.
Table 4. Advertising and Promotion Expenses
| Year 0 | Year 1 | Year 2 | Year 3 | |
| Print Advertising Living Without Gluten-Free Living |
$ – $ – |
$19,985 $9,600 |
$19,985 $9,600 |
$19,985 $9,600 |
| Miscellaneous Advertising Ad Development Ad Agency Commissions/Media Kit Internet Ads |
$ – $ – $ – |
$30,000 $50,000 $60,000 |
$30,000 $50,000 $60,000 |
$30,000 $50,000 $60,000 |
| Total Advertising | $ – | $149,585 | $159,585 | $169,585 |
| Promotional Activities Television Cooking Show Sponsor House Party Program Free Product to Retail Stores Coupons Website Recipe Development & Distribution Trade Show: Celiac Show Miscellaneous Promotions |
$ – $ – $ – $ – $ – $ – $ – $15,000 |
$200,000 $168,832 $211,659 $60,000 $15,000 $50,000 $20,000 $100,000 |
$200,000 $84,055 $41,610 $48,000 $10,000 $20,000 $20,000 $100,000 |
$200,000 $83,856 $41,212 $40,000 $10,000 $20,000 $20,000 $100,000 |
| Donations American Heart Association Celiac Disease Foundation |
$ – $ – |
$56,782 $25,088 |
$75,709 $33,451 |
$94,637 $41,813 |
| Total Donations and Promotional | $ – | $907,361 | $632,825 | $651,518 |
| Total Advertising and Promotional | $15,000 | $1,056,946 | $792,410 | $821,103 |
The funds allocated in the proposed promotional program include sponsoring a television cooking show and conducting house parties during the launch phase. The television cooking show that will feature the oil and flour products is one of the largest expenses in the promotional budget. Sponsoring TV cooking shows with a popular chef has proven to be a highly effective method of getting consumers to try healthful new food products.
During the initial months, generating product awareness will be key. This will be done by hosting 1,000 house parties in Year 1 and 500 each in Years 2 and 3. The house party program is designed to create word-of-mouth advertising. The 1,000 house parties scheduled primarily in medium- and higher-income urban areas during the first week of the product launch are expected to inform over 90,000 consumers of the benefits of the oil and flour products within two weeks. The company can contract with a business that provides house party services, which will provide and coordinate the 1,000 party hosts.
Distribution of a free case of product to 2,500 stores in Year 1 and an additional 500 stores each in Years 2 and 3 is necessary to get the products stocked in retail stores at the beginning of the products’ launch period. This program would be coordinated by wholesalers distributing to specialty stores and is often used for low-volume gourmet items in lieu of slotting allowances. Free product distribution is the biggest expense in the promotional budget during the Year 1, totaling $211,659.
Other features of the promotional program include participating in a trade show for gluten-free products, coupons as a part of web advertisements, and recipe development. Another major portion of the promotional program goes to donations to the American Heart Association and the Celiac Disease Foundation. According to research done at New Mexico State University, U.S. consumers are willing to pay premiums for a cooking oil product that has a social cause attribute. Research concluded that consumers are willing to pay $1.72 more for a product that donates to a social cause (McLain, 2011).
Technical Feasibility
Assumptions and Specifications
The general assumptions of the project were:
- Capacity: Two million pounds of shelled raw pecan nuts annually.
- Raw Product: Based on using mostly medium-sized pecan pieces, which are currently sold primarily to food baking companies. Pecan pieces are typically 5 to 10% less expensive than whole halves (Zedan, personal communication).
- Product Output Yields: Sixty eight percent of the raw product weight is oil and 32% is dry defatted flour, less a 2% shrink.
- Licensing Fee: The fee for a nonexclusive license to use the technology is $75,000 per year for a facility of this size.
- Project Life: The project life was designated at 20 years with no salvage value at the end of the period.
- Financing: The study assumes self-financing by one or more large pecan processing companies.
- Location: The feasibility analysis assumes the facility would be built in southern New Mexico, which is central to the large pecan-growing region of the southwest U.S. and northern Mexico.
- Operation: The plant will operate two 8-hour shifts per day for 260 days per year.
The pecan oil and flour production plant in this study would utilize the OSU/ATEP process and is based on a capacity of 2 million pounds of raw pecan nuts annually. After preliminary analysis of a 750,000-pound versus a 2-million-pound facility, the 2-million-pound was chosen because much of the equipment needed for the 750,000-pound facility was capable of processing 2 million pounds and could thus achieve economy of scale benefits (Appendix A).
ATEP owns the intellectual rights to the production technology and charges a licensing fee. The fee for a nonexclusive license is subject to negotiations since a facility using this technology has never been built. Based on preliminary telephone conversations with a representative from ATEP, $75,000 per year was used in this study.
The 20-year project life was chosen because most of the capital investments in equipment, buildings, and facilities are expected to have a useful life of at least 20 years.
Manufacturing Process
The OSU/ATEP process yields pure pecan oil and dry defatted pecan flour through propane extraction. Niels Maness of Oklahoma State University recommended requirements for the manufacturing process and selection of equipment. The manufacturing process as specified in this study will be as follows.
- For non-roasted pecan oil and flour, the raw pecan pieces will first be fed into a hopper, which feeds a slicing machine.
- Conveyor belts then run the sliced pecans through the blast freezer, which freeze the nuts so that, when flaked, the oil remains in the pecan piece.
- The blast freezer provides a quick and uniform freezing of the pecan nutmeats, which are then run through a flaking machine with chilled rollers.
- Flaked pecan nutmeats are conveyed to bins that feed directly into the extractor unit.
- The extraction system is comprised of two 600-liter extractors that have a throughput of 3.85 tons per 16-hour day. The extraction system is housed within an explosion containment structure where the propane is flowing and being vaporized. Specifications for this area are a Class I, Division 2 structure, which would provide protection for surrounding structures in the unlikely event of an explosion.
- The pecan nutmeats are fed through the extractor where liquid propane flows through and efficiently extracts the lipids, or oil, leaving dry defatted flour behind.
- The propane is then vaporized off the oil resulting in 100% pure pecan oil. The propane is recycled back into the system for the next batch of raw pecan nutmeats.
- From the extractor, the pecan oil is conveyed into a 1,000-gallon “day” tank and the flour into two 200-ft2 “day” bins.
- These tanks are unloaded at the start of each day into settling tanks for both the oil and flour that feed the packaging equipment.
- The oil is then run through a bottling machine that labels and caps the bottles. A worker will pack 12 bottles to a case.
- The pecan flour is pneumatically conveyed to the flour packaging machine and packaged in plastic 12-ounce bags packed 6 to a case.
- The finished product will be stored in a chilled warehouse with at least a two-week supply in stock. This warehouse is where all order filling and shipping will take place. A two-week supply of raw pecan nuts will also be stored in this warehouse.
The process for manufacturing roasted pecan oil and flour products involves sending the raw nutmeats through the slicer and then through a roaster to obtain the roasted flavor profile. The roasted pecans are then run through the rest of the process in the same manner as the non-roasted pecans.
Plant Size and Production Schedule
The pecan oil and flour processing plant is specified to run two 8-hour shifts per day for 260 days per year. At full capacity, the plant can run 2 million pounds of raw pecan nuts through the system each year. For this study, it was assumed that the plant would operate at 60% capacity in Year 1, 80% in Year 2, and at full capacity by Year 3 and thereafter. It was also specified to package half of the pecan oil in 250-ml bottles and half in 500-ml bottles. The unit production schedule in Table 5 reflects these assumptions.
Table 5. Number of Product Packages Produced by Year
| Year 1 | Year 2 | Year 3 | |
| Oil 250-ml bottles 500-ml bottles |
757,093 378,547 |
1,009,458 504,729 |
1,261,822 630,911 |
| Flour 12-oz packages |
501,760 |
669,013 |
836,267 |
Prices of Shelled Pecans
The OSU/ATEP method can be used to process many different nuts and oilseeds; however, the specified input for this study is pecan nuts. When pecans are shelled, they come out either as whole halves or pieces, and the pieces typically sell for less than whole halves (Appendix B, Table B1). These halves and pieces are typically classified into three grades based on the nut size and color of meats, Fancy, Choice, or Standard, with Fancy being the highest quality and Standard the lowest (Crawford, 2009). Historically, Choice grade pecans sell at around $0.10 to $0.15 per pound less than Fancy, and Standard sells at $0.15 to $0.20 per pound less than Choice (Zedan, 2011).
In recent years, prices of pecans have increased drastically because of the rapidly growing demand for U.S. pecans in China. In 2009, 25% of the U.S. pecan crop went to China (Wessel, 2011). The prices in 2010 were 75% higher than they were in 2007, with Fancy junior mammoth halves selling at $6.62 a pound (Appendix B, Table B1). This study was based on using Fancy grade medium pecan nut pieces as the base price. A 5-year average was computed and a price of $4.22 per pound was used as the basis for the raw input price (Table 6).
Table 6. Prices of Medium Pieces by Year
| Fancy Med. Pieces |
Choice Med. Pieces |
Standard Med. Pieces |
|
| 2006 | $4.18 | $4.08 | $3.93 |
| 2007 | $3.46 | $3.36 | $3.21 |
| 2008 | $3.44 | $3.34 | $3.19 |
| 2009 | $4.19 | $4.09 | $3.94 |
| 2010 | $5.85 | $5.75 | $5.60 |
| 5-Year Avg. | $4.22 | $4.12 | $3.97 |
Financial Feasibility
Facility Investment Cost
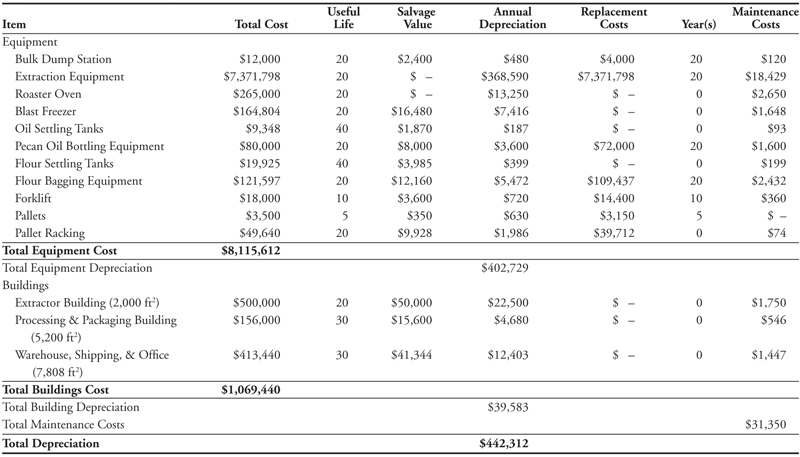
The investment dollars needed for the purchase of land, facilities, equipment, and buildings is estimated at $9,221,052 (Table 7). The equipment makes up the largest part of the initial investment. These consist of the pressurized extractors, slicing machines, roasting oven, bottling line, packaging equipment, and materials handling equipment (Appendix B, Table B2). The costs to transport and install the equipment are included in the equipment category.
Table 7. Capital Investment Summary
| Cost | |
| Land (3 acres) | $36,000 |
| Equipment | $8,115,612 |
| Processing and Packaging Building (5,200 ft2) | $156,000 |
| Extraction Building (2,000 ft2) | $500,000 |
| Warehouse, Shipping, and Office Building (7,808 ft2) | $413,440 |
| Total Initial Investment | $9,221,052 |
Table 7 shows the detailed capital requirements for buildings. Three buildings with an office attached totaling approximately 15,000 square feet are needed. These will be metal buildings set on a concrete foundation with concrete floors.
The processing and packaging building will house all the processing and packaging equipment except the actual extraction equipment. The extractor building will be an explosion containment structure that houses the extractors, compressors, and other equipment to handle the propane. This type of building will be classified at Class I, Division 2 building standards. The warehouse and shipping building will be for raw pecan product storage, finished product storage, shipping, and office facilities. The warehouse will be insulated and cooled to 50 °F to keep raw and finished product shelf stable. This warehouse is sized to hold a one-month supply of finished product and a one-month supply of shelled pecans.
Pro Forma Financial Statements
Pro forma financial statements were prepared for the 2-million-pound capacity processing facility (Tables 8–12). The sales projections in Table 3 were entered into the model using the base prices of $4.91 for the 250-ml bottle of pecan oil, $8.36 for the 500-ml bottle, and $4.91 for the 12-ounce bag of pecan flour. Year 0 is considered the startup period and is dedicated to the construction of all the facilities and purchase of equipment. Some promotional and marketing begins in this year to prepare for the launch of the new products.
Pro Forma Income Statement
Total sales are $9 million in Year 1 and increase to $15.5 million in Years 3 and 4 when the facility levels out at full capacity (Table 8). Gross margin increases from $1,738,388 in Year 1 to $3,318,437 in Year 3.
Table 8. Five-Year Pro Forma Income Statement
| Year 0 | Year 1 | Year 2 | Year 3 | Year 4 | |
| Sales Oil Products Flour Products |
$ – $ – |
$6,682,930 $2,389,992 |
$9,136,163 $3,270,125 |
$11,430,156 $4,091,339 |
$11,430,156 $4,091,339 |
| Total Sales |
$ – | $9,072,921 | $12,406,289 | $15,521,496 | $15,521,496 |
| Cost of Goods Sold | $ – | $7,334,534 | $9,848,534 | $12,203,059 | $12,203,059 |
| Gross Margin | $ – | $1,738,388 | $2,557,755 | $3,318,437 | $3,318,437 |
| Distribution Expense | $ – | $154,055 | $205,407 | $256,759 | $256,759 |
| Marketing Expenses Advertising Promotional Activities Donations Sales Manager Sales Representative Travel Utilities/Telephone/Other |
$ – $15,000 $– $47,500 $– $9,000 $9,000 |
$149,585 $825,491 $81,870 $95,000 $65,000 $30,000 $18,600 |
$159,585 $523,665 $109,160 $100,000 $67,500 $32,000 $19,600 |
$169,585 $515,068 $136,450 $105,000 $70,000 $34,000 $20,600 |
$169,585 $390,000 $136,450 $105,000 $70,000 $34,000 $20,600 |
| Total Marketing Expenses | $80,500 | $1,265,546 | $1,011,510 | $1,050,703 | $925,635 |
| Administration and Overhead Expenses |
$138,170 | $337,598 | $342,670 | $347,741 | $347,741 |
| Amortized Startup Expenses Total Expenses |
$ – $218,670 |
$21,867 $1,779,066 |
$21,867 $1,581,454 |
$21,867 $1,677,070 |
$21,867 $1,552,002 |
| Net Income | $ – | $(40,679) | $976,301 | $1,641,367 | $1,766,435 |
Cost of Goods Manufactured
The cost of goods manufactured is estimated at about $7.5 million in Year 1, increasing to $12,244,271 when in full production in Year 3 (Table 9). The cost of raw pecan nuts is based on purchasing the raw nuts at $4.22 per pound. The cost of raw pecan nuts and the finished product packaging are the two largest expense items, accounting for over 90% of the cost of manufacturing. Bottles, labels, plastic packages for the flour, and cardboard shipping boxes are the major packaging cost items (Appendix B, Table B3).
Table 9. Cost of Goods Sold Schedule
| Year 1 | Year 2 | Year 3 | |
| Cost of Goods Manufactured Raw Pecan Nuts Direct Labor Packaging Supplies Utilities Propane Repairs and Maintenance Miscellaneous Depreciation |
$5,064,000 $310,750 $1,620,170 $83,400 $2,750 $18,810 $4,000 $442,312 |
$6,752,000 $392,500 $2,160,227 $111,200 $825 $25,080 $6,000 $442,312 |
$8,440,000 $482,500 $2,700,284 $139,000 $825 $31,350 $8,000 $442,312 |
| Total Cost of Goods Manufactured | $7,546,192 | $9,890,144 | $12,244,271 |
| Less Cost of Free Product for Promotion | $211,659 | $41,610 | $41,212 |
| Cost of Goods Sold | $7,334,534 | $9,848,534 | $12,203,059 |
The cost of free product given to selected retail stores for promotional purposes has been deducted from the total cost of goods manufactured to give us the cost of goods sold. The value of these free products is included as a promotional expense in the income statement. The cost of goods sold is approximately $7.3 million in Year 1, rising to $12,203,059 in Year 3 (Table 9). Direct labor expenses are based on employing two superintendents and 13 production and shipping employees at full production in Year 3 (Appendix B, Table B4); these costs total $482,500 in Year 3 (Table 9). Depreciation is also accounted for in the cost of goods sold schedule and was calculated assuming a straight-line depreciation method (Appendix B, Table B5).
Distribution Expenses
The feasibility analysis is based on the processing company paying the cost of shipping the oil and flour products to approximately five wholesale distributors serving specialty food stores throughout most of the U.S. The company would also pay the shipping cost to deliver products to distribution centers for a couple of larger retail chains. The distribution expense is calculated at $0.94 per case for the oil and $0.78 per case for the flour. In Year 1, the distribution expense totals $154,055 and increases to $256,759 in Year 3 (Table 8).
Marketing Expenses
Total marketing expenses are $80,500 in the startup Year 0 and rise to approximately $1 million in Year 3 (Table 8). In Year 4, these costs start to decrease as the house party program is no longer needed and awareness of the products increases, therefore requiring fewer advertising and promotional activities. The advertising and promotional activities and donations are shown in Table 4. In addition to these costs, the marketing expenses include the salaries of the sales manager and sales representative as well as travel, utilities, telephone, and miscellaneous costs associated with their positions.
Administrative and Overhead Expenses
Administrative and overhead expenses are estimated at $138,170 in Year 0. These expenses are needed in the startup year in order to get the facilities ready for production at the beginning of Year 1. In Year 1, administrative and overhead expenses total $337,572 and rise to $347,717 in Year 3 (Table 10). The salary of the general manager, the technology licensing fee, and property taxes are the major expense items in this category. The salaries include Social Security, Medicare, workers’ compensation, and some health and retirement benefits. The technology licensing fee is for a non-exclusive license for use of the extraction technology. Property taxes were calculated using the Las Cruces outside-city-limits, non-residential tax rate for 2010.
Table 10. Administrative and Overhead Expenses
| Year 0 | Year 1 | Year 2 | Year 3 | |
| General Manager | $100,000 | $100,000 | $105,000 | $110,000 |
| Technology Licensing Fee | $ – | $75,000 | $75,000 | $75,000 |
| Insurance | $4,500 | $18,000 | $22,000 | $26,000 |
| Property Taxes | $320 | $81,898 | $77,970 | $74,041 |
| Office Assistant (full-time) | $22,050 | $44,100 | $44,100 | $44,100 |
| Accounting/Payroll | $ – | $3,000 | $3,000 | $3,000 |
| Travel | $8,000 | $8,000 | $8,000 | $8,000 |
| Telephone and Utilities | $2,400 | $4,000 | $4,000 | $4,000 |
| Supplies and Miscellaneous | $900 | $3,600 | $3,600 | $3,600 |
| Total Administrative and Overhead Expenses | $138,170 | $337,598 | $342,670 | $347,741 |
Net Income
The expenses in Year 0 are amortized over a ten-year period as they are capitalized as startup expenses (Table 8); these include marketing, administrative, and overhead expenses. As shown in the pro forma income statement in Table 8, the project is forecasted to lose about $41,000 in Year 1 when the plant is only operating at 60% capacity. By Year 3, the net income before taxes is forecasted as $1,641,367 as full production is reached and advertising and promotion expenses decrease slightly. Based on this information, one could conclude that the project has the potential to be financially feasible. However, the income statement was based on the assumption that the project was self-financed by the investors, and therefore no interest expense was included.
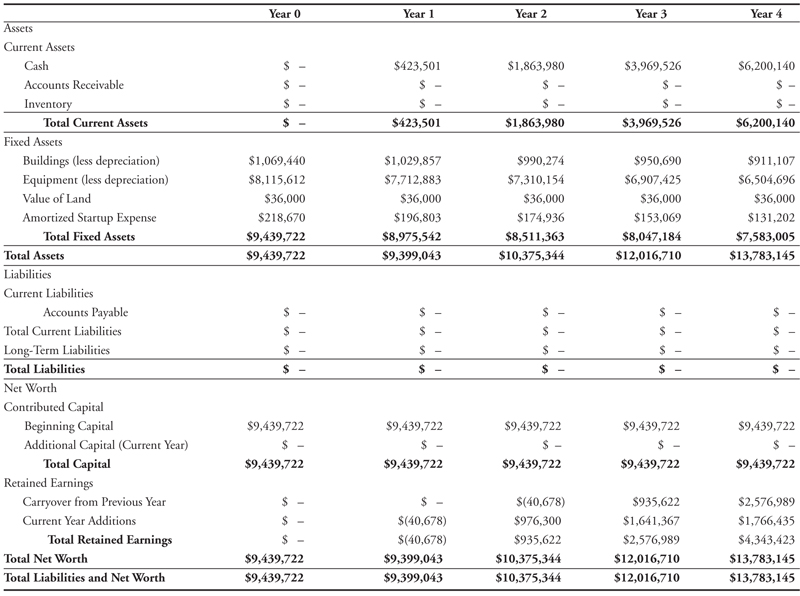
Balance Sheet
Five years of balance sheets are provided in Table 11. All sales were assumed to be cash sales with no accounts receivable or inventory held. The fixed assets section includes all buildings, equipment, and land as well as the amortized startup expenses from Year 0. Buildings, equipment, and startup expenses decrease by the depreciation amount starting in Year 1. This project was also assumed to be self-financed, and therefore there are no liabilities incurred.
Table 11. Five-Year Pro Forma Balance Sheet
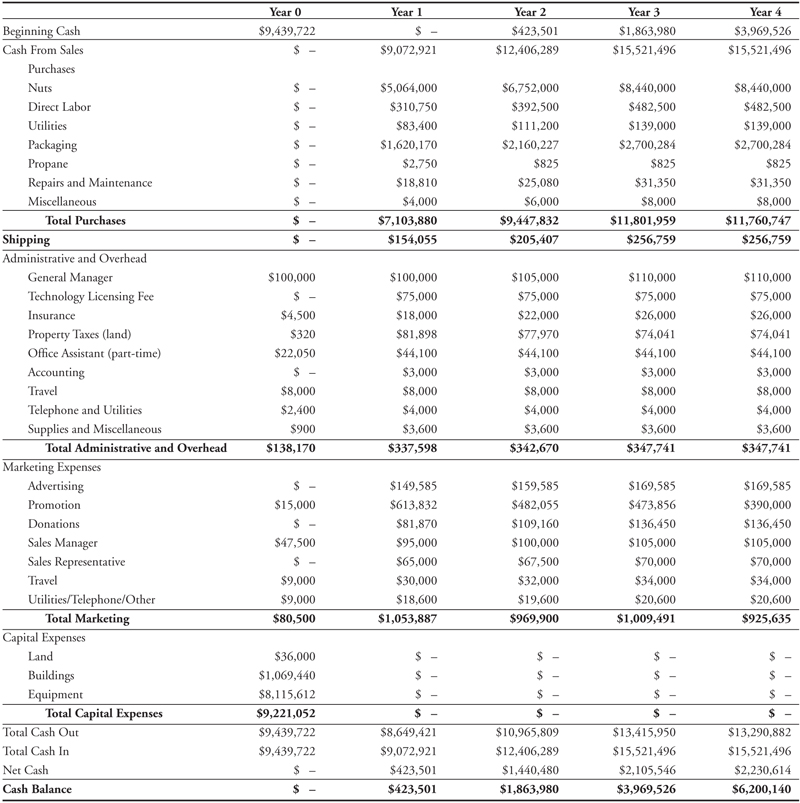
Cash Flow Statements
According to the pro forma cash flow statements (Table 12), in Year 0 cash outflows total $9,429,722. These outflows were the requirements for purchasing the capital assets and the capitalized startup expenses. Beginning cash matches this amount because it is self-financed and the company put $9,429,722 of cash into the business during Year 0. The cash balance in Year 1 was $423,501 and accumulated to $6,200,140 by Year 4. A 20-year cash flow can be found in Appendix B, Table B6.
Table 12. Five-Year Pro Forma Cash Flow Statement
Internal Rate of Return Analysis
We completed a cash flow projection for the 20-year project life and used it as the basis for calculating the internal ate of return (IRR) for the project (Appendix B, Table B6). The cash flow included replacement of capital items needed during the project life and assumed a zero salvage value at the end of the 20 years. The IRR for the project is 18% when using the base product prices of $4.91 per 250-ml bottle of oil, $8.36 per 500-ml bottle of oil, and $4.91 per 12-ounce package of flour and purchasing pecan pieces at $4.22 per pound (Table 13). The expected average retail price is also shown in Table 13 because changes in the prices the company charges wholesalers directly affect retail prices. The company should not consider raising retail prices much above competitive products.
Table 13. Base Pricing and Internal Rate of Return
| Company Price | Retail Price | |
| Pecan Oil, 250 ml | $4.91 | $9.98 |
| Pecan Oil, 500 ml | $8.36 | $16.99 |
| Pecan Flour, 12 ounces | $4.91 | $9.98 |
| Raw Pecan Price/Pound | $4.22 | |
| IRR | 18% |
Sensitivity Analysis
Prices received for the oil and flour products and price paid for the nuts were determined as the factors most likely to fluctuate from the base assumption. Table 14 demonstrates the effects of changes in pecan prices and changes in selling prices of the products. At the base prices from Table 13, the IRR is 18% and positioned in the middle of Table 14. If product selling prices are 5% lower than the base prices and the base input price remains constant, the IRR decreases from 18% to 11%. If selling prices increase and input prices remain constant or decrease, the IRR increases, leaving this project feasible. However, if the price of pecans increases by 10% (i.e., pecans cost $4.64 instead of $4.22 per pound) and the selling prices remain constant, the IRR drops to 10%. If pecan prices increase any more than 10%, then product selling prices must increase in order to achieve an acceptable IRR.
Table 14. Sensitivity Analysis of Internal Rate of Return
| Company Selling Price of Pecan Oil and Flour | |||||
| 10% Decrease |
5% Decrease |
Base Selling Price |
5% Increase |
10% Increase |
|
| Prices of Raw Pecan Nuts | |||||
| 20% Decrease | 20% | 26% | 32% | 38% | 44% |
| 10% Decrease | 12% | 19% | 26% | 32% | 38% |
| Base Input Price | 0% | 11% | 18% | 25% | 31% |
| 10% Increase | 0% | 0% | 10% | 18% | 24% |
| 20% Increase | 0% | 0% | 0% | 10% | 17% |
Conclusion and Recommendations
Considering the sensitivity analysis, if the base scenario product selling prices can be achieved and pecan nut prices do not exceed $4.22 per pound, the 2-million-pound capacity processing facility would be considered financially feasible. The base scenario assumptions with a projected IRR of 18% would allow debt financing at interest rates of around 12% with a reserve for investor risk premium. If pecan prices increase by 10%, the company could still achieve an 18% IRR if they were able to raise their selling prices by 5%. The company would have some control over the pricing of the oil and flour products given that they are branded gourmet food items.
The biggest risk with this project is the price of pecan nuts. Pecan nut pieces are a commodity, and the company would have to compete in the market for supplies. With a large portion of the pecan supply being exported to China, U.S. shellers are experiencing a shortage of nuts to run through their plants. The current October 2011 price of Fancy medium pecan pieces is around $6.85, Choice at $6.70, and Standard at $6.50. If these were the prices at which pecan pieces had to be purchased today, this project would not be financially feasible.
Another risk this project faces is that, because these are completely new products, it may take longer and cost more to achieve the marketing goals and gain product awareness. If this were true, it would take longer for this project to achieve satisfactory returns on the initial investment. The technology being used is also new and could have unforeseen problems.
If this project had been started three years ago before exports to China caused pecan prices to nearly double, it would have been considered a good investment, particularly for a company or group of companies with their own shelling plants and control over a supply of nuts. Given the current high price of pecans and the uncertainty that they may go higher, it is recommended that the project be put on hold to see what happens to the price of pecans.
This report only considered using the extraction facility to process pecans. The facility can be used to extract oil from a wide variety of nuts and other vegetable products, with almonds and walnuts being prime candidates for consideration. The ability to process other products should mitigate some of the financial risks of the large initial capital investment. Walnut oil and defatted flour have similar health benefits to pecans, and their market strategy would be identical to pecan oil and flour. Evaluating the financial feasibility of processing both pecans and walnuts or almonds would be a useful topic for further study.
This study was a reconnaissance-level feasibility study and not a detailed business plan. If a company were to pursue this endeavor, they would need to perform a full business plan using some of the base assumptions from this study. This business plan would require technical assistance from an experienced food processing engineer to confirm the equipment cost estimates used.
Recommended additional work on this project could pertain to the different risk areas that could affect the feasibility, including different levels of financing to see the effect it would have on the profitability of the project.
References
American Heart Association. 2011. Meet the fats [Online]. Retrieved April 21, 2011, from http://www.heart.org/HEARTORG/GettingHealthy/FatsAndOils/MeettheFats/Meet-the-Fats_UCM_304495_Article.jsp
Bughin, J., J. Doogan, and O.J. Vetvik. 2010. A new way to measure word-of-mouth marketing [Online]. McKinsey Quarterly, April 2010. Retrieved September 20, 2011, from http://www.mckinseyquarterly.com/Marketing/Strategy/A_new_way_to_measure_word-of-mouth_marketing_2567
Collins, G., and A. Erickson. 2010. U.S. pecan growers crack into Chinese market [Online]. China SignPost, No. 9. Retrieved September 24, 2011, from http://www.chinasignpost.com/2010/12/u-s-pecan-growers-crack-into-chinese-market/
Cornucopia Institute. 2010. Dirty little secret in the natural foods industry: Toxic chemical use [Online]. Retrieved December 15, 2011, from http://www.cornucopia.org/2010/11/dirty-little-secret-in-the-natural-foods-industry-toxic-chemical-use/
Crawford, T. 2009. Pecan prices and grades [Guide Z-502]. Las Cruces: New Mexico State University Cooperative Extension Service.
Dunford, N. 2008. Oil and oilseed processing II [FAPC-159]. Stillwater: Oklahoma State University Robert M. Kerr Food & Agricultural Products Center.
Healthy Cooking. 2010. Healthy Cooking: 2010 advertising kit. Greendale, WI: RDA Food & Entertaining Affinity.
Living Without. 2011. Living Without: 2011 advertising media kit. Norwalk, CT: Author.
McLain, S. 2011. Understanding consumer preferences for cooking oil products using means end chain analysis and discrete choice experiments [Thesis]. Las Cruces: New Mexico State University.
Pirovano, T. January 26, 2010. U.S. healthy eating trends part 1: Commitment trumps the economic pinch [Online]. Nielson Wire. Retrieved April 20, 2011, from http://blog.nielsen.com/nielsenwire/consumer/healthy-eating-trends-pt-1-commitment-trumps-the-economic-pinch.
Roger, V.L. et al. 2011. Heart disease and stroke statistics—2011 update: A report from the American Heart Association. Circulation, 123, e18–e209. doi: 10.1161/CIR.0b013e3182009701
Schumacher, J. 2007. Oilseed processing: An overview [Briefing No. 86]. Bozeman: Montana State University Agricultural Marketing Policy Center.
Silliker. 2010. Pecan oil and flour nutritional analysis. Chicago Heights, IL: Author.
Toro-Vazquez, J., M. Charó-Alonso, and F. Pérez-Briceño. 1999. Fatty acid composition and its relationship with physicochemical properties of pecan oil. Journal of the American Oil Chemists’ Society, 76, 957–965.
U.S. Census Bureau. 2011. Statistical abstract of the United States: 2011, section 22 [Online]. Retrieved September 28, 2011.
U.S. Census Bureau. 2010. Estimated annual sales of U.S. retail and food services firms by kind of business: 1998 through 2009.
USDA-ARS. 2011. National nutrient database for standard reference [Online]. http://www.nal.usda.gov/fnic/foodcomp/search/
USDA-ERS. 2011. State facts sheets: New Mexico [Online]. Retrieved August 24, 2011.
USDA-NASS. “Noncitrus Fruits and Nuts 2002-2010 Preliminary Summary” NASS Reports. January 2003-January 2011
Walsh, R. 2009. Healthy but flavorless pecan oil [Online]. Houston Press. Retrieved September 29, 2011, from http://blogs.houstonpress.com/eating/2009/01/healthy_but_flavorless_pecan_o.php
Wessel, D. 2011. Shell shock: China reshapes U.S. pecan business [Online]. The Wall Street Journal. Retrieved August 24, 2011, http://online.wsj.com/article/SB10001424052748704076804576180774248237738.html
Wolfe, A. October 14, 2010. Study: 70% of consumers buy specialty food as “treats” [Online]. Progressive Grocer. Retrieved April 21, 2010
Wright, J., and T. DePhillip. 2010. Comparison of supercritical fluid extraction and pressurized solvent extraction for the recovery of gamma-Tocopherol in walnut oil. LC-GC North America, November 2010 Supplement, 30-34.
Appendix A: Preliminary Analysis of 750,000-Pound Processing Facility
We performed a preliminary reconnaissance-level feasibility analysis for a 750,000-pound capacity processing facility. A facility of this size would require a lower capital investment and fewer raw input needs. The initial capital investment totaled $7.9 million (Appendix A, Table A1), which is roughly only $1.3 million less than the initial investment for the 2-million-pound facility (Table 7). The cost of the equipment remains high because most of the equipment needed cannot be sized down at this time. However, if one were to build this plant, we recommend consulting a manufacturing engineer for more accurate pricing of the smaller equipment.
Sales from this size of plant would be lower and, therefore, could be entirely focused toward gourmet market outlets. The advertising and promotional expenses for the 750,000-pound capacity processing facility would also be lower because of the smaller market segments. Total advertising and promotional expenses would be $577,929 in Year 1, decreasing to $488,923 by Year 3 (Appendix A, Table A2). It was assumed that only 250-ml bottles of oil and 12-ounce bags of flour would be produced by the 750,000-pound capacity plant. Placement of the pecan oil and flour products in gourmet market outlets would allow the plant to raise output prices and still be competitively priced.
With a smaller volume of nuts required, there would be an opportunity to purchase lower-priced pecans, such as off-colored or Standard pieces. The supply of these lower-priced nuts is smaller and is thus more suitable for a plant of this size. Appendix A, Table A3 shows the internal rate of return (IRR) at base prices for the 750,000-pound capacity facility. The base selling prices for both the oil and flour were specified at $5.40 (Appendix A, Table A3). This is a 10% increase from the base prices for the same products produced by the 2-million-pound facility (Table 13). The base pricing of raw pecan nuts is based on a 5-year average of Standard medium pieces of $3.97 (Table 6). The IRR for the 750,000-pound capacity facility is 7% assuming the base pricing (Appendix A, Table A3).
Appendix A, Table A4 shows the sensitivity analysis with regard to the changes in raw pecan nut prices and selling prices of the pecan oil and flour. The base IRR is shown in the middle of the table. In order for this size of facility to be financially feasible, raw pecan prices would have to decrease by 10 to 20% and stay below $3.57 per pound, and selling prices of the oil and flour would have to increase by 10%. With the current rapid increase in the price of pecans, it is recommended not to proceed with this size of facility.
Appendix A, Table A1. Capital Investment Summary for a 750,000-Pound Capacity Facility
| Item | Cost |
| Land (3 acres) | $36,000 |
| Equipment | $7,136,634 |
| Extractor Building (2,000 ft2) | $500,000 |
| Processing and Packaging Building (4,500 ft2) | $136,500 |
| Warehouse, Shipping, and Office Building (4,288 ft2) | $237,440 |
| Total Initial Investment | $7,985,134 |
Appendix A, Table A2. Advertising and Promotional Expenses for a 750,000-Pound Capacity Facility
| Year 0 | Year 1 | Year 2 | Year 3 | |
| Print Advertising Living Without Gluten-Free Living Miscellaneous Advertising Ad Development Ad Agency Commissions and Media Kit Internet Ads |
$ – $ – $ – $ – $ – |
$19,985 $9,600 $25,000 $25,000 $15,000 |
$19,985 $9,600 $12,000 $20,000 $20,000 |
$19,985 $9,600 $12,000 $20,000 $20,000 |
| Total Advertising | $ – | $94,585 | $81,585 | $81,585 |
| Promotional Activities Television Cooking Show Sponsor House Party Program Free Product to Retail Stores Coupons Recipe Development and Distribution Website Trade Show: Celiac Show Miscellaneous Promotions Donations American Heart Association Celiac Disease Foundation |
$ – $ – $ – $ – $ – $ – $ – $15,000 $– $– |
$200,000 $50,000 $71,545 $24,000 $15,000 $25,000 $20,000 $40,000 $28,391 $9,408 |
$200,000 $40,000 $13,722 $19,000 $10,000 $5,000 $20,000 $40,000 $37,855 $12,544 |
$200,000 $40,000 $13,339 $16,000 $10,000 $5,000 $20,000 $40,000 $47,318 $15,680 |
| Total Donations and Promotional | $ – | $483,344 | $398,121 | $407,338 |
| Total Advertising and Promotional | $15,000 | $577,929 | $479,706 | $488,923 |
Appendix A, Table A3. Base Pricing and Internal Rate of Return for a 750,000-Pound Capacity Facility
Company Price Retail Price| Pecan Oil, 250 ml | $5.40 | $10.98 |
| Pecan Flour, 12 ounces | $5.40 | $10.98 |
| Raw Pecan Price/Pound | $3.97 | |
| IRR | 7% |
Appendix A, Table A4. Sensitivity Analysis of Internal Rate of Return for a 750,000-Pound Capacity Facility
| Selling Price of Pecan Oil and Flour | |||||
| 10% Decrease |
5% Decrease |
Base Selling Price |
5% Increase |
10% Increase |
|
| Prices of Raw Pecan Nuts | |||||
| 20% Decrease | 6% | 10% | 14% | 17% | 20% |
| 10% Decrease | 2% | 7% | 11% | 14% | 18% |
| Base Input Price | 0% | 3% | 7% | 11% | 15% |
| 10% Increase | 0% | 0% | 3% | 8% | 12% |
| 20% Increase | 0% | 0% | 0% | 4% | 8% |
Appendix B: Supporting Tables
Appendix B, Table B1. Broker Prices of Fancy Shelled Pecans by Year
| Fancy Junior Mammoth Halves | Fancy Medium Pieces | |
| 1991 | $3.71 | $3.51 |
| 1992 | $3.99 | $3.90 |
| 1993 | $2.39 | $2.35 |
| 1994 | $3.62 | $3.56 |
| 1995 | $2.72 | $2.62 |
| 1996 | $2.75 | $2.51 |
| 1997 | $3.06 | $2.87 |
| 1998 | $4.08 | $4.02 |
| 1999 | $3.20 | $2.93 |
| 2000 | $3.05 | $2.78 |
| 2001 | $2.34 | $2.18 |
| 2002 | $3.07 | $2.94 |
| 2003 | $3.85 | $3.66 |
| 2004 | $4.83 | $4.69 |
| 2005 | $4.14 | $4.02 |
| 2006 | $4.30 | $4.18 |
| 2007 | $3.78 | $3.46 |
| 2008 | $3.83 | $3.44 |
| 2009 | $4.80 | $4.19 |
| 2010 | $6.62 | $5.85 |
| Source: Nick Sachs Company, Ltd., personal communications. | ||
Appendix B, Table B2. Investment Capital Requirement for Equipment
| Item | Quantity Needed | Capital Required |
| Bulk Dump Station | 1 | $12,000 |
| Extraction Equipment | 1 | $7,371,798 |
| Roaster Oven | 1 | $265,000 |
| Blast Freezer | 1 | $164,804 |
| Oil Settling Tanks | 2 | $9,348 |
| Pecan Oil Bottling Equipment | 1 | $80,000 |
| Flour Settling Tanks | 2 | $19,925 |
| Flour Bagging Equipment | 1 | $121,597 |
| Forklift | 1 | $15,000 |
| Pallets | 350 | $3,500 |
| Pallet Racking | 64 | $49,640 |
| Total Equipment | $8,112,612 |
Appendix B, Table B3. Packaging Supplies Costs
| Price/Unit | Year 1 | Year 2 | Year 3 | |
| Oil 250-ml Glass Bottle Carton (price/case)a Label 500-ml Glass Bottle Carton (price/case)a Label |
$0.90 $0.16 $0.35 $1.25 $0.30 $0.35 |
$681,384 $202 $264,983 $473,183 $189 $132,491 |
$908,512 $269 $353,310 $630,911 $252 $176,655 |
$1,135,640 $336 $441,638 $788,639 $315 $220,819 |
| Flour Plastic Bag w/ Label Carton (price/case) |
$0.12 $0.09 |
$60,211 $7,526 |
$80,282 $10,035 |
$100,352 $12,544 |
| Total Packaging Supplies | $1,620,170 | $2,160,227 | $2,700,284 | |
| aCarton costs for oil only account for damaged cartons. It is assumed that cartons received with empty bottles will be reused. | ||||
Appendix B, Table B4. Direct Labor Costs
| Position | Salary | # | Year 1 | # | Year 2 | # | Year 3 |
| Superintendent | $60,000 | 1.2 | $72,000 | 1.6 | $96,000 | 2 | $120,000 |
| Production Employees Extractor Processing Packaging |
$27,500 $27,500 $27,500 |
2.5 2.5 2.5 |
$68,750 $68,750 $68,750 |
3.2 3.2 3.2 |
$88,000 $88,000 $88,000 |
4 4 4 |
$110,000 $110,000 $110,000 |
| Shipping | $32,500 | 1 | $32,500 | 1 | $32,500 | 1 | $32,500 |
| Total Direct Labor | $310,750 | $392,500 | $482,500 |
Appendix B, Table B5. Depreciation and Maintenance Schedule
Appendix B, Table B6. 20–Year Cash Flow Statement
| Year | Initial Investment |
Net Capital Replacement |
Operating Cash Out |
Total Cash Out |
Operating Cash In |
Net Cash | Net Cash Balance |
| Year 0 | $9,221,052 | $218,670 | $9,439,722 | $ – | $(9,439,722) | ($9,439,722) | |
| Year 1 | $8,649,421 | $8,649,421 | $9,072,921 | $423,501 | ($9,016,221) | ||
| Year 2 | $10,965,809 | $10,965,809 | $12,406,289 | $1,440,480 | ($7,575,741) | ||
| Year 3 | $13,415,950 | $13,415,950 | $15,521,496 | $2,105,546 | ($5,470,195) | ||
| Year 4 | $13,290,882 | $13,290,882 | $15,521,496 | $2,230,614 | ($3,239,581) | ||
| Year 5 | $3,150 | $13,331,269 | $13,334,419 | $15,521,496 | $2,187,077 | ($1,052,504) | |
| Year 6 | $13,331,269 | $13,331,269 | $15,521,496 | $2,190,227 | $1,137,722 | ||
| Year 7 | $13,331,269 | $13,331,269 | $15,521,496 | $2,190,227 | $3,327,949 | ||
| Year 8 | $13,331,269 | $13,331,269 | $15,521,496 | $2,190,227 | $5,518,176 | ||
| Year 9 | $13,331,269 | $13,331,269 | $15,521,496 | $2,190,227 | $7,708,403 | ||
| Year 10 | $17,550 | $13,331,269 | $13,348,819 | $15,521,496 | $2,172,677 | $9,881,080 | |
| Year 11 | $13,331,269 | $13,331,269 | $15,521,496 | $2,190,227 | $12,071,307 | ||
| Year 12 | $13,331,269 | $13,331,269 | $15,521,496 | $2,190,227 | $14,261,534 | ||
| Year 13 | $13,331,269 | $13,331,269 | $15,521,496 | $2,190,227 | $16,451,761 | ||
| Year 14 | $13,331,269 | $13,331,269 | $15,521,496 | $2,190,227 | $18,641,987 | ||
| Year 15 | $18,150 | $13,331,269 | $13,349,419 | $15,521,496 | $2,172,077 | $20,814,064 | |
| Year 16 | $13,331,269 | $13,331,269 | $15,521,496 | $2,190,227 | $23,004,291 | ||
| Year 17 | $13,331,269 | $13,331,269 | $15,521,496 | $2,190,227 | $25,194,518 | ||
| Year 18 | $13,331,269 | $13,331,269 | $15,521,496 | $2,190,227 | $27,384,745 | ||
| Year 19 | $13,331,269 | $13,331,269 | $15,521,496 | $2,190,227 | $29,574,972 | ||
| Year 20 | $17,550 | $13,331,269 | $13,348,819 | $15,521,496 | $2,172,677 | $31,747,649 | |
| IRR | 18% |
To find more resources for your business, home, or family, visit the College of Agricultural, Consumer and Environmental Sciences on the World Wide Web at aces.nmsu.edu.
Contents of publications may be freely reproduced for educational purposes. All other rights reserved. For permission to use publications for other purposes, contact pubs@nmsu.edu or the authors listed on the publication.
New Mexico State University is an equal opportunity/affirmative action employer and educator. NMSU and the U.S. Department of Agriculture cooperating.
Printed and electronically distributed October 2012, Las Cruces, NM.