Research Report 762
L. Allen Torell and Neil R. Rimbey
College of Agricultural, Consumer and Environmental Sciences, New Mexico State University
Authors: Professor, Department of Agricultural Economics and Agricultural Business, New Mexico State University, Las Cruces; and Professor, Caldwell Research & Extension Center, University of Idaho, Caldwell. (Print friendly PDF)
This database is compiled and updated for use by members of W1192, a western regional research project titled “Economic, Social, and Ecological Issues of Rangeland Fragmentation that Affect Rangeland Sustainability and Rural Communities.” Use restrictions apply to the copyrighted beef price data described in this database.
Table of Contents
Introduction
Accessing the Price Databases
Data Use Limitations
Structure of the Access Database
Access Tables
Queries
Using the Queries to Limit Data Accessed
Forms
Updating the Database
1. Changing the CPI Query Base Year
2. Updating Monthly CPI and PPI Values
3. Build a Spreadsheet of Updated Feeder Cattle Prices
4. Update the Calf_Prices Table in Access
5. Updating Brood_Cow_Prices Table in Access
Introduction
Cattle-Fax (www.cattlefax.com) has, for a number of years, cooperated to provide weekly beef prices reported at various western U.S. auctions for use in regional research efforts. Researchers associated with WERA-55 and W1192 are authorized to use this price data subject to the limitations outlined below. Cattle-Fax reports other prices that are not available in this database or discussed in this report.
This manual describes Microsoft Access databases built to store and display the beef price data. An intermediate understanding of database programs and Access is assumed. Procedures for updating the data are also described in this manual. It is intended that this manual be read while actively reviewing and using the database.
Accessing the Price Databases
Beef price databases (Access files) for each of the eleven western states are stored on an FTP server at New Mexico State University. This is not an anonymous FTP server, and you must have a username and password to log in (available to authorized persons from the authors). Use an FTP program or a browser to log into ftp://agecon.nmsu.edu and the server will ask you for a username and password. The beef price database files are stored in the Beef_Prices directory.
Data Use Limitations
Cattle-Fax has stipulated that the price data can be shared within our regional research group provided we recognize and follow certain limitations for use of the data. We are not authorized to print tables or detailed graphs of Cattle-Fax beef price data in research and Extension reports without obtaining specific authorization. We can use periodic averages in ranch budgets, cost/benefit analyses, and programming models, and conduct research on beef price relationships. All data contained in this spreadsheet is copyrighted and should not be reproduced or sold in any form without prior written agreement. Cattle-Fax requests that we notify them when its data or analyses based on its data are published.
Structure of the Access Database
Access Tables
Following standard database procedures, beef prices are stored in tables and queries are used to view the data in different ways. Four tables are included in the database: 1) Brood_Cow_Prices, 2) Calf_Prices, 3) CPI, and 4) Update (Figure 1). This structure is the same for each database file stored on the FTP site for each of the eleven western states. A file is also included that gives average prices for the western U.S.
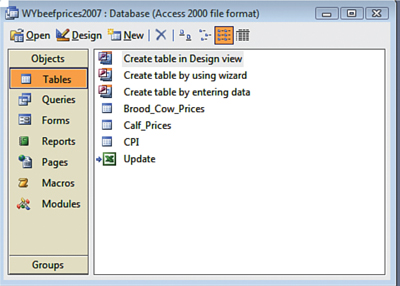
Figure 1. The database tables.
Beef prices are stored in standard form with rows for alternative data periods and columns for different price and categorical variables. All prices stored in the tables are on a nominal price basis. Feeder calf and cull animal prices are reported on a $/cwt basis, whereas brood cow prices are on a $/head basis. Queries are included to compute real (inflation adjusted) prices. The common variable between all tables is the date of the beef price recording (DATE).
In a state database of your choosing, open the Brood_Cow_Prices table and notice that high (HPRICE), low (LPRICE), and median cow prices (MIDPRC) are reported for bred cows, bred heifers, and pairs for various U.S. regions on a monthly basis. Cow prices are not different by state and are reported as a regional average for the West, Midwest, Northwest, and Southeast. Each state file includes the same cow prices.
Open the Calf_Prices table and browse through the data. Notice that prices are reported for different animal classes (SEX) and weights (WEIGHT). Data for individual states (AREA) are recorded in separate database files available at the FTP site. Cull bull and cull cow prices are also included in the Calf-Prices table.
The CPI table includes the Consumer Price Index for all urban consumers (CPI-U) and the Producer Price Index (PPI, all commodities) (both available at www.bls.gov). Data in this table are used to adjust beef prices to a constant year price basis using queries described later. You can choose whether you want to index for inflation using the CPI or the PPI using the procedure described below. Note that when the beef prices were updated not all CPI and PPI values were reported or final. As such, you should replace recent monthly values included in the CPI table (which were guesses) with the actual values.
The linked Update table is described later, but, briefly, this linked Excel file includes calf prices that have been added to the database since the last price update. An Append query is used to append the data from this table to the bottom of the Calf_Prices table. As a user you will not deal with this table or the updating procedure.
Queries
The Brood_Cow_Prices_Query and the Calf_Prices_Query retrieve nominal price data from the corresponding tables just described and compute the year and month of the price observation (Figure 2).
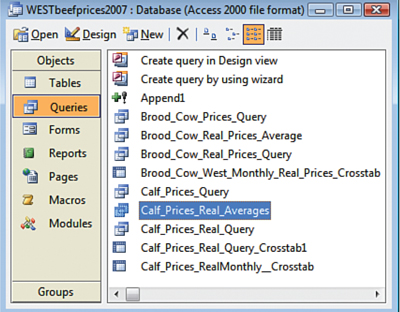
Figure 2. The key database queries.
Open the CPI_Query in Design View (right-click and select Design View) and notice how the CPI and PPI with a base year of 2006 (variables = CPIBASE and PPIBASE) are computed. The 201.6 used in the calculation of the CPIBASE and 164.7 for PPIBASE are the reported annual index averages for 2006. Thus, in this version of the database, real prices are computed with a 2006 base year.
Real prices are computed within the Brood_Cow_Real_Prices_Query and the Calf_Prices_Real_Query. Be patient when opening and running the real price queries as the computations take several minutes.
If you believe real prices should be computed using the PPI instead of the CPI, this is easily changed. Open the Calf_Prices_Real_Query in Design View and find the calculation given by RPRICE: [Price] * ([CPIBASE] / 100). In this formula, change the word CPIBASE to PPIBASE. Similarly, open the Brood_Cow_Real_Prices_Query and change the similar formulas. Note that there are three of these formulas in this query, one each for low, high, and mid-level cow prices.
The two queries with “Crosstab” in the title (Figure 2) are summary queries that compute real average beef prices by month and by animal class. Note that the cow price crosstab query includes a criteria line that limits the data to just the western states. Patience is required to run these CPU-intensive queries.
Open Calf_Prices_Real_Query_Crosstab and notice that monthly real prices are computed by animal class. The query summarizes prices by animal class by year and month. If a user desires to work with these monthly data in Excel or another format, the query can be exported by right-clicking on the query while in the Figure 2 view and choosing “Export.” Data compiled by any of the queries can be exported in this way.
The last query described is the Append1 query (Figure 2). Do not run this query without reading more about it below. It is used to add data to and update the database. Other queries are included that are not described in detail here. The knowledgeable user can build additional queries as needed.
Using the Queries to Limit Data Accessed
Criteria set in the queries can be used to limit the data accessed, displayed, and used. Because the database is so large and CPU–intensive, one of the first things you may want to do is set criteria to limit the data retrieved and displayed to only those years of interest. This can be done in the appropriate nominal-price query because real price calculations are based on the nominal-price queries.
Adding criteria is done in Design View. As an example, suppose that only calf prices during or after 2002 are of interest. Open the Calf_Prices_Query in Design View and add this criterion (Figure 3). Other queries that depend on the Calf_Prices_Query will also be affected. It is important to remove the criteria once the analysis is done. If the data displayed seem incomplete, it is likely that an unwanted criterion remains in one of the queries.
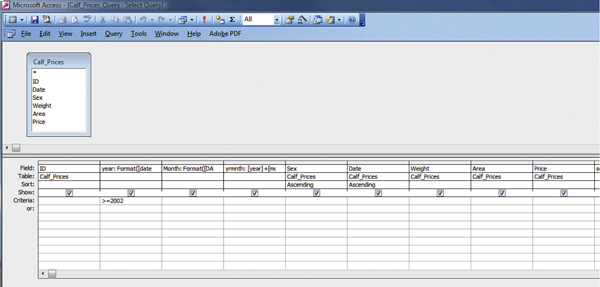
Figure 3. Adding criteria in Design View.
Forms
Pivottables and pivotcharts are included to display both real and nominal prices. Access to the pivottables and charts starts from the Forms section of Access. Calf prices by weight class and cull cow and bull prices are displayed using the “Calf Price” pivots. Brood cow prices are displayed using the “Brood Cow” pivots. Alternative animal classes and weights can be selected from the dropdown icons included with the pivots (Figure 4). Data are fed to the tables and charts from corresponding real and nominal queries, and any criteria set within these queries will limit the data displayed. The knowledgeable user can change the structure of the pivottables and pivotcharts.
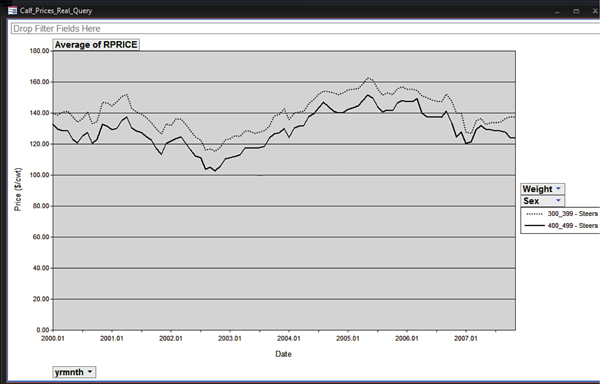
Figure 4. Real Calf Prices pivotchart.
Pivotcharts and pivottables are CPU-intensive. If you are not interested in the older prices, setting a criterion to limit the years considered will greatly speed up the process. Chart options may have to be altered to display the data properly when altered years are displayed.
Updating the Database
This section does not apply to the normal database user. It is included to remind the database developers about the steps required to update the database and how the various macros work. The following section describes the general steps required to update the database for a particular state.
1. Changing the CPI Query Base Year
Open the CPI Query in Design View by right-clicking on it when in the view shown in Figure 2. Find the calculation variable called CPIBASE and change the number included in the calculation to the appropriate annual CPI value for the desired base year. For example, the 201.6 currently included in the query was the average CPI-U during 2006, and thus prices are currently adjusted to constant 2006 levels. In a similar way change the base year for PPIBASE.
2. Updating Monthly CPI and PPI Values
Go to the Bureau of Labor Statistics website (www.bls.gov) to find the CPI-U price series and search (under inflation) to find “CPI U.S. All items, 1982 − 84 = 100 − CUUR0000SA0.” Open the database table called CPI and type the monthly values at the bottom of the table in the CPI column. Reported values will likely lag behind the beef price series obtained by Cattle-Fax. Type the most recent available CPI values for all months needed and remember to update the values later when final values are reported.
Search the Bureau of Labor Statistics site for the Prices Paid Index. Search under “Commodity Data” and select “All Commodities.” Update the PPI values in the CPI table. Note that once you have updated the table you can copy and replace the table when updating other states because the structure is the same for each state.
3. Build a Spreadsheet of Updated Feeder Cattle Prices
When requested, Cattle-Fax has provided a spreadsheet file compiled from their database with the structure shown in the most recent update file, CattleFax_feeder _prices2007.xls. From the server, open this file and note that a separate sheet is included for each of the western states and with average prices recorded across all western states. Notice that 14 columns of data are provided with columns detailing prices for alternative animal classes (Figure 5). Each sheet has the same structure, and steps should be taken to verify that data locations are identical for each state (sheet). This is important for macro execution. Prices must start and end in the same location.
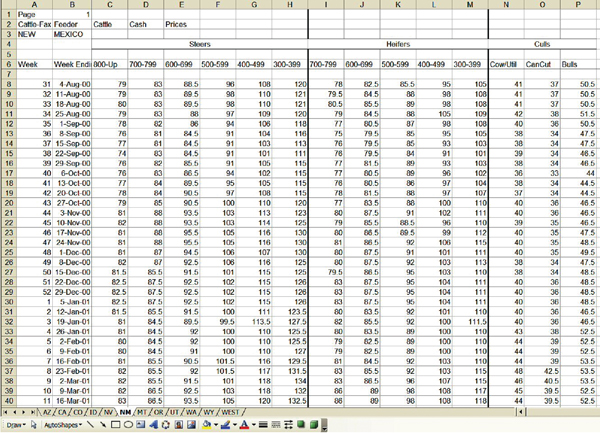
Figure 5. Structure of prices of Calf_Prices from Cattle-Fax.
Open the Excel spreadsheet of updated prices sent from Cattle-Fax (CattleFax_feeder_prices2007.xls as an example). Leaving this spreadsheet open, also open the spreadsheet called Beefprices_update.xls and enable the macros. This is a template spreadsheet. Two macros are included in this program, Moveit and Fillitin. Running these macros should correctly copy and paste the price data received from Cattle-Fax to the template spreadsheet, provided you have correctly verified the length and location of the copy ranges and correctly answered the three questions asked by the macro. Do not change the name of the spreadsheet file called Beefprices_update.xls as the macros work using this file name. Follow these steps to verify the data:
- Open the Calf_Prices table in the Access database that is to be updated. The database should already be sorted (ascending) by Date (right-click on the Date column if not sorted), move to the bottom of the database and note the last index number (ID) used and the last date (DATE) shown. For the November 2007 update the last index of the New Mexico file was 22414 and the last date was 9/1/2006. Write these numbers down.
- In the CattleFax_feeder_prices2007.xls file notice that for any particular state the data starts the week of August 4, 2000, and thus it overlaps what is needed (September 8, 2006, the week following data already in the database). Some overlap should be requested when new data are solicited from Cattle-Fax. Move down the file and find the Excel row number where the price series update should start. For the New Mexico sheet, the September 8, 2006 data start in cell B326. This row number may be different for other states.
- Highlight from this starting cell (B326) to the last beef price included on the sheet (CTRL-SHIFT-Down arrow). Look at the Count at the bottom of the spreadsheet to determine how many prices will be added. Note that if at the bottom of the spreadsheet Count is not displayed, it may be on Average or Sum; right-click on Average (Sum) and change it to Count. In this example the count is 61. Data should copy starting at row 326 and 61 prices (rows) will be added. Remember also that in this example the last index number in the New Mexico database was 22,414.
- Open the spreadsheet Beefprices_update.xls and enable the macros. As noted above, two macros are included in this program: Moveit and Fillitin. At this point, the Beefprices_update.xls spreadsheet should be blank except for six labels included in row 1 of sheet 1. Any existing data will be written over by the macro. You should erase any data that may have been saved in this template spreadsheet.
- Macros in one Excel program can run in another Excel program, and we will take advantage of this feature to run the macro called Moveit. The Fillitin macro is run automatically by the Moveit macro without access by the user. Do not change the name of this file or the macros as the filename is uniquely defined in the macro.
- With both spreadsheets open, move to the CattleFax_feeder_prices2007.xls file and select any cell located on the desired state to be updated. If we were updating New Mexico, for example, we would select any cell on the NM sheet and execute the macro (from the Tools menu, select Macros) called Moveit from this location.
- Answer the macro-generated questions:
- What row number does the data start on? (326 in this example.)
- How many prices are to be added? (61 in this example.) Note that it is assumed that all rows from the starting row number to the last in the data will be added to the database. The macro will not work correctly if this is not the case.
- What index number starts the series? (22415 in this example.)
- The macro should execute, and when you move to the spreadsheet called Beefprices_update.xls you can verify that the copy was correctly completed. In this example 854 rows of data (14 price series × 61 weeks) should be included.
- In the Beefprices_update.xls spreadsheet, verify and alter as needed the named range called Data so that it includes all the data transferred and the row of variable names at the top. Verify that the data are for the correct state as defined by the Area variable; verify that the prices copied correctly.
- Save the file called Beefprices_update.xls, but with a new file name. In this example, New Mexico prices are being updated, so NMprices2007.xls was the name chosen.
4. Update the Calf Prices Table in Access
The next step in the update process is to append the data to the Calf_Prices table in Access. The data in the spreadsheet you just built will be inserted into Access, and then the data will be appended to the beef prices already included in the database.
- Open Access and right-click on the Update table (Figure 1). From the Linked Table Manager, point to the file you just saved (NMprices2007.xls); notice that you are creating a direct link to the spreadsheet file. Double-click on the table to open it and verify that it connected correctly to your spreadsheet and that the data look just like the data in the spreadsheet. Verify that all data rows were inserted and that blank rows were not inserted. If either of these conditions are true, you probably forgot to change the range name in the spreadsheet called Data.
- Go to the Queries page and run the Append1 query. When the query is executed it will inform you that running the query will modify your table and in this case append 1960 records. After completing the update, go to the bottom of the Calf_Prices table and verify that the new data were appended. Note that if you ran the query a second time this would append the data a second time, which is a mistake. Also note that there is no active link between the Update table and the Calf_Prices table—the query merely copied the data.
5. Updating Brood_Cow_Prices Table in Access
An append query was not set up to update the brood cow prices. Cattle-Fax supplied all prices for the update from 1976 to the present and in the correct format. The update procedure followed changed the name of the variables to those defined in the Brood_Cow_Prices table. The old table was deleted in Access and replaced by copying and pasting the data with labels from Excel, being careful to call the new table Brood_Cow_Prices. Because the brood cow prices file is not different by state, the same updated spreadsheet was cut and pasted for each state file. So, briefly:
- Check the variable names in the old cow price Access table and change the names in the new spreadsheet to these names.
- Rename the old Access table something like Brood_Cow_Prices2.
- Block and copy the data in the spreadsheet, including the variable names, and paste it into Access. Rename the table Brood_Cow_Prices.
- Compare and verify the prices are correct.
- Delete the old table you called Brood_Cow_Prices2 after comparing the data in the two tables.
- Try out the various queries and pivottables to make sure they work correctly.
To find more resources for your business, home, or family, visit the College of Agricultural, Consumer and Environmental Sciences on the World Wide Web at aces.nmsu.edu.
Contents of publications may be freely reproduced for educational purposes. All other rights reserved. For permission to use publications for other purposes, contact pubs@nmsu.edu or the authors listed on the publication.
New Mexico State University is an equal opportunity/affirmative action employer and educator. NMSU and the U.S. Department of Agriculture cooperating.
Printed and electronically distributed October 2008, Las Cruces, NM.