New Mexico's Pecan Industry: Estimated Impacts on the State's Economy
Bulletin 791
Jay M. Lillywhite, Terry L. Crawford, Jim Libbin, and Jim Peach
College of Agricultural, Consumer and Environmental Sciences, New Mexico State University (Print Friendly PDF)
Authors: Assistant Professor, College Professor, and Professor, respectively, Department of Agricultural Economics and Agricultural Business; and Professor, Department of Economics and International Business, all of New Mexico State University, Las Cruces.
Introduction
The United States is the world’s leader in pecan production. While exact numbers for world production are unknown, it is estimated that the U.S. produces 75 percent of the world’s pecans (Johnson, 1997). New Mexico plays an important role in U.S. pecan production. Similarly, pecan production and the pecan industry play an important role in New Mexico agriculture and New Mexico’s rural economy. This paper briefly describes New Mexico’s pecan production industry and provides economic impact estimates of pecan production on the state’s economy. Economic impacts are estimated using input-output modeling. The software program Impact Analysis for Planning (IMPLAN) was used in the analysis. The next section provides a brief overview of pecan production within the state, followed by a description of input-output modeling as used in economic impact analysis, as well as a description of the IMPLAN software. The explanation of input-output modeling is followed by results and conclusion sections.
Description of New Mexico Pecan Production
Unlike other tree nut production that is concentrated in geographical regions, e.g., almonds, pecans are commercially produced in 14 different states (see Figure 1). With 37,763 pecan acres, New Mexico ranks fourth in the country in pecan acreage behind Texas (180,719 acres), Georgia (128,550), and Oklahoma (85,740 acres). In terms of utilized production, New Mexico ranks third in the country with 50,333,000 pounds produced in 2002 behind Georgia’s 71,667,000 pounds and Texas’ 61,667,000 pounds (USDA–NASS, 2002). The increase in ranking in utilized production (relative to its ranking in acreage) is in part due to the fact that New Mexico production consists of improved varieties, which allows more dense plantings and less variability in production cycles.
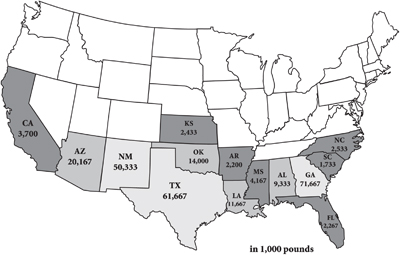
Figure 1. U.S. 2001–2003 average utilized pecan production, by state.
While New Mexico ranks third in quantity of pecans produced during 2002–2004 behind Georgia, and Texas, it ranked first in value of pecan production for the same period. New Mexico just barely exceeded the value of pecans produced in Georgia in each of the three years (USDA–NASS, 2005). New Mexico accounts for over a fourth of the value of pecans produced in the U.S. while supplying only a fifth of the U.S. quantity.
In terms of cash receipts, pecan production ranks fourth among New Mexico’s agricultural products (behind milk, cattle and calves, and hay). In 2002 New Mexico had 1,740 pecan orchards that incorporated a total of 37,763 acres (see Figure 2). Doña Ana County leads the state with approximately 68 percent of the state’s pecan orchards and acreage. It is likely that growth in pecan production will continue in the state, at least in the near future, as 12 percent of the state’s pecan trees are at a nonbearing age and have yet to be accounted for in production figures (USDA–NASS, 2005).
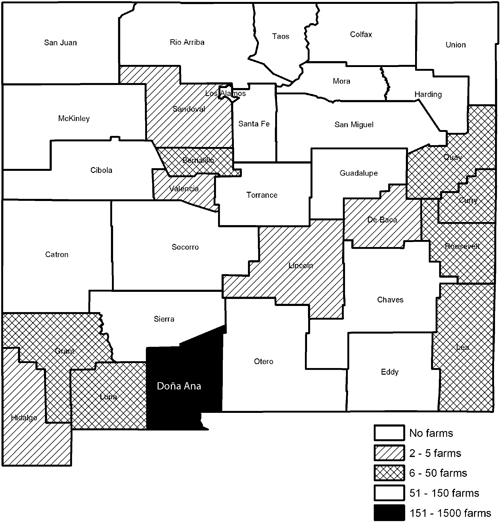
Figure 2. Number of pecan farms in New Mexico, by county, 2002.
Economic Impact Analysis: Methods & Tools
Input-Output Analysis. Input-output analysis was originally developed in the 1930s by the economist Wassily W. Leontief. Derived from general equilibrium analysis, input-output analysis was initially used as a tool to help analysts model national economies. Input-output analysis can be thought of as a method of quantifying the interrelationships between sectors of a complex economic system, that is, input-output models detail the movement of dollars between producers and consumers of goods and services within an economy. The approach uses structural coefficients that represent the relationship between factors of production used as inputs in the production process and the resulting outputs produced by each sector. The interdependence between sectors is modeled using a set of linear equations that balance a sector’s total input use to the sector’s total output.
Today input-output analysis is often used to estimate the impact of a particular industry on a regional economy (e.g., county or state). While input-output modeling is often used to assess the impacts of policy changes on a particular economy, the analysis can be expanded to estimate the overall impact that a particular sector has on a regional economy by assuming that the sector’s reaction to an underlying change is equal to the entire sector’s output (e.g., Hall and Skaggs use input-output modeling to estimate the total economic impact of the vegetable industry on New Mexico’s economy). Input-output modeling is widely used for these purposes. Governmental and nongovernmental agencies using this procedure include the Bureau of Labor Statistics, the U.S. Department of Labor, the Bureau of Economic Analysis of the U.S. Department of Commerce, and numerous universities (Chase, Bourque, & Conway, 1993).
A number of assumptions are required in order to quantify the complex relationships existing within an economic system by using input-output analysis. Simplifying assumptions used in the analysis include: (1) each sector produces homogeneous outputs (e.g., underlying value differences of products within a single sector are not considered, rather the analysis examines total output and input usage in terms of dollar amounts), (2) linear production functions (the analysis does not allow for factor substitution or economies of size), (3) time is treated statically within the model and factors of production within the sectors are assumed to be fully utilized (Leatherman, 1994).
Input-output models generally subdivide the economic impact of a particular sector into three related effects. These include direct effects, indirect effects, and induced effects. Direct effects are estimates of dollar impacts to the economy resulting from the inputs purchased by businesses within the sector under consideration (the value of the fertilizer purchased by a pecan producer from a local fertilizer company is an example of a direct effect). Indirect effects are impacts to the economy as the result of input suppliers purchasing inputs from other sectors within the economy (a fertilizer company purchasing additional manufacturing equipment because the company has sold additional product to pecan producers is an example of an indirect impact). Finally, induced effects are the value of increased spending by households resulting from increased incomes that were generated through the direct and indirect effects discussed above (an employee of a fertilizer company whose job is indirectly affected by pecan production, who purchases a new car at a local car dealership is an example of an induced effect).1
IMPLAN. Impact Analyses and Planning (IMPLAN) is a combination of software program and informational databases. The program was first used in 1979 by the U.S. Forest Service in cooperation with the Federal Emergency Management Agency and the U.S. Department of Interior’s Bureau of Land Management (BLM) to facilitate land resource management (Mulkey & Hodges, 2003; Implan, 2000). In 1993 the program and its associated database was privatized. Today, exclusive development of the program and its associated database is under the control of the Minnesota Implan Group, Inc.
IMPLAN Professional 2.0 (released in 1999) software was used for this research. While a 2002 database containing updated sector relationships was available at the time of this report, the researchers opted to use an earlier 2000 database because the updated (2002) database adopted NAICS categories and aggregated all agricultural industries into three groups. In contrast, the previous (2000) database uses SIC categories, which facilitates the isolation of tree nut production from other agricultural production.2
Several assumptions implicit in the IMPLAN program should be identified. First, IMPLAN identifies and measures backward linkages only. That is, the program only examines the economic impact of goods and services purchased by the industry under analysis in order to produce its product. The program does not estimate forward linkages. In the case of pecan production, for example, the model will account for input industries such as fertilizer production and tree-trimming services in estimating the economic impact of the pecan sector, but it will not include shelling or further processing employment or sales in the calculation of the sector’s overall impact on New Mexico’s economy).3 Second, the program treats employment broadly. That is, the program treats all employment as full-time employment.
While input-output analysis requires rather strong assumptions and the IMPLAN modeling software is limited in its treatment of labor and forward linkages, the method and the software are commonly used in estimating economic impacts. IMPLAN has been used for measuring economic impacts of a variety of agricultural industries on regional economies. Examples include: Miller and Armbruster (1991) estimate the impact of grape juice production on the economy of Arkansas, Holland and Yeo (2001) estimate the impacts of Washington’s potato industry on Idaho’s economy, and Hall and Skaggs (2002) approximate the impact of vegetable production on New Mexico’s economy.
IMPLAN agricultural employment data are based on national output employment ratios and as such will not necessarily model New Mexico’s agriculture accurately. There are two possible approaches to handling the problem of adapting national production relationships to regional relationships. First, because input-output analysis is only an estimate of production and production relationships, national ratios and relationships can be maintained and readers reminded of possible discrepancies in the final estimates, e.g., see Hall and Skaggs (2002). Second, IMPLAN offers flexibility in adjusting its databases so that the model can estimate regional or local impacts more accurately. This paper uses the first approach, i.e., national production relationships are maintained with the caution that final estimates may not fully reflect the impact of New Mexico’s pecan production industry on the state’s economy.4
As a cross check of the IMPLAN results, the impact of the pecan industry was also evaluated using RIMS II (Regional Input Output Models Version II). The RIMS II system is a commonly used alternative to the IMPLAN multipliers and is produced by the U.S. Department of Commerce, Bureau of Economic Analysis (www.bea.gov). Together, RIMS II and IMPLAN are the two most commonly used input-output modeling tools for conducting economic impact analysis. Both models are ultimately based on the same national input-output model, but they are converted to regional models in different ways. The IMPLAN model uses Regional Purchase Coefficients (RPCs) while the RIMS II approach to regionalization is based on location quotients (LQs). The debate over the use of RPCs versus LQs has been intense, but the technical details are not important in the present context. Below, the IMPLAN results are presented first. The discussion of the IMPLAN results is followed by a summary of the remarkably similar results from RIMS II.
Results
Employment Impact. IMPLAN analysis estimates that pecan production directly accounts for an estimated 821 employees within the state. Additional employment resulting from indirect and induced effects is estimated to equal 1,047.8 jobs. The direct employment effect represents the highest portion of jobs resulting from the industry (44%), followed by indirect employment (37%) and induced employment (19%). A breakdown on how the IMPLAN model allocates these jobs within the state’s different employment sectors is shown in Table 1.
Table 1. Pecan Production Employment Impacts.
| Sector / Industry | Direct Effects |
Indirect Effects |
Induced Effects |
Total Effects |
| Agriculture | 821.1 | 520.5 | 3.4 | 1,345.1 |
| Mining | 9.0 | 1.4 | 10.4 | |
| Construction | 10.7 | 5.9 | 16.6 | |
| Manufacturing | 25.0 | 6.7 | 31.7 | |
| Transportation, communications and utilities |
22.3 | 13.2 | 35.4 | |
| Retail and wholesale trade | 41.8 | 130.9 | 172.6 | |
| Finance, insurance and real estate | 26.3 | 28.7 | 55.0 | |
| Services | 42.5 | 147.0 | 189.5 | |
| Government | 1.7 | 4.0 | 5.6 | |
| Other | 6.9 | 6.9 | ||
| Total Employment | 821.1 | 699.6 | 348.2 | 1,868.9 |
Economic Impact. Economic (dollar) impact estimates from the IMPLAN model are provided in Table 2. The direct effect of pecan production on the state’s economy was estimated at $70,400,0005, the indirect effect at $32,103,688, and the induced effect at $23,868,376. The total effect of pecan production on the state’s economy was estimated at $126,372,065. Table 2 shows a more detailed breakdown of the sector’s effects.
Table 2. Output Impacts (National Coefficients).
| Sector / Industry | Direct Effects |
Indirect Effects |
Induced Effects |
Total Effects |
| Agriculture | $70,400,000 | $8,554,381 | $216,609 | $79,170,992 |
| Mining | 2,904,018 | 462,066 | 3,366,085 | |
| Construction | 642,962 | 397,666 | 1,040,629 | |
| Manufacturing | 7,953,530 | 1,542,844 | 9,496,373 | |
| Transportation, communications and utilities |
3,575,300 | 2,249,677 | 5,824,977 | |
| Retail and wholesale trade | 3,396,082 | 5,513,851 | 8,909,933 | |
| Finance, insurance and real estate | 2,577,453 | 5,487,756 | 8,065,210 | |
| Services | 2,242,820 | 7,363,063 | 8,065,883 | |
| Government | 257,141 | 572,887 | 9,605,883 | |
| Other | 61,956 | 830,028 | ||
| Total Output | $70,400,000 | $32,103,688 | $23,868,376 | $126,372,065 |
Multipliers. Multipliers are the ratios of the dollar of input to the final dollar of economic output. SAM (Social Accounting Matrix) multipliers are calculated as (direct effects + indirect effects + induced effects) / direct effects. The multipliers can be used as a predictive tool to describe how a change in one sector will affect the regional economy. The employment multiplier was estimated at 2.28 (1,868.9 / 3,821.1) and the economic output multiplier was estimated to be 1.80 ($126,372,065 / $70,400,000). These multipliers summarize the total impact (either in employment or dollar output) that can be expected from a change in economic activity within the pecan production sector. For example, the employment multiplier of 2.28 indicates that the addition of 100 new jobs to the pecan production sector would result in an additional 128 jobs ((2.28 × 100) − 100) within the state in related industries. Similarly, the output multiplier of 1.80 suggests that an increased output of $100 in the pecan production sector will likely lead to additional increases of $80 within the state’s economy ((1.80 × 100) − 100).
The RIMS II analysis of the pecan industry produces virtually the same results as IMPLAN for both employment and total economic activity. The employment and output (economic activity) impacts estimated using RIMS II Total Multipliers are summarized and compared to the IMPLAN results in Table 3. The RIMS II estimates of the impact of the pecan industry in New Mexico on total employment differ by only 21 jobs (1.1 percent) while the estimated impact on economic activity differs by only $1.9 million (1.5 percent).
Table 3. RIMS II and IMPLAN Pecan Industry Impacts Compared.
| RIMS II | IMPLAN | |
| Employment effects (number of jobs) Direct Indirect† Total |
804 1,044 1,848 |
821 1,048 1,869 |
| Economic activity (output) effects (in millions) Direct Indirect Total |
$70.4 $54.1 $124.5 |
$70.4 $56.0 $126.4 |
| † Indirect effects in Table 3 include indirect and induced effects. | ||
Conclusion
In terms of cash receipts, pecan production ranks fourth among New Mexico’s agricultural products (behind milk, cattle and calves, and hay). This paper has shown that pecan production has a significant impact within the agricultural sector (an estimated $79 million in 2003) as well as in other areas of New Mexico’s economy (estimated to be $47 million dollars). While it is believed that the results accurately represent pecan production’s impact on the state’s economy, caution should be exercised when interpreting the results, as 2000 production relationships are used in the model in order to facilitate estimation of tree nut impacts. It should also be noted that the full impact of the pecan industry has yet to be determined as linkages between value-added manufacturing and pecan production and their resulting economic impacts have yet to be estimated. This analysis suggests additional work that needs to be completed.
References
Chase, Robert A., Philip J. Bourque & Richard S. Conway, 1993. “The 1987 Washington State Input-Output Study (Replaces corrupted copy),” Urban/Regional 9311001, Economics Working Paper Archive at WUSTL, revised 10 Nov 1993.
Conway, Richard S., Jr. 1977. “The Stability of Regional Input-Output Multipliers.” Environment and Panning A. 9:197–214
Hall, T. Y. and R. K. Skaggs. “Economic Impact of Southern New Mexico Vegetable Production and Processing.” New Mexico Chile Task Force. Report 9. [On-line] Available at: https://pubs.nmsu.edu/research/horticulture/CTF9.pdf (accessed February 3, 2005).
Holland D. and J. H. Yeo. 2001. The Economic Impact of Potatoes in Washington State. XB1039, Agricultural Research Center, College of Agricultural, Consumer and Environmental Sciences, Washington State University, Pullman, WA. [On-line] Available at http://www.agribusiness-mgmt.wsu.edu/AgbusResearch/docs/eb1925.pdf (accessed February 3, 2005).
Leatherman, John C. 1994. “Input-Output Analysis of the Kickapoo River Valley.” Agricultural Economics Working Paper. Staff Paper 94.2. [On-line] Available at: http://www.aae.wisc.edu/cced/942.pdf.
Miller, W. P. and T. Armbruster. 1991. Economic Impact of Table Grape Production in Arkansas. University of Arkansas. Cooperative Extension Service. Little Rock, AR.
Minnesota IMPLAN Group, Inc., IMPLAN System (data and software), 1725 Tower Drive West, Suite 140, Stillwater, MN 55082 www.implan.com.
Mulkey, D. and A. W. Hodges. 2001. Using IMPLAN to Assess Economic Impacts. Department of Food and Resource Economics, IFAS, University of Florida, Gainesville, FL. [On-line] Available at: http://edis.ifas.ufl.edu/pdffiles/FE/FE16800.pdf (accessed February 3, 2005).
New Mexico Department of Agriculture. 2002. “2002 New Mexico Agricultural Statistics.” [On-line] Available at: http://www.nass.usda.gov/Statistics_by_State/New_Mexico/index.asp (accessed February 3, 2005).
United States Department of Agriculture – Economic Research Service (USDA–ERS). 2004. Livestock, Dairy, and Poultry Newsletter. LDP-M-126. December 28, 2004.
United States Department of Agriculture – National Agricultural Statistics Service (USDA–NASS). 2002. “2002 Census of Agriculture.” Available at: http://www.agcensus.usda.gov/Publications/2002/USVolume104.pdf.
United States Department of Agriculture –National Agricultural Statistics Service. 2005. “Noncitrus Fruits and Nuts 2004 Preliminary Summary.” Fr Nt 1–3 (05). January 2005, pp 70-72.
1 Estimation of induced effects requires the economic system be treated as a closed system so that consumers are considered part of the production process. In the IMPLAN software used for this analysis, closing the system requires the use of the SAM (Social Accounting Matrix) multiplier. Closing the system effectively means that the analysis accounts for commuting, social security and income taxes and savings by households (Mulkey & Hodges, 2003). It is common for analysts to use SAM multipliers (and thus incorporated induced effects) in economic impact studies (Hall & Skaggs, 2002).
2 Several authors report that often production relationships within these database tables can remain relatively stable over time. See, for example, Chase, Bourque and Conway (1993) and Conway (1977).
3 Future research that incorporated value-added processing of pecans is planned.
4 IMPLAN databases are constructed using national production figures. The program used in this analysis uses the industry category of “tree nuts” in estimating linkages between economic sectors of the economy. A large portion of national pecan production occurs in Georgia and Texas where unimproved varieties are common. New Mexico’s pecan production is made up of improved pecan varieties. Differences in pecan production between unimproved and improved pecan varieties include yield differences and differences in planting density.
5 The direct effect of the pecan industry was based on New Mexico Agricultural Statistics 2003 estimates of value of production. It should be noted that 2003 was a high bearing year in the alternating cycle of pecan production (2002 value of production was estimated at $45,000,000).
To find more resources for your business, home, or family, visit the College of Agricultural, Consumer and Environmental Sciences on the World Wide Web at aces.nmsu.edu.
Contents of publications may be freely reproduced for educational purposes. All other rights reserved. For permission to use publications for other purposes, contact pubs@nmsu.edu or the authors listed on the publication.
New Mexico State University is an equal opportunity/affirmative action employer and educator. NMSU and the U.S. Department of Agriculture cooperating.
Published and electronically distributed May 2007, Las Cruces, NM.