New Mexico Milk Production- Estimated Impacts on the State's Economy
Bulletin 790
Jay M. Lillywhite, Hilary Sullivan, Terry Crawford and Nick Ashcroft
College of Agricultural, Consumer and Environmental Sciences, New Mexico State University (Print Friendly PDF)
Authors: Respectively, Assistant Professor, Department of Agricultural Economics & Agricultural Business; Assistant Professor, Department of Animal & Range Sciences; College Professor, Department of Agricultural Economics & Agricultural Business; and Economic Development Specialist, Cooperative Extension Service, all of New Mexico State University, Las Cruces.
Description of the Dairy Industry
New Mexico’s dairy industry has expanded rapidlyin the last 20 years. In the early 1990s, New Mexico had approximately 80,000 cows on 105 farms producing about 1.5 billion pounds of milk annually. Today there are 180 dairies with 325,000 dairy cows producing more than 6.5 billion pounds of milk per year (Fig. 1). Milk is now the number one agricultural commodity in terms of cash receipts in New Mexico (NMDA, 2002). The state ranks seventh in the nation in milk production and eighth in the nation in cheese production (Fig. 2). The growth of the New Mexico dairy industry in the last two years has slowed because of low milk prices. However, dairy prices rebounded in 2004 1 and growth is expected to continue in the future.
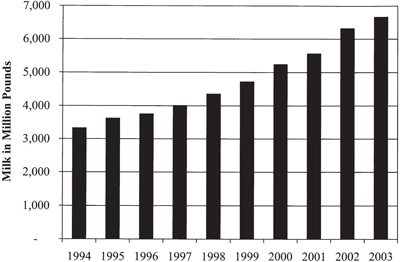
Figure 1. New Mexico Milk Production, 1994–2003.
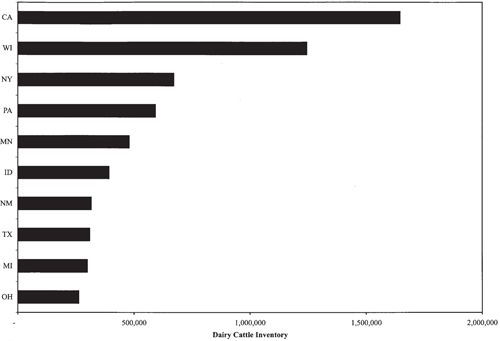
Figure 2. U. S. Dairy Cattle Inventories, 2002.
While the impact of the dairy industry can be felt throughout the state, New Mexico’s dairies are generally found within six regions: the upper Rio Grande (Albuquerque area), the lower Rio Grande, Roswell, Artesia, Portales/Clovis, and Lea counties (Fig. 3). In 2004, Chavez County produced 1.8 billion pounds of milk worth approximately $223 million. Following Chavez County in annual milk production are Roosevelt, Curry, and Doña Ana counties with each producing between $120–150 million worth of milk in 2003.
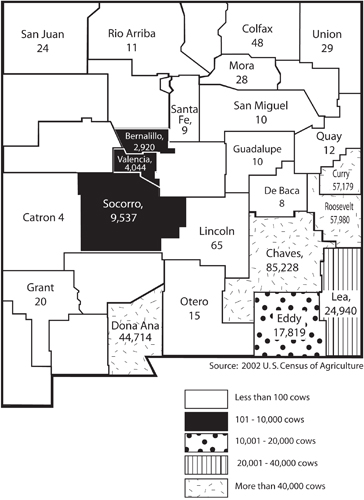
Figure 3. Dairy Cows on Farm, New Mexico.
The dairy industry plays a key role in the state’s agricultural sector and has an important influence on the state’s overall economy. Industry milk sales account for 38 percent of the state’s gross receipts for agricultural commodities (NMDA, 2002). Sales of cull animals and bull calves to the beef industry also add to the overall gross sales of the industry. In addition, the dairy industry impacts upstream marketing channel participants such as feed suppliers (e.g., hay and grain producers) and financial institutions.
Milk, by statute, must be further processed before it is delivered to the consumer whether it be bottled for fluid consumption or used to manufacture cheese, butter, or non-fat dry milk (NFDM). Because per capita milk production in New Mexico is more than 400 gallons per person per year, the vast majority (85 percent) of milk produced within the state is made into value-added products. There are approximately 51 milk-processing facilities (including fluid-milk processing, e.g., bottling plants and cheese manufacturing plants) located in the Southwest Federal Milk Marketing Order (FMMO). Eleven of these plants are located in New Mexico.
Dairy production also has a large impact on the state’s labor market. The New Mexico Department of Labor estimates that approximately 3,000 individuals are employed in the dairy industry. 2 It is estimated that payroll taxes from this labor pool are in excess of $4.2 million per year.
This paper discusses New Mexico’s dairy industry and provides economic impact estimates of this industry on the state’s economy. Economic impacts are estimated using the input-output model contained in the software program Impact Analysis for Planning (IMPLAN). The next section provides a brief overview of input-output modeling as used in economic impact analysis, as well as a description of the IMPLAN software.
Economic Impact Analysis: Methods and Tools
Input-Output Analysis. Input-output analysis was originally developed by the economist Wassily W. Leontief in the 1930s. Derived from general equilibrium analysis, initially input-output analysis was used as a tool to help economists model national economies. Input-output analysis has been described as a method of quantifying interrelationships between sectors of a complex economic system. Input-output models detail the movement of dollars between producers and consumers of goods and services. The approach uses structural coefficients that represent the relationship between factors of production used as inputs in the production process and the resulting outputs produced by each sector. Interdependence between sectors is modeled by a set of linear relationships that balance total sector inputs within the system to the sector’s total output.
Today input-output analysis is commonly used to estimate the economic impact of a particular industry on a local or regional level. While input-output modeling is usually used to assess the impact of a particular sector’s reaction to some underlying change (e.g., change in a tax policy) to a region’s economy, the analysis can be expanded to estimate the overall impact that a particular sector has on a regional economy by modeling the entire sector as a change (Hall and Skaggs). Input-output modeling has been used by a variety of government and nongovernmental agencies including the Bureau of Labor Statistics, the U.S. Department of Labor, the Bureau of Economic Analysis of the U.S. Department of Commerce and numerous universities (Chase, Bourque and Conway, 1993).
Input-output analysis allows analysts to simplify complex economies in such a way that impacts upon an individual sector of industry can be estimated. Simplifying assumptions used in input-output analysis include: (1) homogeneous outputs are generated within a sector (e.g., input-output analysis does not consider underlying value differences of products within a single sector; rather it examines total output and input usage in terms of dollar amounts); (2) linear production functions analysis does not allow for factor substitution or economies of size, e.g., the model does not account for possible substitutions between factors of production such as labor and capital, and there are no efficiency gains from increased sizes of production; and (3) time is static within the model, and resources within the sectors are fully utilized (Leatherman, 1994).
Common input-output models divide the economic impact of a particular sector into three related effects: direct, indirect and induced. Direct effects are dollar estimates of impacts to the economy resulting from inputs purchased by businesses within the sector under consideration (the value of alfalfa purchased by a dairy producer from a farmer is an example of the direct effect). Indirect effects are the dollar impacts to the economy as the result of input suppliers for the industry under question purchasing inputs from other sectors within the economy (an alfalfa farmer purchasing a tractor from an implement dealer because the farmer has more product to sell to the dairy industry is an example of an indirect impact). Finally, induced effects are the value of increased spending by households resulting from increased incomes that were generated through direct and indirect effects (an employee of a farm implement dealer whose job is indirectly affected by dairy production purchasing a television at a discount store is an example of an induced effect). 3
IMPLAN. Impact Analyses and Planning (IMPLAN) is a combination of software program and underlying informational databases. The program, first used in 1979, was initially developed by the U.S. Forest Service in cooperation with the Federal Emergency Management Agency and the U.S. Department of Interior’s Bureau of Land Management (BLM) to facilitate land resource management (Mulkey and Hodges, 2003; Implan, 2000). Development of the program and its associated databases was privatized in 1993. Today, exclusive development of the program and its associated database is under the control of the Minnesota Implan Group, Inc.
IMPLAN Professional 2.0 software (released in 1999) was used for this research. While a 2002 database containing updated sector relationships was available at the time of this report, the researchers opted to use an earlier 2000 database because the updated (2002) IMPLAN database has adopted NAICS categories, which aggregates all agricultural industries into three groups. In contrast, the 2000 database uses SIC categories, which enables dairy production to be isolated from other agricultural production. 4
Several assumptions implicitly in the IMPLAN model should be identified. First, IMPLAN identifies and measures backward linkages only. That is, the program only examines the economic impact of goods and services purchased by the industry under analysis in order to produce its product. The program does not estimate the dollar impacts of forward linkages (e.g., in the dairy study here, the model will include input industries such as alfalfa production and veterinary services in estimating the total impact of the dairy production sector; but it will not include cheese manufacturing employment or sales in the calculation of the dairy production sector’s overall impact). 5 Second, the program treats employment rather broadly. That is, the program does not distinguish between full-time or part-time employment (employment numbers include both full-time and part-time positions).
While input-output analysis requires rather severe assumptions—and the IMPLAN modeling software is limited in its treatment of labor and forward linkages—the method and the software are commonly used in estimating economic impacts. IMPLAN has been used to measure the economic impacts of a variety of agricultural industries on regional economies. Examples include: Miller and Armbruster (1991) estimate the impacts of grape juice production in Arkansas; Holland and Yeo (2001) estimate the impacts of Washington’s potato industry on the state’s economy; and Hall and Skaggs (2002) estimate the impact of high-value vegetable production on New Mexico’s economy.
Agricultural data in IMPLAN are based on national output employment ratios and as such will not necessarily model New Mexico’s agriculture accurately. There are two possible approaches to handling the problem of adapting national production relationships to regional relationships. First, because input-output analysis is only an estimate of production and production relationships, national ratios and relationships can be maintained; readers reminded of possible discrepancies in the final estimates see Hall and Skaggs (2002) for an example.Second, IMPLAN offers flexibility in adjusting its databases so that the model can estimate regional or local impacts more accurately. In the body of this paper, the first approach is taken, that is, national production relationships are maintained with the caveat that final estimates will not perfectly reflect New Mexico’s dairy industry and its impacts on the state’s economy. In an appendix to the paper, additional estimates are provided, where production relationships for a majority of the agricultural sectors have been adjusted to more accurately represent New Mexico’s production system. Adjustments of the agricultural sectors were based on interviews with producers and others knowledgeable about New Mexico’s agricultural production system. 6
Results
Employment Impact. IMPLAN analysis estimates that the dairy production sector directly accounts for 3,423 employees within the state (approximately 0.38 percent of the state’s total labor force). This number is relatively close to the number reported by the New Mexico Department of Labor and is consistent with the rule-of-thumb of one employee per 100 cows. The difference may be explained by the way in which IMPLAN accounts for employment (allotments for part-time employment are not made). Additional employment estimates resulting from indirect and induced effects are provided in table 1. Indirect effects represented the largest portion of total employees attributable to dairy production, with approximately 39 percent of the total 11,440 jobs. Induced effects and direct effects followed with 32 percent and 30 percent of the total employment impact, respectively.
Table 1. Employment Impacts (National Coefficients)
| Sector / Industry | Direct Effects |
Indirect Effects |
Induced Effects |
Total Effects |
| Agriculture | 3,423.4 | 2,839.8 | 35.7 | 6,298.9 |
| Mining | 22.2 | 14.9 | 37.1 | |
| Construction | 163.3 | 61.2 | 224.5 | |
| Manufacturing | 42.4 | 69.8 | 112.1 | |
| Transportation, communications and utilities |
322.6 | 136.3 | 459.0 | |
| Retail and wholesale trade | 498.4 | 1,355.6 | 1,853.9 | |
| Finance, insurance and real estate | 202.9 | 297.2 | 500.1 | |
| Services | 302.4 | 1,523.0 | 1,825.4 | |
| Government | 16.3 | 41.3 | 57.6 | |
| Other | 0.0 | 71.8 | 71.8 | |
| Total Employment | 3,423.4 | 4,410.2 | 3,606.8 | 11,440.4 |
Economic Impact. Economic impact estimates—defined as a state’s gross receipts—generated from the IMPLAN model are provided in table 2. The direct effect of dairy production on the state’s economy was estimated at $851,646,912, 7 the indirect effect on output at $221,867,212 and the induced effect at $247,250,015. The total effect of dairy production on the state’s economy as measured by gross receipts was estimated at $1.32 billion. Table 2 shows a more detailed breakdown of the sector’s output effects.
Table 2. Output Impacts (National Coefficients)
| Sector / Industry | Direct Effects |
Indirect Effects |
Induced Effects |
Total Effects |
| Agriculture | $ 851,646,912 | $ 61,792,068 | $ 2,243,663 | $ 915,862,624 |
| Mining | 7,090,425 | 4,786,524 | 11,876,949 | |
| Construction | 9,136,706 | 4,119,632 | 13,256,068 | |
| Manufacturing | 17,339,470 | 15,982,232 | 33,321,702 | |
| Transportation, communications and utilities |
46,363,796 | 23,303,296 | 69,667,088 | |
| Retail and wholesale trade | 40,816,424 | 57,120,260 | 97,936,688 | |
| Finance, insurance and real estate | 20,461,696 | 56,848,156 | 77,309,856 | |
| Services | 16,103,911 | 76,270,336 | 92,374,248 | |
| Government | 2,762,716 | 5,934,301 | 8,697,017 | |
| Other | 0 | 641,886 | 641,886 | |
| Total Output | $ 851,646,912 | $ 221,867,212 | $ 247,250,015 | $ 1,320,764,126 |
Multipliers. A multiplier is the ratio of the dollar of input to the final dollar of economic output. Social Accounting Matrix (SAM) multipliers can be calculated as (direct effects + indirect effects + induced effects) / direct effects. The multipliers can be used as a predictive tool to describe how a change in one sector will affect the regional economy. The employment multiplier was estimated at 3.34 (11,440.4/3,423.4) and the output multiplier was estimated at 1.55 ($1,320,764,126/$851,646,912). These multipliers summarize the total impact (either in employment or output) that can be expected from a change in economic activity within the dairy production sector. For example, the employment multiplier of 3.34 indicates that the addition of 100 new jobs to the dairy production sector would result in an additional 234 jobs ((3.34 × 100) − 100) within the state in related industries. Similarly, the output multiplier of 1.55 suggests that increased output of $100 in the dairy production sector will likely lead to additional increases of $55 within the state’s economy ((1.55 × 100) − 100).
Conclusion
While compared to some industries (e.g., defense), New Mexico’s dairy industry is still rather small, the industry has a significant influence on both New Mexico’s agriculture and its general economy. Using the popular input-output analysis program IMPLAN, we estimate New Mexico’s dairy production industry contributes a total of 11,440 jobs and $1.32 billion to the state’s economy. When other industry-related activities are included (e.g., dairy processing), the dairy industry’s impact on the state’s economy is even greater. Often the economic influence of dairy production within the state is felt in rural areas. Given the current growth trend in New Mexico’s dairies, it is likely that the economic impact of the sector on both local economies and the state economy will continue to grow. Additional work regarding the total impact of the dairy industry, including impacts associated with value-added processing such as cheese production, remains to be completed.
References
Chase, Robert A., Philip J. Bourque & Richard S. Conway. 1993. “The 1987 Washington State Input-Output Study (Replaces corrupted copy).” Urban/Regional 9311001, Economics Working Paper Archive at WUSTL, revised 10 Nov 1993.
Conway, Richard S., Jr. 1977. “The Stability of Regional Input-Output Multipliers.” Environment and Panning A. 9:197–214
Hall, T. Y. and R. K. Skaggs. “Economic Impact of Southern New Mexico Vegetable Production and Processing.” New Mexico Chile Task Force. Report 9. [On-line] Available at: https://pubs.nmsu.edu/research/horticulture/CTF9.pdf (accessed February 3, 2005).
Holland D. and J. H. Yeo. 2001. The Economic Impact of Potatoes in Washington State. XB1039, Agricultural Research Center, College of Agricultural, Consumer and Environmental Sciences, Washington State University, Pullman, WA. [On-line] Available at http://www.agribusiness-mgmt.wsu.edu/AgbusResearch/docs/eb1925.pdf (accessed February 3, 2005).
Leatherman, John C. 1994. “Input-Output Analysis of the Kickapoo River Valley.” Agricultural Economics Working Paper. Staff Paper 94.2. [On-line] Available at: http://www.aae.wisc.edu/cced/942.pdf.
Miller, W. P. and T. Armbruster. 1991. Economic Impact of Table Grape Production in Arkansas. University of Arkansas. Cooperative Extension Service. Little Rock, AR.
Minnesota IMPLAN Group, Inc., IMPLAN System (data and software), 1725 Tower Drive West, Suite 140, Stillwater, MN 55082, www.implan.com.
Mulkey, D. and A. W. Hodges. 2001. Using IMPLAN to Assess Economic Impacts. Department of Food and Resource Economics, IFAS, University of Florida, Gainesville, FL. [On-line] Available at: http://edis.ifas.ufl.edu/pdffiles/FE/FE16800.pdf (accessed February 3, 2005).
New Mexico Department of Agriculture. 2002. “2002 New Mexico Agricultural Statistics.” [On-line] Available at: http://www.nass.usda.gov/nm/nmbulletin/bulletin02.htm (accessed February 3, 2005).
United States Department of Agriculture – Economic Research Service (USDA-ERS). 2004. Livestock, Dairy, and Poultry Newsletter. LDP-M-126. December 28, 2004.
1 USDA-ERS, Livestock, Dairy, and Poultry Newsletter, LDP-M-126, Dec. 28, 2004, p 1.
2 This roughly corresponds to the generally accepted standard of one employee for every 100 cows, which in the case of New Mexico’s dairy production would equate to 3,280 employees.
3 Estimating induced effects requires “closing” the economic system in such a way that consumers are considered part of the production process. In the IMPLAN software used for this analysis, closing the system requires the use of the SAM (Social Accounting Matrix) multiplier. Closing the system effectively means that the analysis accounts for commuting, social security and income taxes, and savings by households (Mulkey and Hodges, 2003). It is common for analysts to use SAM multipliers (and thus incorporated induced effects) in economic impact studies (Hall and Skaggs, 2002).
4 Several authors report that often production relationships within these database tables can remain relatively stable over time. See, for example, Chase, Bourque and Conway (1993) and Conway (1977).
5 Future research that incorporates value-added processing of milk and milk products is planned.
6 IMPLAN databases are constructed using national production figures. Within the national dairy sector a large portion of dairy production occurs in the Midwest. Midwest dairy farms tend to be smaller than those in New Mexico and tend to grow a larger portion of their own feed. The larger dairies of New Mexico are more profitable, purchase more forages off the farm, purchase more large equipment and are more mechanized, and purchase more specialized services including accounting, legal services and dairy consultant services.
7 Future research that incorporates value-added processing of milk and milk products is planned.
Appendix
Appendix A. Economic Impacts with Regional Adjustments: Employment Impacts (State Adjustments)
| Sector / Industry | Direct Effects |
Indirect Effects |
Induced Effects |
Total Effects |
| Agriculture | 3,964.0 | 2,260.0 | 35.1 | 6,259.0 |
| Mining | 24.8 | 15.1 | 39.9 | |
| Construction | 437.2 | 66.9 | 504.1 | |
| Manufacturing | 69.5 | 68.2 | 137.7 | |
| Transportation, communications and utilities |
653.8 | 114.6 | 768.4 | |
| Retail and wholesale trade | 1,178.7 | 1,159.5 | 2,338.2 | |
| Finance, insurance and real estate | 444.7 | 238.7 | 683.4 | |
| Services | 728.1 | 1,290.8 | 2,018.8 | |
| Government | 39.7 | 37.2 | 76.9 | |
| Other | 0.0 | 68.2 | 68.2 | |
| Total Employment | 3,964.0 | 5,836.5 | 3,094.1 | 12,894.5 |
Appendix B. Economic Impacts with Regional Adjustments: Output Impacts (State Adjustments)
| Sector / Industry | Direct Effects |
Indirect Effects |
Induced Effects |
Total Effects |
| Agriculture | $ 851,646,912 | $ 133,025,984 | $ 2,110,861 | $ 986,753,744 |
| Mining | 4,621,612 | 2,779,269 | 7,400,881 | |
| Construction | 24,411,748 | 4,288,878 | 28,700,624 | |
| Manufacturing | 15,663,360 | 13,163,159 | 28,826,520 | |
| Transportation, communications and utilities |
90,493,832 | 18,249,776 | 108,743,608 | |
| Retail and wholesale trade | 98,610,368 | 45,591,740 | 144,202,112 | |
| Finance, insurance and real estate | 44,610,864 | 44,382,960 | 88,993,824 | |
| Services | 35,557,836 | 58,994,272 | 94,552,104 | |
| Government | 5,468,398 | 4,607,413 | 10,075,811 | |
| Other | 0 | 575,843 | 575,843 | |
| Total Output | $ 851,646,912 | $ 452,646,001 | $ 194,744,170 | $ 1,498,855,070 |
To find more resources for your business, home, or family, visit the College of Agricultural, Consumer and Environmental Sciences on the World Wide Web at aces.nmsu.edu.
Contents of publications may be freely reproduced for educational purposes. All other rights reserved. For permission to use publications for other purposes, contact pubs@nmsu.edu or the authors listed on the publication.
New Mexico State University is an equal opportunity/affirmative action employer and educator. NMSU and the U.S. Department of Agriculture cooperating.
Published and electronically distributed May 2007, Las Cruces, NM.