Guide Z-135
Tullaya Boonsaeng and Jay Lillywhite
College of Agricultural, Consumer and Environmental Sciences, New Mexico State University
Authors: Respectively, Research Scientist, Agricultural Economics and Agricultural Business (AEAB); Associate Dean/Director and Professor for Agricultural Experiment Station (AES). College of Agricultural, Consumer, and Environmental Sciences, New Mexico State University. (Print-friendly PDF).

Introduction
Winemaking in New Mexico has a long tradition and importance to the state’s economy. The wine industry generates close to $1.12 billion in total economic activity in the State of New Mexico.1 However, the sector has also faced numerous challenges, including labor shortages, extreme temperatures, frost, and wind. Although the state’s high elevation can favor certain grape varieties, frost and wind remain constant challenges throughout the state.2
New Mexico has more than 30 wineries, producing wines from over 75 different grape varieties grown on the state’s 925 acres of vineyards.2,3 This publication provides up-to-date information on the average prices of wines sold online, categorized by varietal. Wine pricing data is based on information collected from the official websites of individual wineries. Understanding both the pricing and usage of specific wine grape varietals offers valuable insights into the wine industry and market trends.
U.S. Wine Market
Consumption
Although both per capita and total wine consumption in the U.S. have declined (see Table 1), consumers are spending more than ever on the wines they choose to drink.4 According to the Wine Institute,5 wine consumption steadily increased from 1992 and peaked at 3.16 gallons per capita in 2021. However, it dropped to 2.96 gallons per capita in 2022 and further declined to 2.86 gallons per capita in 2023, marking the lowest level in the past 12 years. Total wine consumption in 2023 was 899 million gallons, the lowest level recorded in the past nine years.
|
Table 1. U.S. Wine Consumption |
||
|---|---|---|
|
Year |
Total wine per resident* |
Total wine gallons (million) |
|
2018 |
3.00 |
982 |
|
2019 |
2.94 |
971 |
|
2020 |
3.12 |
1040 |
|
2021 |
3.16 |
1060 |
|
2022 |
2.96 |
986 |
|
2023 |
2.68 |
899 |
|
Source: https://wineinstitute.org/our-industry/statistics/us-wine-consumption/.5 *Based on all wine types including sparkling wine, dessert wine, vermouth, other special natural and table wine, using Bureau of the Census resident population. Per capita consumption will be higher if based on legal drinking age population. |
||
Despite this decline in volume, total wine sales in the U.S. reached $107.4 billion in 2023, showing a significant upward trend over the past six years, as shown in Table 2.6 U.S. wine sales in 2023 were more than $107 billion, 46% above the $73 billion reported in 2018 (see Table 2).
|
Table 2. U.S. Wine Sales in Billions $ from 2018-2023 |
|
|---|---|
|
Year |
U.S. wine sales (Billions $) |
|
2018 |
73.4 |
|
2019 |
78.6 |
|
2020 |
80.0 |
|
2021 |
92.2 |
|
2022 |
102.2 |
|
2023 |
107.4 |
Red wine has dominated global wine consumption for more than 30 years, but recent trends indicate a shift in consumer preferences, with an increasing number of wine drinkers choosing white wines.7 According to the International Organization of Vine and Wine (OIV),8 wine drinkers are increasingly favoring whites and rosés, which now account for more than half of consumption.9 In the U.S., rosés wine has significantly increased in popularity over the past two decades.9
Despite this growth, the wine industry faces challenges in attracting younger consumers. In the U.S., the rise in wine sales is primarily driven by individuals over 60 years old, while Gen Z and Millennials are increasingly favoring ready-to-drink cocktails, tequila, and rum.6 When they do choose wine, younger drinkers show a clear preference for light, crisp, and refreshing white wines.7
In 2022, Washington, D.C. residents had the highest annual per capita wine consumption in the U.S., averaging 8.14 gallons of wine, approximately 41 bottles of wine. In contrast, New Mexico residents had an annual per capita consumption of 2.33 gallons, equating to around 12 bottles of wine (Table 3).
|
Table 3: Annual Per Capita Ethanol Consumption in Gallons of Wine and Per Capita Consumption in Gallons of Wine in 2022, by State |
|||||
|---|---|---|---|---|---|
|
State |
Per capita ethanol consumption in gallons of wine |
Per capita consumption in gallons of wine* |
State |
Per capita ethanol consumption in gallons of wine |
Per capita consumption in gallons of wine* |
|
District of Columbia |
1.05 |
8.14 |
Indiana |
0.36 |
2.79 |
|
New Hampshire |
0.80 |
6.20 |
Missouri |
0.35 |
2.71 |
|
Vermont |
0.72 |
5.58 |
Maryland |
0.34 |
2.64 |
|
Delaware |
0.68 |
5.27 |
Tennessee |
0.34 |
2.64 |
|
California |
0.62 |
4.81 |
Louisiana |
0.33 |
2.56 |
|
Hawaii |
0.58 |
4.50 |
Texas |
0.33 |
2.56 |
|
Florida |
0.57 |
4.42 |
North Dakota |
0.31 |
2.40 |
|
Massachusetts |
0.57 |
4.42 |
Ohio |
0.31 |
2.40 |
|
Nevada |
0.57 |
4.42 |
New Mexico |
0.30 |
2.33 |
|
Oregon |
0.57 |
4.42 |
Pennsylvania |
0.30 |
2.33 |
|
Alaska |
0.53 |
4.11 |
Idaho |
0.29 |
2.25 |
|
Connecticut |
0.53 |
4.11 |
Wyoming |
0.29 |
2.25 |
|
Rhode Island |
0.52 |
4.03 |
Georgia |
0.25 |
1.94 |
|
New Jersey |
0.51 |
3.95 |
Alabama |
0.24 |
1.86 |
|
Virginia |
0.51 |
3.95 |
South Carolina |
0.24 |
1.86 |
|
Montana |
0.50 |
3.88 |
Arkansas |
0.23 |
1.78 |
|
North Carolina |
0.49 |
3.80 |
Iowa |
0.22 |
1.71 |
|
Washington |
0.49 |
3.80 |
Kentucky |
0.22 |
1.71 |
|
Illinois |
0.48 |
3.72 |
Nebraska |
0.21 |
1.63 |
|
Colorado |
0.47 |
3.64 |
South Dakota |
0.21 |
1.63 |
|
New York |
0.46 |
3.57 |
Mississippi |
0.19 |
1.47 |
|
Maine |
0.42 |
3.26 |
Oklahoma |
0.18 |
1.40 |
|
Michigan |
0.39 |
3.02 |
Utah |
0.17 |
1.32 |
|
Minnesota |
0.39 |
3.02 |
Kansas |
0.15 |
1.16 |
|
Wisconsin |
0.39 |
3.02 |
West Virginia |
0.11 |
0.85 |
|
Arizona |
0.38 |
2.95 |
|||
|
Source: https://www.niaaa.nih.gov/sites/default/files/surveillance-report121.pdf#page=13.27 Note: *Conversion of Ethanol Content 0.129 for wine, and per capita consumption is based on State population estimates for people ages 14 and older from the Centers for Disease Control and Prevention’s (CDC) WONDER online query system, which provides population estimates produced by the U.S. Census Bureau. |
|||||
Production
The top wine-producing states in the U.S. include: 1) California, 2) Washington, 3) New York, 4) Pennsylvania, 5) Oregon, 6) Ohio, 7) Michigan, 8) Kentucky, 9) Vermont, and 10) Virginia.10,11 The U.S. produces approximately 800 million gallons of wine annually, with California being the largest producer, accounting for around 84.4% of the total U.S. wine production. New Mexico, ranked twentieth in overall wine production, contributes less than one percent of the nation’s wine output, producing approximately 0.75 million gallons of wine annually (Table 4).
|
Table 4. Wine Production by State 2024 |
|||||
|---|---|---|---|---|---|
|
State |
Annual wine production (million gallons) |
Percent |
State |
Annual wine production (million gallons) |
Percent |
|
California |
680.300 |
84.394 |
Idaho |
0.497 |
0.062 |
|
Washington |
40.700 |
5.049 |
Maryland |
0.436 |
0.054 |
|
New York |
28.000 |
3.474 |
Illinois |
0.392 |
0.049 |
|
Pennsylvania |
12.400 |
1.538 |
Iowa |
0.336 |
0.042 |
|
Oregon |
11.800 |
1.464 |
Minnesota |
0.332 |
0.041 |
|
Ohio |
5.900 |
0.732 |
Georgia |
0.276 |
0.034 |
|
Michigan |
2.600 |
0.323 |
Arkansas |
0.246 |
0.031 |
|
Kentucky |
2.200 |
0.273 |
Arizona |
0.190 |
0.024 |
|
Vermont |
2.200 |
0.273 |
New Hampshire |
0.159 |
0.020 |
|
Virginia |
2.200 |
0.273 |
South Dakota |
0.30 |
2.33 |
|
Texas |
1.900 |
0.236 |
0.140 |
0.017 |
2.25 |
|
North Carolina |
1.900 |
0.236 |
Connecticut |
0.135 |
0.017 |
|
New Jersey |
1.800 |
0.223 |
Nebraska |
0.120 |
0.015 |
|
Florida |
1.600 |
0.198 |
Kansas |
0.104 |
0.013 |
|
Indiana |
1.400 |
0.174 |
South Carolina |
0.078 |
0.010 |
|
Tennessee |
1.300 |
0.161 |
Oklahoma |
0.070 |
0.009 |
|
Wisconsin |
1.100 |
0.136 |
Maine |
0.048 |
0.006 |
|
Missouri |
0.994 |
0.123 |
West Virginia |
0.041 |
0.005 |
|
Massachusetts |
0.793 |
0.098 |
Louisiana |
0.038 |
0.005 |
|
New Mexico |
0.750 |
0.093 |
Alabama |
0.035 |
0.004 |
|
Colorado |
0.557 |
0.069 |
Montana |
0.033 |
0.004 |
|
Total U.S. Wine Production |
800.1 million gallons |
||||
|
Source: https://worldpopulationreview.com/state-rankings/wine-production-by-state |
|||||
New Mexico Wines
The history of winemaking in New Mexico dates back to the early Spanish settlers, when monks planted the first grapevines along the banks of the Rio Grande to produce wine for religious ceremonies.12 By the 1880s, New Mexico had twice the grape acreage of New York and was the fifth largest wine producer in the United States.13 However, a devastating Rio Grande flood in 1943 wiped out most of the region’s vineyards, and the state’s commercial wine industry never fully recovered.14
In 1977, the first small commercial winery called La Vina winery opened its doors, creating wine from grape varieties that thrived in New Mexico’s hard winters and blistering summers. Then, in the same year La Chiripada Winery planted its vines in Northern New Mexico, and opened its first vintage in 1981.15
Vineyards
More than 2,000 acres of vineyards were planted around Las Cruces between 1982 and 1983.14,15 In 1985, total grape acreages were 4,100 acres across New Mexico.16 Currently, vineyard acreages are falling, with total grape plantings dropping from 1,280 acres across 376 grape farms in 1997 to just 925 acres with 274 grape farms still operation in 2022 (see Table 5).
|
Table 5. New Mexico Grapes by Acres and Farms for year 1997, 2002, 2007, 2012, 2017, and 2022 |
|||||||
|---|---|---|---|---|---|---|---|
|
Grape |
Types |
Year |
|||||
|
1997 |
2002 |
2007 |
2012 |
2017 |
2022 |
||
|
Total |
Acres |
1,249 |
1,030 |
1,103 |
1,153 |
1,280 |
925 |
|
Farms |
154 |
247 |
227 |
516 |
376 |
274 |
|
|
Bearing age acres |
Acres |
533 |
930 |
964 |
1,129 |
721 |
|
|
Farms |
166 |
201 |
349 |
270 |
201 |
||
|
Nonbearing age acres |
Acres |
497 |
173 |
189 |
151 |
204 |
|
|
Farms |
115 |
71 |
254 |
180 |
124 |
||
Wineries
Today, New Mexico is home to approximately 34 wineries,12 most of these wineries are small or family operated. The two largest wineries, Gruet Winery and Lescombes Winery, produce 400,000 and 200,000 cases annually, respectively; together they account for about 60% of the state’s wine production.17 Additionally, Noisy Water Winery in Ruidoso produces approximately 40,000 cases each year. Most grapes are grown in southern New Mexico, stretching from Anthony to Deming and Lordsburg see Figure 1.17
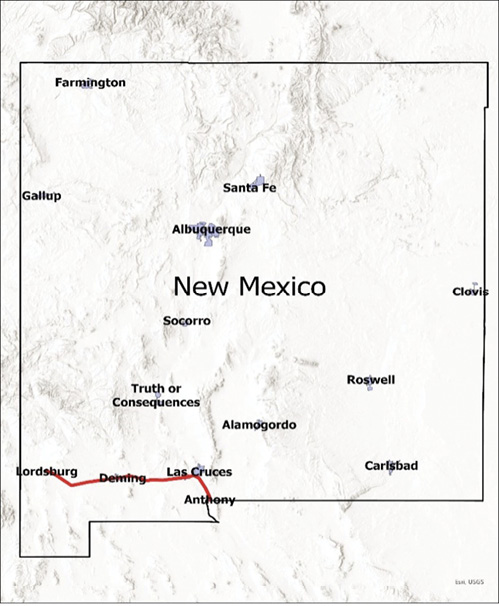
Figure 1. Map of New Mexico showing where grapes are grown in the state.
Marketing
Most winemakers in New Mexico still rely on direct-to-consumer sales through tasting rooms, wine festivals, and local events for their revenue.18 Few have expanded beyond state borders. For example, Noisy Water is adopting a segmented approach, initially targeting Texas and Arizona, while Wines of the San Juan has extended its sales to the Colorado market.19
To promote local wine culture and tourism, New Mexico Wine has hosted annual Harvest Festivals in Albuquerque and Las Cruces for over three decades.13 The state also supports a growing agritourism sector, offering wine tastings and vineyard tours to attract visitors.20-22
Red Wines
Among red wine varietals, Cabernet Sauvignon is the most widely produced red wine varietal in New Mexico, featured by 23 wineries. Merlot is the next most popular, produced by 19 wineries, followed by Pinot Noir and Sangiovese, each used by 13 wineries. Other commonly grown red varietals include Syrah/Shiraz, Tempranillo, Malbec, Cabernet Franc, and Zinfandel. However, red blends—crafted from a mix of different grape varieties—are the most frequently produced red wines in the state, with 28 wineries making them (Figure 2).
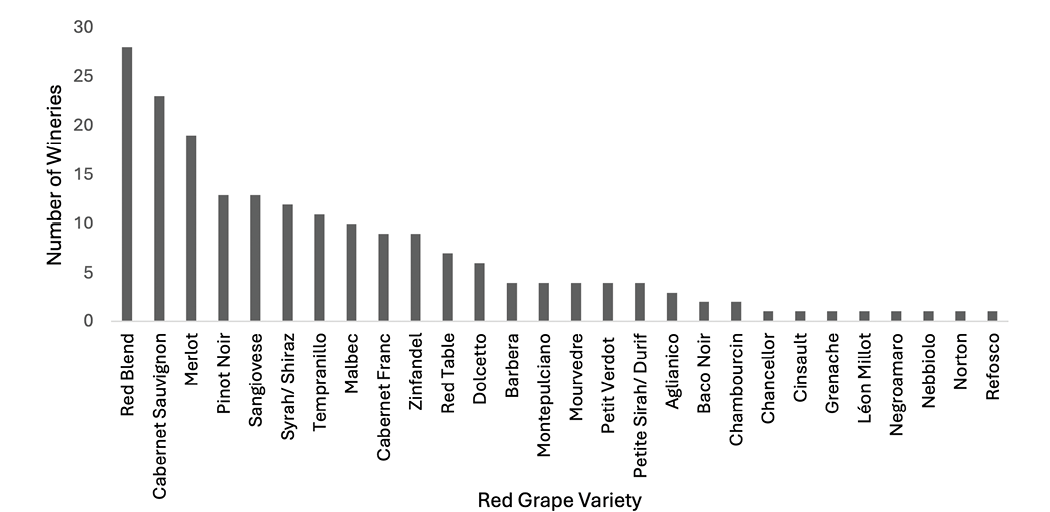
Figure 2. New Mexico Wineries Offering Red Wines Online, by Variety.
The average prices per bottle for popular red wine grape varietals grown in New Mexico are as follows: $34.70 for Cabernet Sauvignon, $27.20 for Merlot, $34.00 for Pinot Noir, $26.30 for Sangiovese, $32.50 for Syrah/Shiraz, $28.70 for Tempranillo, $30.20 for Malbec, $37.00 for Cabernet Franc, and $28.70 for Zinfandel (Figure 3). Cabernet Sauvignon and Red Blend have a significantly wider price range compared to other red grape varietals. The average prices for Petite Sirah/Durif, Aglianico, and Nebbiolo are $44.20, $45.70, and $50.00 per bottle, respectively, making them the top-priced red wine varieties in New Mexico. In contrast, the average prices for lower-tier red wines are as follows: $18.80 per bottle for Red Table wine, $20.00 for Cinsault, $22.00 for Chancellor, and $24.00 for Negroamaro, Norton, and Refosco.
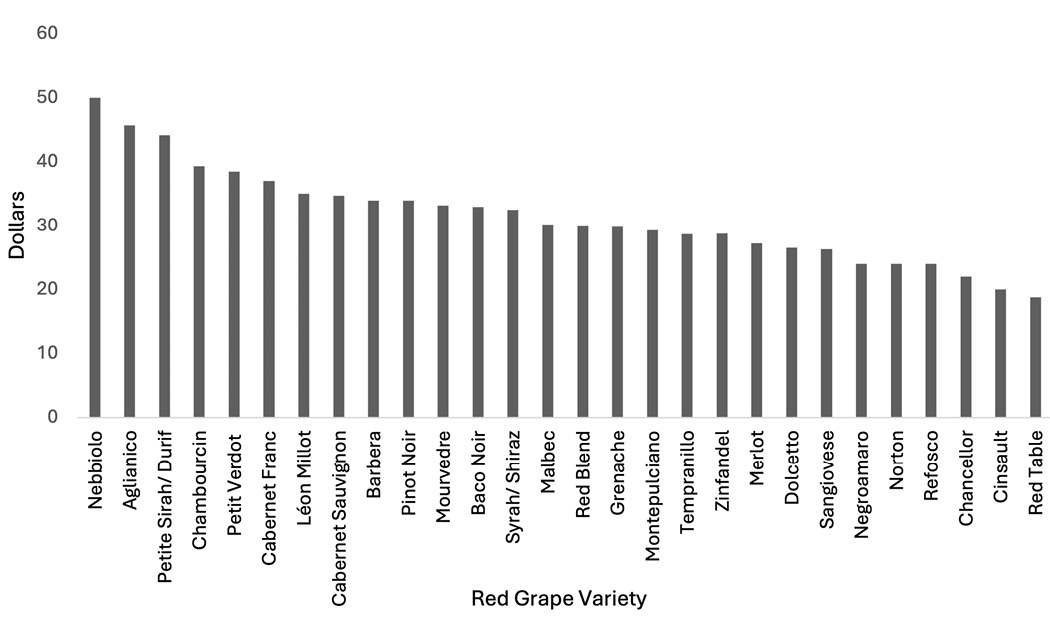
Figure 3. Average Price for Red Wines Offered Online by New Mexico Wineries, by Variety.
White Wines
Chardonnay, Riesling, and Muscat/Moscato were identified as the top white wine grape varieties produced by New Mexico wineries. As shown in Figure 4, 70.6% of wineries (24 wineries) produce Chardonnay, 59% of wineries (20 wineries) produce Riesling, and 50% of wineries (17 wineries) produce Muscat/Moscato. The average price per bottle for these popular white wine varietals is $24.90 for Chardonnay, $21.90 for Riesling, and $21.60 for Muscat/Moscato.
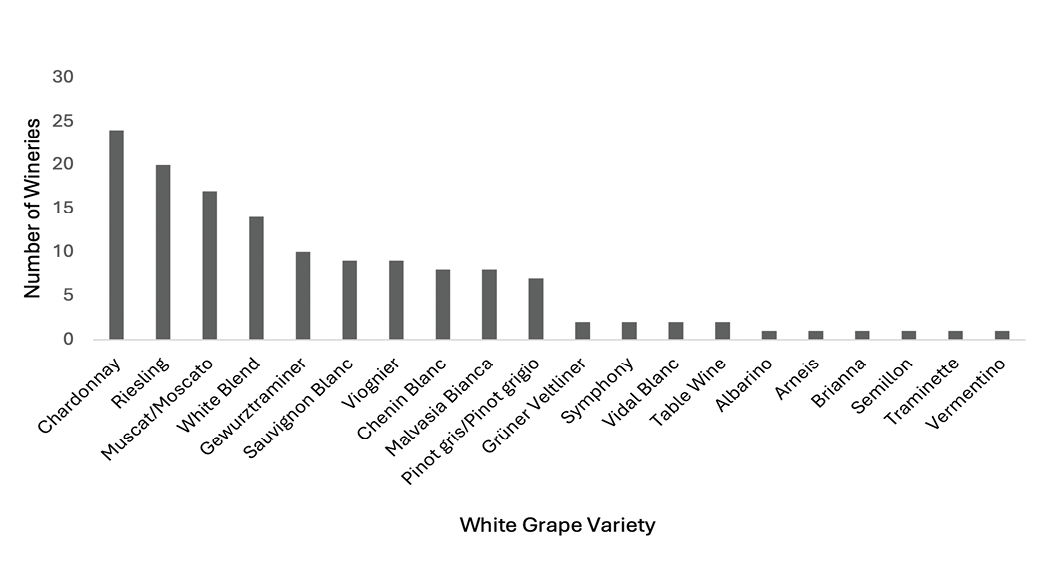
Figure 4. New Mexico Wineries Offering White Wines Online, by Variety.
In Figure 5, the highest average price for white wine grape varietal is $27.00 per bottle for Alberino, followed by Symphony at $25.50 and Chenin Blanc at $25.00. In contrast, the average prices for lower-tier white wines are $17.00 for Traminette, $18.00 for Vermentino, and $19.00 for Arneis. Most white varietals are priced between $20.00 and $25.00 per bottle.
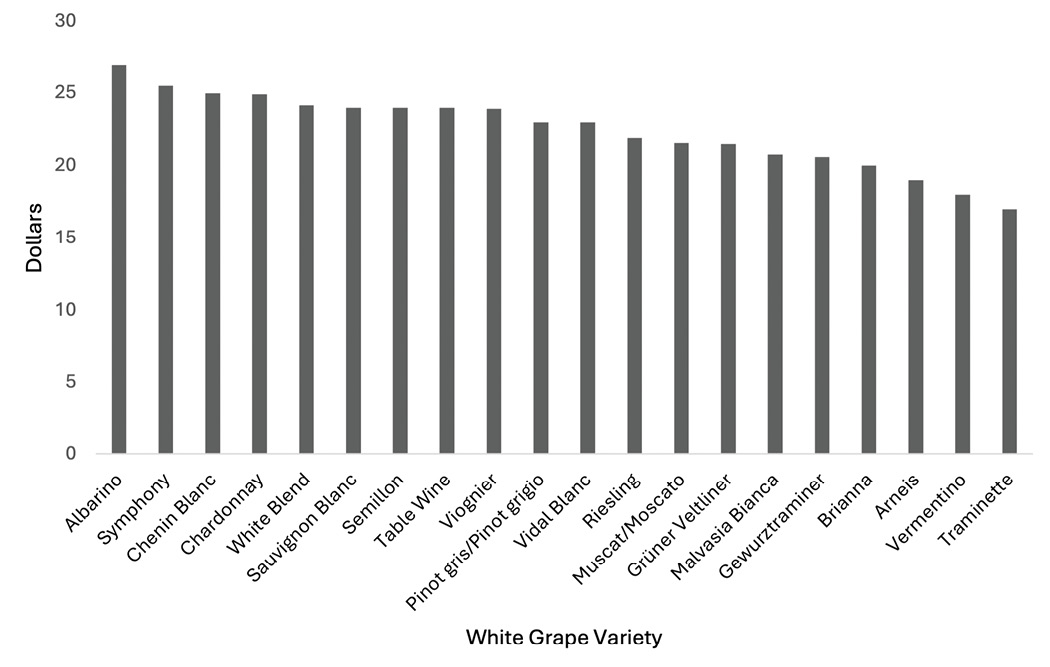
Figure 5. Average Price for White Wines Offered Online by New Mexico Wineries, by Variety.
Other Wines
Port wine is a sweet red wine, commonly served with dessert.23,24 It has a significantly wider price range than other wines, with online prices offered by New Mexico wineries ranging from $22.00 to $87.00 per bottle. Dessert wine, also sweet and typically served with dessert, has an average price of $31.25 per bottle. In comparison, the average price for Port wine is $38 per bottle.
White Zinfandel is a popular rosé wine produced by New Mexico wineries. The average price range for rosé wines in New Mexico is between $19.00 and $27.50 per bottle. Varietals priced under $20.00 include Mission ($18.30), Sangiovese ($19.00), and White Zinfandel ($19.60). On the higher end, Moscato/Muscat and Pinot Noir are among the most expensive rosé varietals, with prices around $27.00 per bottle (see Table 6). New Mexico wineries also offer unique rosé options, such as Pistachio Rosé and various rosé blends, which highlight the diversity of flavors available.
|
Table 6. Minimum and Maximum Price by Type of Red and White Wine |
|||||
|---|---|---|---|---|---|
|
A Wine Varietal* |
Min Price |
Max Price ($/Bottle) |
A Wine Varietal* (White Wine Grape) |
Min Price |
Max Price |
|
Aglianico |
$38 |
$50 |
Albarino |
$27 |
$27 |
|
Baco Noir |
$22 |
$40 |
Arneis |
$19 |
$19 |
|
Barbera |
$22 |
$50 |
Brianna |
$20 |
$20 |
|
Cabernet Franc |
$24 |
$48 |
Chardonnay |
$10 |
$48 |
|
Cabernet Sauvignon |
$14 |
$110 |
Chenin Blanc |
$16 |
$35 |
|
Chambourcin |
$33 |
$45 |
Gewurztraminer |
$14 |
$33 |
|
Chancellor |
$22 |
$22 |
Grüner Veltliner |
$19 |
$24 |
|
Cinsault |
$20 |
$20 |
Malvasia Bianca |
$13.99 |
$27 |
|
Dolcetto |
$17 |
$37 |
Muscat/Moscato |
$10 |
$36 |
|
Grenache |
$30 |
$30 |
Pinot gris/Pinot grigio |
$14 |
$32 |
|
Leon Millot |
$35 |
$35 |
Riesling |
$14 |
$35 |
|
Malbec |
$22 |
$42 |
Sauvignon Blanc |
$20 |
$33 |
|
Merlot |
$14 |
$40 |
Semillon |
$24 |
$24 |
|
Montepulciano |
$22 |
$45 |
Symphony |
$22 |
$29 |
|
Mourvedre |
$25 |
$50 |
Traminette |
$17 |
$17 |
|
Negroamaro |
$24 |
$24 |
Vermentino |
$18 |
$18 |
|
Nebbiolo |
$50 |
$50 |
Vidal Blanc |
$22 |
$24 |
|
Norton |
$24 |
$24 |
Viognier |
$18 |
$32 |
|
Pinot Noir |
$20 |
$68 |
Table Wine |
$20 |
$32 |
|
Petit Verdot |
$30 |
$48 |
White Blend |
$18 |
$36 |
|
Petite Sirah/ Durif |
$36 |
$65 |
|||
|
Refosco |
$24 |
$24 |
|||
|
Syrah/ Shiraz |
$18 |
$70 |
|||
|
Sangiovese |
$19 |
$44 |
|||
|
Tempranillo |
$20 |
$40 |
|||
|
Zinfandel |
$17 |
$41 |
|||
|
Red Table |
$10 |
$28 |
|||
|
Red Blend |
$14.99 |
$131 |
|||
|
Source: https://nmwine.com/winery/ Note: *A wine varietal is made from a single type of grape. |
|||||
Chardonnay, Chenin Blanc, Mission, Moscato/Muscat, and Pinot Meunier are grape varietals used to produce sparkling wine in New Mexico. The average prices per bottle for these varietals range from $29.80 to $56.50, with the most expensive sparkling wine made from Chardonnay priced at $56.50. In contrast, the average price for a blend sparkling wine is approximately $26.00 per bottle (see Table 7).
|
Table 7. Minimum and Maximum Price of Specialty Wines, and Average Price of Rosé and Sparkling Wines |
|||||
|
Average Price |
|||||
|
Other Wines |
Min Price |
Max Price |
A Wine Varietal* |
Rosé |
Sparkling |
|
Specialty Wines |
Baco Noir |
$22.8 |
|||
|
Port Wine |
$22 |
$87 |
Cabernet Sauvignon |
$24.0 |
|
|
Dessert Wine |
$20 |
$39 |
Chambourcin |
$22.0 |
|
|
Chancellor |
$20.0 |
||||
|
Chardonnay |
$56.5 |
||||
|
Chenin Blanc |
$35.0 |
||||
|
Merlot |
$25.0 |
||||
|
Mission |
$18.3 |
$35.0 |
|||
|
Moscato/ Muscat |
$27.0 |
$29.8 |
|||
|
Petit Verdot |
$24.0 |
||||
|
Pinot Grigio |
$22.0 |
||||
|
Pinot Meunier |
$40.0 |
||||
|
Pinot Noir |
$27.5 |
||||
|
Sangiovese |
$19.0 |
||||
|
Syrah |
$22.0 |
||||
|
White Zinfandel |
$19.6 |
||||
|
Blend |
$22.8 |
$25.6 |
|||
|
Source: https://nmwine.com/winery/ Note: *A wine varietal is made from a single type of grape. |
|||||
Based on online offerings from New Mexico winery websites, 17.6% of wineries (6 in total) produce sparkling wine. Gruet Winery stands out as a prominent sparkling wine producer and is recognized as one of the largest producers of Champagne Method sparkling wine in the U.S.25 The majority of Gruet’s wines are made from Pinot Noir and Chardonnay, and in some cases Pinot Meunier.26 Most of their sparkling offerings are blends of Chardonnay and Pinot Noir.
Summary and Conclusion
New Mexico’s wine production is relatively small compared to the overall U.S. wine output, but it plays a significant role in the state’s economy. The industry draws tourists, thanks to the region’s stunning landscapes, year-round outdoor activities—such as hiking, biking, skiing, hunting, fishing, and wildlife viewing—and a wide range of tasting rooms from small, family-run wineries to larger establishments with full winemaking facilities.
Wineries across New Mexico offer a broad selection of red, white, rosé, and sparkling wines. Among 25 red varietals, Cabernet Sauvignon, Merlot, and Pinot Noir are the most popular and are produced by the majority of wineries in the state, with average bottle prices ranging from $27.20 to $34.70. However, prices can vary significantly, from as low as $14.00 to as high as $110.00 per bottle. Less commonly produced but more expensive red varietals, such as Aglianico, Petite Sirah (also known as Durif), and Nebbiolo have higher average prices, ranging from $44.20 to $50.00 per bottle, and are produced by only a small number of wineries.
Among the 18 white wine varietals produced in New Mexico, Chardonnay, Riesling, and Muscat/Moscato are the leading grape varieties, most widely produced by wineries across the state. These typically have average prices per bottle ranging from $21.60 to $24.90, with prices varying between $10.00 and $48.00 unlike red wines, the average prices for white and rosé wines show less variation among varietals. White wines generally range from $17.00 to $27.00 per bottle, while rosé wines average between $18.30 and $27.50. White Zinfandel is a popular rosé wine produced by New Mexico wineries and is priced around $19.60 per bottle.
Sparkling wines in the state also vary in price, with average bottle prices ranging from $25.60 to $56.50, depending on the varietal. Sparkling wines made from Chardonnay grapes tend to be the most expensive, typically priced 30% to 55% higher than other sparkling varieties.
In summary, this publication offers an overview of the U.S. wine market, including trends in wine consumption and a general perspective on wine production by state. This article focuses specifically on current wine prices by grape variety in New Mexico. Together, these insights —covering consumption patterns, production data, and pricing trends—provide valuable information to help New Mexico wine producers make informed decisions.
References
- The National Association of American Wineries. (2022). New Mexico Economic Impact Study. https://wineamerica.org/economic-impact-study/new-mexico-wine-industry/
- Vogt, M. (2022). New Mexico’s Wine Region: Searching for Style. NAPA Valley Life Magazine. https://napavalleylife.com/new-mexicos-wine-region-searching-for-style/
- USDA. (2022). National Agricultural Statistics Service Quick Stats. https://quickstats.nass.usda.gov/
- Caparoso, R. (2024). While Wine Consumption in the U.S. Slumps, American Appreciation of Wine Grows Unabated. Letters from Lodi. LODI WINW California. https://www.lodiwine.com/blog/While-wine-consumption-in-the-U-S--slumps--Americans-are-drinking-as-fast-as-they-can
- Wine Institute. (2024). U.S. Wine Consumption. Wine Statistics. https://wineinstitute.org/our-industry/statistics/us-wine-consumption/
- Dingwall, K. (2023). Reports Say Young Drinkers Are Over Wine. What Do Winemakers Think? Forbes. https://www.forbes.com/sites/katedingwall/2023/02/03/reports-say-young-drinkers-are-over-wine-what-do-winemakers-think/
- Brown, S. (2024). White Wines Outperforming Reds. WINEBUSINESS. https://www.winebusiness.com/news/article/290479
- Ruitenberg, R. (2023). White and Rosé Now Account for More Than Half of Global Consumption, OIV Says. Decanter. https://www.decanter.com/wine-news/white-and-rose-now-account-for-more-than-half-of-global-consumption-oiv-says-518861/
- Hines, C. (2023). Unveiling the Trends and Insights Shaping the Rosé Renaissance. PROVI. https://www.provi.com/blog/the-state-of-rose-trends
- Feilden, E. (2022). Top 10 wine producing states in the US. The drinks business. https://www.thedrinksbusiness.com/2022/09/top-10-wine-producing-states-in-the-us/
- WORLD POPULATION REVIEW. (2024). Wine Production by State 2024. https://worldpopulationreview.com/state-rankings/wine-production-by-state
- VIVA VINO. (2024). New Mexico Wine. https://nmwine.com/
- Savanna. (2023). State Profile: New Mexico Wine Country. The National Association of American Wineries. https://wineamerica.org/news/state-profile-new-mexico-wine-country/
- Street, H.K. (1997). The History of Wine in New Mexico: 400 Years of Struggle. Ponderosa Valley
- Newmexico.org, (2017). A Journey Through the Ages: The Fascinating History of Wine in New Mexico. Retrieved September 3, 2024. https://www.newmexico.org/blog/post/a-journey-through-the-ages-the-fascinating-history-of-wine-in-new-mexico/
- Alimova, N.A., & Lillywhite, J.M. (2006). New Mexico Vineyard Growers’ Survey: Results and Implications [Circular 610]. Cooperative Extension Service, New Mexico State University. https://nmsu.contentdm.oclc.org/digital/collection/AgCircs/id/1838/
- Boetel, R. (2024). Wine Industry Takes Long History to New Heights. Albuquerque Journal. https://www.abqjournal.com/business/wine-industry-takes-long-history-to-new-heights/article_407b9c06-5f29-11ef-b2d3-f7d958dbf9fa.html
- Wetherall, T. (2023). A Case Study in Growing an Emerging Wine State. SevenFiftyDaily – The Business and Culture of Drinks. https://daily.sevenfifty.com/a-case-study-in-growing-an-emerging-wine-state/
- Wines of the San Juan. (2025). Retailers & Restaurants. https://www.winesofthesanjuan.com/retailers
- Cline, L. (2022). Escape to New Mexico Wine Country. New Mexico Magazine. https://www.newmexicomagazine.org/blog/post/getaway-to-new-mexico-wine-country/
- Gonzalez, M.C. (2023). Discover New Mexico’s Wineries, Breweries on Tasting Tours Starting August. El Paso Times. https://www.elpasotimes.com/story/entertainment/things-to-do/2023/07/28/mesilla-valley-wine-brews-tours-to-offer-winery-brewery-tours/70458807007/
- TEXAS Real FOOD. (2024). Agritourism in New Mexico- Exploring the Land of Enchantment’s Farm-Based Attractions. https://discover.texasrealfood.com/agritourism-by-state/new-mexico
- Puckette, M. (n.d.). What is Port Wine? https://winefolly.com/deep-dive/what-is-port-wine/
- Porter, D., & Prince, D. (2020). Frommer’s Portugal. IDG Books Worldwide.
- Signer, R. (2016). America’s Best Sparkling Wine Surprisingly Comes from New Mexico. VINEPAIR. https://vinepair.com/wine-blog/new-mexico-sparkling-wine-gruet/
- Hughes, A. (2020). 8 Things You Should Know about Gruet Winery. VINEPAIR. https://vinepair.com/articles/gruet-winery-brut-guide/
- Slater, M.E., & Alpert, H.R. (2024). Apparent Per Capita Alcohol Consumption: National, State, and Regional Trends, 1977–2022. SURVEILLANCE REPORT #121. National Institute on Alcohol Abuse and Alcoholism. https://www.niaaa.nih.gov/sites/default/files/surveillance-report121.pdf#page=13

Tullaya Boonsaeng is a Research Scientist in the Department of Agricultural Economics and Agricultural Business at New Mexico State University. She holds a PhD in Economics from North Carolina State University in 2006, an M.A. in Economics from the University of Colorado at Denver in 2000, and a B.S. in Agriculture Economics from Kasetsart University in Thailand in 1996. Dr. Boonsaeng conducts research primarily related to consumer demand and agricultural policy.
To find more resources for your business, home, or family, visit the College of Agricultural, Consumer and Environmental Sciences on the World Wide Web at pubs.nmsu.edu.
Contents of publications may be freely reproduced, with an appropriate citation, for educational purposes. All other rights reserved. For permission to use publications for other purposes, contact pubs@nmsu.edu or the authors listed on the publication. New Mexico State University is an equal opportunity employer and educator. NMSU and the U.S. Department of Agriculture cooperating.
January 2026. Las Cruces, NM.