Guide Z-132
Jason Banegas
College of Agricultural, Consumer and Environmental Sciences, New Mexico State University
Author: Extension Economist and Statewide Forecasting Specialist, College of Agriculture Economics & Agricultural Business, New Mexico State University. (Print-friendly PDF)
Photo by Josh Bachman, 2021. NMSU.
New Mexico Cattle Trends and Outlook
Slaughter rates in New Mexico were low for several years starting about a decade ago and grew as total cattle inventory was expanding. Those rates reached a recent peak in 2020—two years after inventory numbers were at their highest—and have remained inflated over the last several years, in part due to prolonged drought and rising input costs. This has resulted in the gradual downsizing of the New Mexico herd and the liquidation of cattle in the state is expected to continue through 2025 (Figure 1). High feeder calf prices and persistent drought will challenge efforts to rebuild inventories in the state. Decreases in replacement breeding stock will also result in slower herd recovery.
It will take several years to change the trajectory of the State’s cattle inventory given low stock water supplies, elevated temperatures, and declining hay and roughage stocks. Rebuilding of inventories will be slow and will require producers to balance heifer retention, operating processes, and profitability. Although the situation may look dire for now, market signals will begin to incentivize producers and this could be an opportunity for assessing risk and cost management strategies, especially for cow-calf operations.
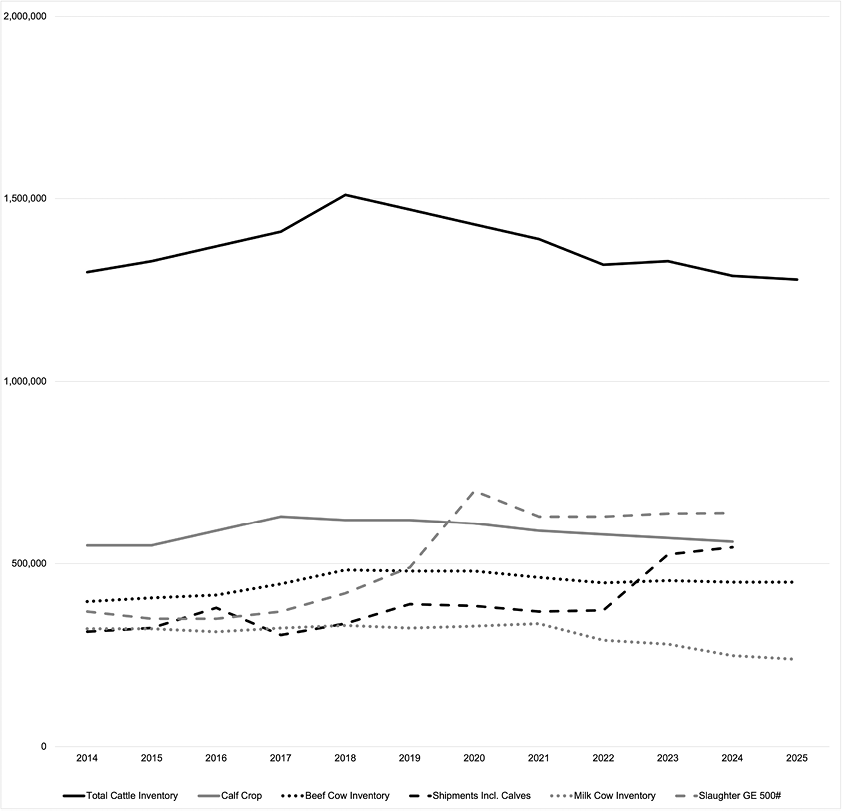
Figure 1. New Mexico Cattle Inventory, Imports, and Slaughter (head). Information obtained from https://quickstats.nass.usda.gov/
Profitability for New Mexico cattle producers can be difficult due to limited marketing options, high feed and other input costs, post-pandemic effects, and challenging weather; however, increasing beef prices in the last few years has given breathing room for producers. Higher cattle market prices allow for better adaptation to market conditions and can provide a better return on investment for preconditioning programs that are harder to justify with low prices. Since herd expansion will be important in the next few years, bred heifer and cow prices are projected to increase greatly and could be 50% more than the last 3 years. Replacement heifer numbers are at their lowest levels in 70 years. Operations that can market replacement heifers could take advantage of the supply shortage; this could be an opportunity especially for New Mexico producers who are in areas where drought conditions are not as extreme, and revenue can be maximized without drastic input cost increases.
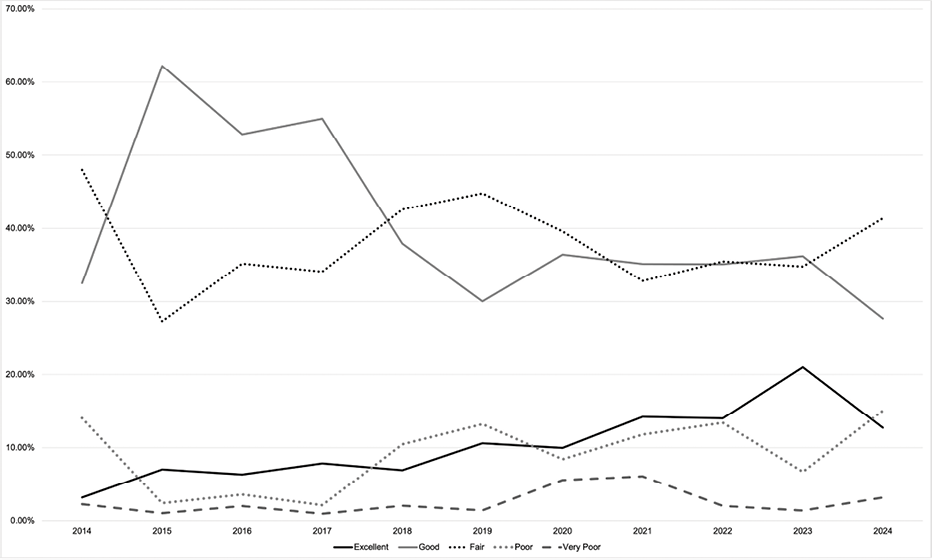
Ranchers have made strides in recent years to improve cattle conditions in the state, and a growing percentage in the USDA Livestock Condition Report have been classified as Excellent. Cattle in 2023 were observed to be in much better condition than the 5-year average despite extreme temperatures, drought, and rising input costs. Condition reports from 2024 have been dismal and show a significant change from the previous trend of increasingly healthier animals. Many cattle in the state slid from Excellent and Good conditions to Fair and Poor (Figure 2). With rising temperatures and limited grazing opportunities in many parts of the state, cattle who have had rough winters can be given supplemental feed along with forage to reverse the early trend of poor conditions before the summer heat.
New Mexico cattle production, gross income, and home consumption increased over the last decade, and similar year-over-year gains are expected for 2025 (Figure 3). Overall inventory decline and border closures pushed prices higher throughout 2024 and the trend is continuing into 2025. Medium frame feeder steer prices averaged around $252/cwt for 2024 (Figure 4) and auction prices for feeder cattle (steers; 550-750 lbs.; all muscle grades, frame, and descriptions) at the end of May 2025 are already over $325/cwt.7
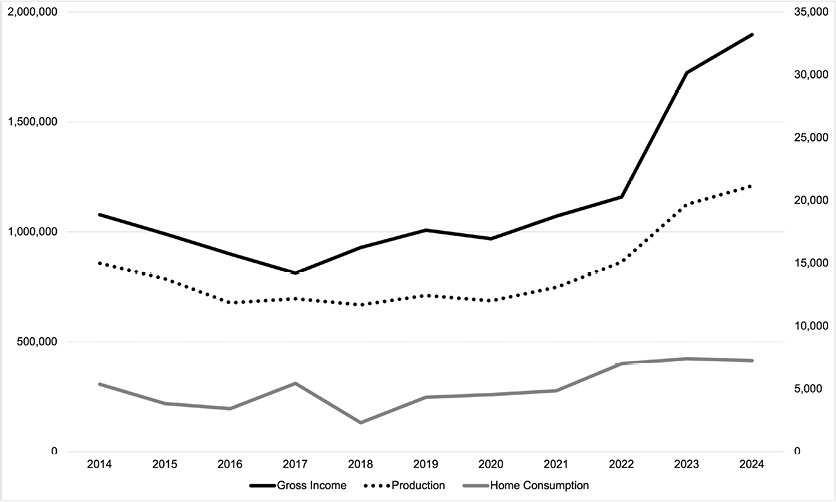
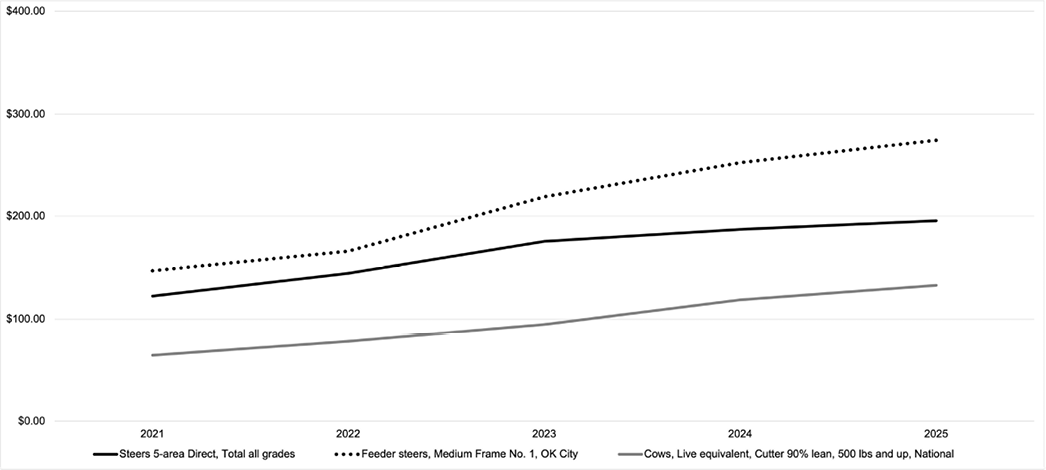
Figure 4. U.S. Beef Cattle Market Prices 2021-2024 ($/cwt).
The outlook for New Mexico producers is mostly positive due to higher projected fed cattle prices and a trend of lower costs for most feed. Hay and roughage supplies in the state were reported as 14% very short, 19% short, and 67% adequate in May 2025, compared with 41% very short, 48% short, and 11% adequate in 2024.8
National hay (alfalfa and other) prices have been on a downward trend over the last two years. The national alfalfa hay price went from $288 in early 2023 to $165 per ton in November 2024. Prices regionally and at the state level have also been on a downward trend. Low hay prices in 2025 are a welcomed sign for livestock producers in New Mexico, as this will reduce input costs.3
There are no major changes in the national corn supply almost halfway through 2025, but strong demand is pushing corn prices slightly higher. The average corn price for the upcoming year is now expected to be about $4.35 per bushel, up by $0.10 (Figure 5). For cattle producers, this means that corn-based feed could become a bit more expensive, especially for those buying feed from outside of the state. U.S. sorghum exports are down due to lower demand from China and more of it is expected to be used domestically for livestock feed. The price of sorghum is slightly cheaper than corn at around $4.25 per bushel. Now is a good time to compare costs between corn and sorghum for your feed needs and consider locking in prices if you can find favorable rates.1 These expected feed costs will mostly be helpful to New Mexico cattle producers, considering that 2025 is projected to be another drought year for most of the state and forage will be at minimum.12,13
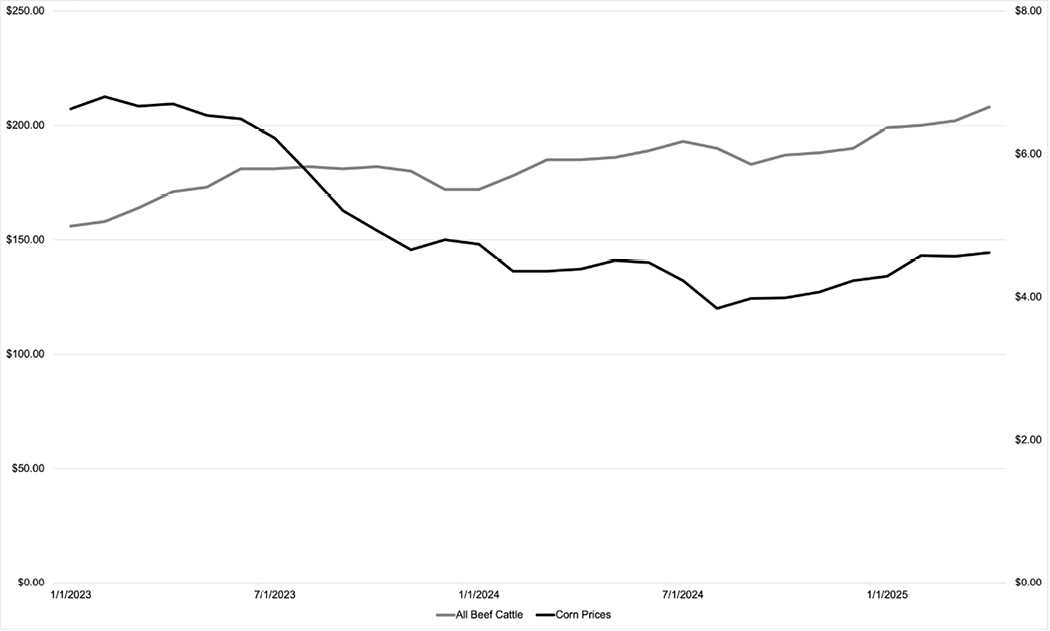
Figure 5. Cattle vs. Corn Prices ($/cwt and $/bushel).
This year producers should evaluate their management practices and consider preconditioning programs so they can produce healthier animals, higher quality beef, and may gain access to value added opportunities. Vaccination and health management programs done early in the year will mitigate losses later in the season, yield higher returns in the marketplace, and provide producers more capital and flexibility to strengthen their enterprises. Third party marketing programs, such as the NMSU’s College of Agricultural, Consumer and Environmental Sciences (ACES) High calf health certification program (https://nmbeef.nmsu.edu/calf/requirements.html), can help add value and price premiums. Producers can use these certifications as tools to market their cattle with the possibility of added profits. These programs assure buyers that the calves are vaccinated and have gone through a health protocol. The early identification of bovine diseases in your herd is another way to mitigate the risks to your cattle business and NMSU has information that can assist you with utilizing local, state, and national resources.
The New Mexico Farm and Ranch Management Program (NM-FARM) is an opportunity for producers to set realistic financial goals and identify areas for improvement in their enterprises by benchmarking and comparing data from other similar agricultural businesses. Producers can participate and benefit from this program while maintaining their privacy. Visit https://nmfarm.nmsu.edu/ to get more information.
The forecast is that New Mexico producers should do well this year if they can retain their advantage in cash markets and if they make timely decisions in weaning, feeding, maintenance schedules, and sales to maximize their returns.
National Numbers
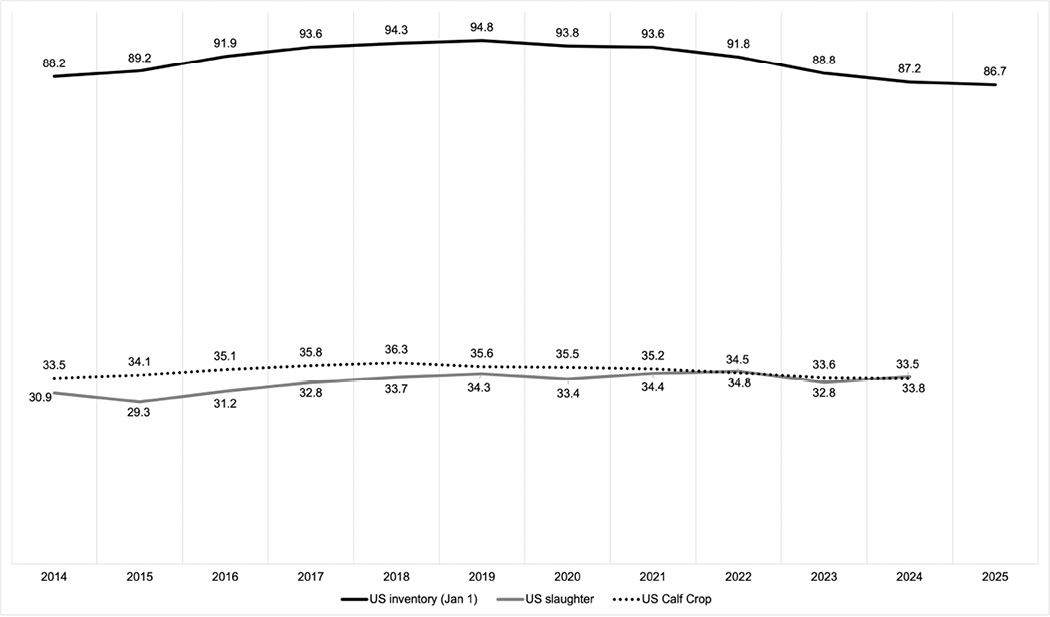
Over the last several years high slaughter rates have reduced U.S. cattle inventories, and the effects of this trend can be seen in smaller calf crops since their recent peak in 2018. Conditions such as extreme heat and continued drought across the country could also limit breeding stock retention and inventory retractions are projected to continue in the near term (Figure 6).
USDA Cattle on Feed (COF) numbers for lots of 1,000 head or more have decreased in response to lower inventory. At the beginning of 2025 COF numbers were 11.8 million, compared to 11.9 million in 2024, 11.7 million in 2023, and approximately 12 million head in 2022, 2021, and 2020.
COF numbers for all feedlots (those with less than 1,000 head and those with 1,000 head or more) were 14.3 million in Jan 2025, 14.4 million in Jan 2024, and 14.2 million in Jan 2023, compared to about 14.7 million the previous three years.11
Early in 2024, beef production was projected to decrease by about 2.4% compared to 2023 figures, with production estimated to drop to just over 26 billion pounds. This was in stark contrast to some other meat and poultry products which had much smaller negative or positive rates of change estimated for 2024 (Figures 7 and 8). Based on December slaughter data, the annual total for 2024 was 26.985 billion pounds.6
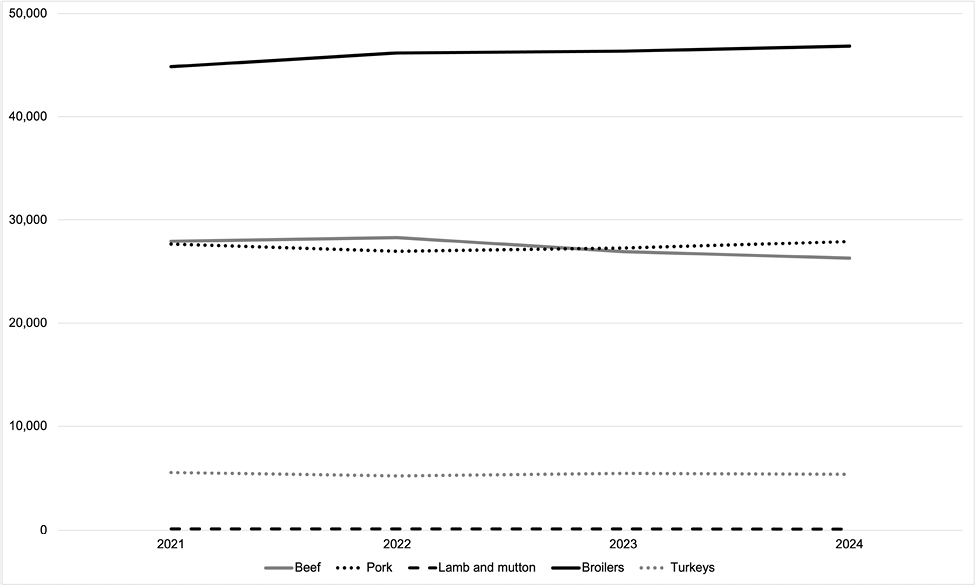
Figure 7. U.S. Meat and Poultry Production (million pounds). Information obtained from https://www.ers.usda.gov/publications/pub-details?pubid=37653
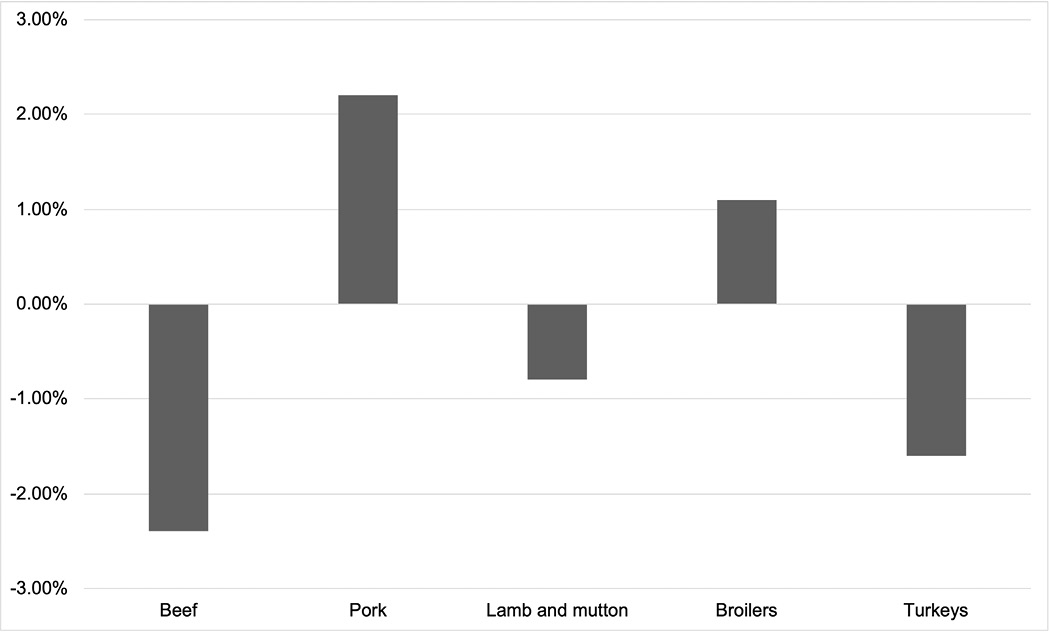
Figure 8. U.S. Meat and Poultry Percent Change in Production from 2023 to 2024.
The beef production forecast in February of 2025 was 26.565 billion pounds5, but an import ban on live cattle from Mexico was put in place on May 11, 2025, due to increased threats from the New World Screwworm.2 USDA and Mexican officials will continue to monitor the outbreak and decide month-to-month whether it is safe to reopen the border.14
The May 2025 USDA production forecast was lowered to 26.423 billion pounds on a slower expected pace of fed cattle slaughter. The restrictions will likely result in constricted supplies of feeder cattle and will reduce U.S. beef production in 2026 by 5% year over year to 25.140 billion pounds.4
Market prices for all cattle classifications have been trending upward with substantial increases since 2022. USDA figures published in January of 2025 expected similar price increases for 2025 as well (Figure 4); however, those figures have been updated to reflect an even higher rate of growth. In the first week of May, prices for Steers in the 5-area marketing region “averaged $220.97 per cwt, more than $35 above the same week last year. Based on recent price data and feedlots slowing the pace of marketings, the 2025 price forecast is raised $9 from last month, with the annual price projected at $214.51 per cwt, 15% higher than in 2024.”4
Live Cattle Trade
Cattle exports grew rapidly from 2018 to 2021 before recently settling (Figure 9). Total exports of U.S. live cattle have increased 47.5% over the 2018-2024 period. Exports to Canada have increased 63%, while exports to Mexico have remained relatively steady. “From 2020 to 2024, the United States has primarily exported feeder cattle to both Canada (79%) and Mexico (12%), in addition to some breeding cattle. However, new markets for U.S. dairy and beef cattle for breeding have emerged in the last 5 years. These markets include Vietnam, Turkey, Pakistan, Saudi Arabia, and Thailand.”9
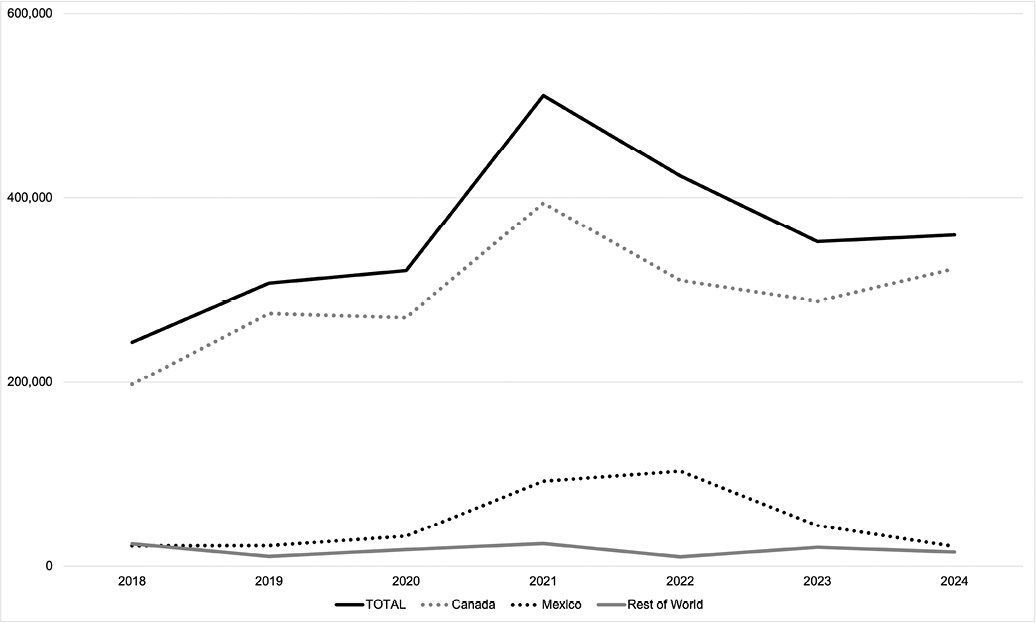
Figure 9. Annual U.S. Cattle Exports (head). Information obtained from https://ers.usda.gov/data-products/livestock-and-meat-international-trade-data
2025 monthly exports are down compared to the previous two years but slightly higher than the decadal average. Exports are expected to be lower than 2023 and 2024 due to dropping domestic inventory and competition (Figure 10).
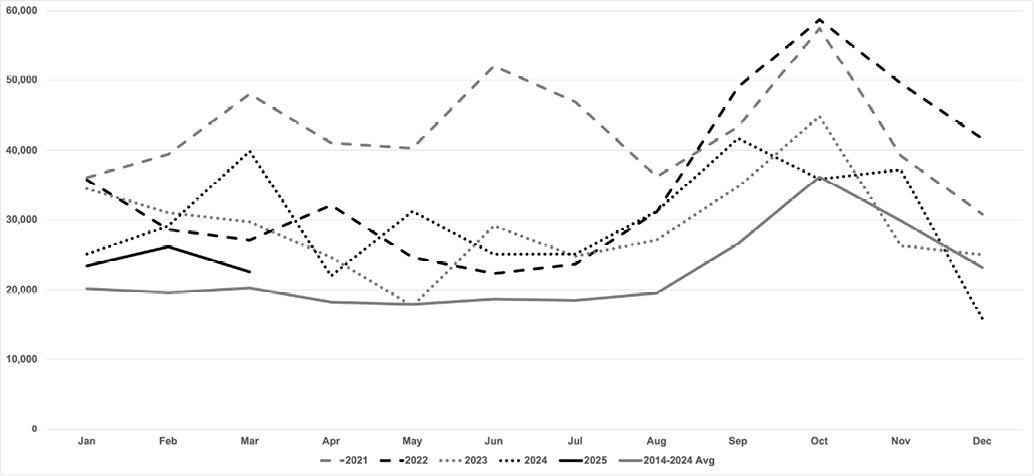
Figure 10. Monthly U.S. Cattle Exports (head). Information obtained from https://ers.usda.gov/data-products/livestock-and-meat-international-trade-data
Imports of cattle into the U.S. were shut down for the last month of 2024 and total import numbers for the first few months of 2025 were also impacted by southern border closures (Figure 11). During the first 3 months of 2025, 28% of cattle imports were from Mexico while 72% were from Canada. These figures are a substantial change from the previous 6-year period when about 63% of imports were Mexican feeder cattle while Canadian imports accounted for approximately 37% of imports and were mostly slaughter ready animals (Figures 12 and 13).
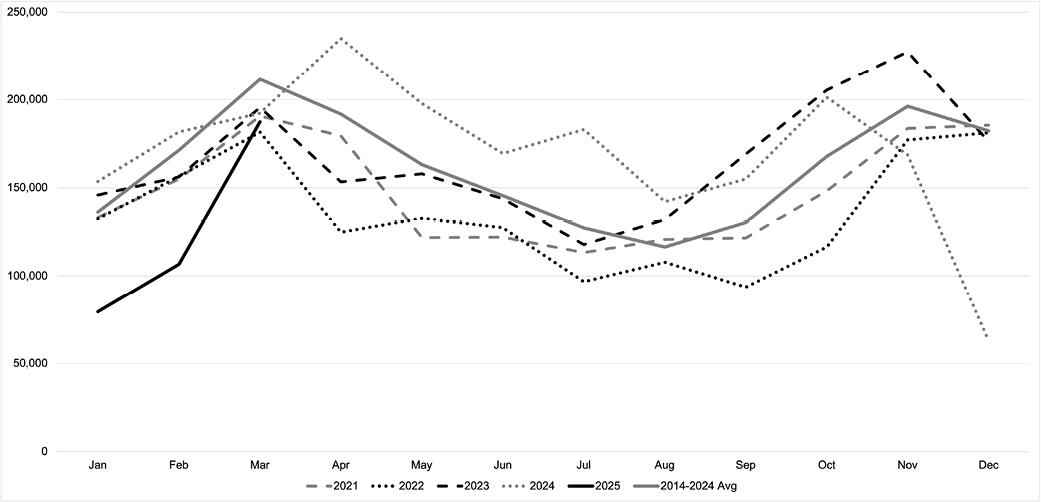
Figure 11. Monthly U.S. Cattle Imports (head). Information obtained from https://ers.usda.gov/data-products/livestock-and-meat-international-trade-data
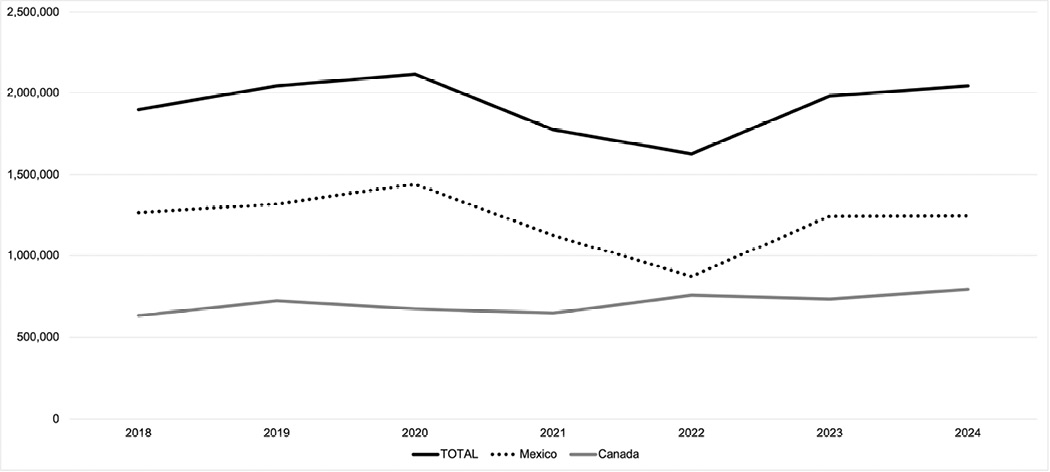
Figure 12. Annual U.S. Cattle Imports (head). Information obtained from https://ers.usda.gov/data-products/livestock-and-meat-international-trade-data
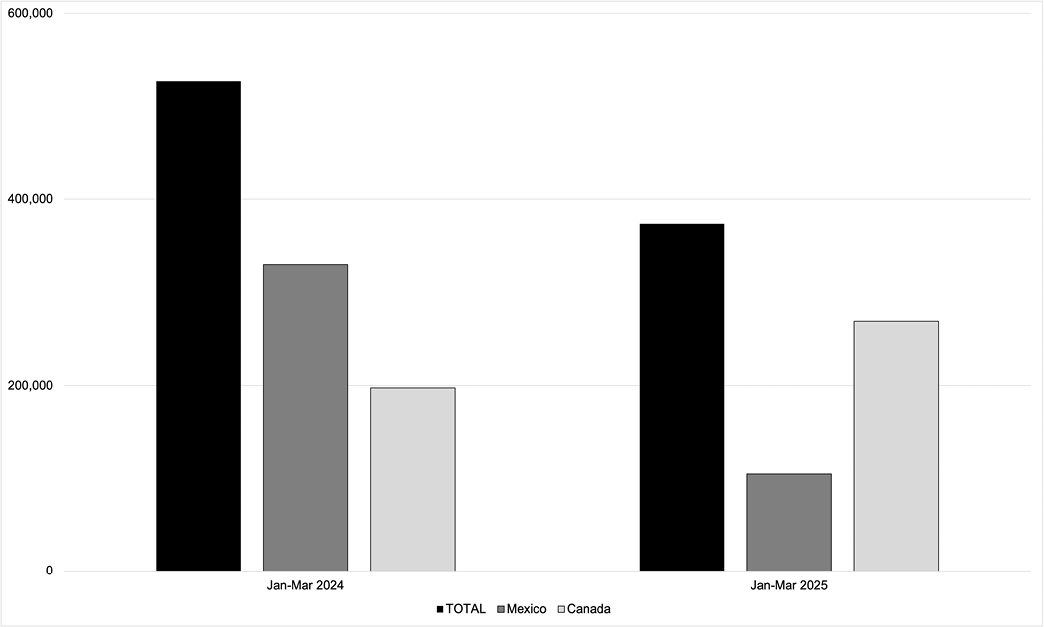
Figure 13. U.S. Cattle Imports for First 3 Months (head).
Imports from Canada should continue to be higher than average in 2025 as restocking the U.S. herd is a priority, finished cattle prices remain elevated, and livestock import restrictions on the southern border remain in place. Over the last several years, about 60% of imports were feeder cattle, 40% were cattle for immediate slaughter, and less than 1% were for breeding.
Beef and Veal
The 2018-2023 period showed an overall decrease in Beef and Veal exports of 4.94%, even though exports reached a record high in 2022 (3.5 billion pounds), mainly due to an explosion in Chinese demand after trade agreements expanded market access (Figure 14). The largest markets for U.S. beef and veal (Japan, South Korea, and China) had significant decreases from 2022 to 2024. Exports as a percentage of production are projected to be around 10% in 2025, compared to approximately 12% from 2020 to 2024. “The combination of fewer supplies available to export, higher beef prices in the United States, and sustained competition from Oceania will continue to create challenges for the expansion of U.S. beef exports.”4 January and February export totals from 2025 were down about 4% compared to 2024. Carcass weights were slightly higher than average in 2024 and are predicted to stay there through 2025. This increase in carcass weights isn’t expected to have a substantial effect on export figures.
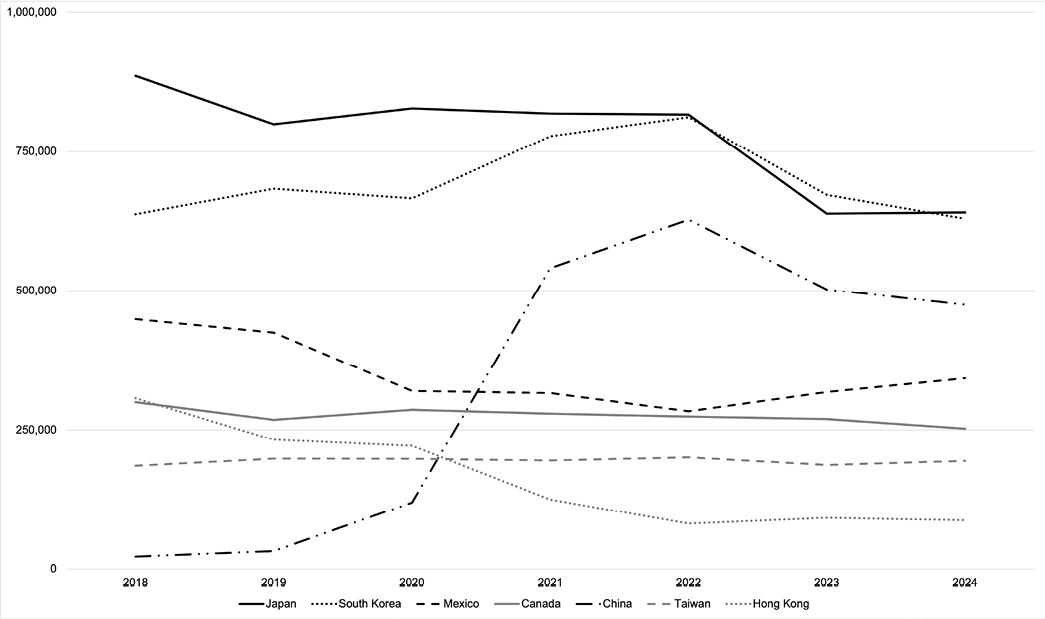
Figure 14. U.S. Beef and Veal Exports (carcass wt. 1,000 pounds). Information obtained from https://ers.usda.gov/data-products/livestock-and-meat-international-trade-data
U.S. beef imports of 608 million pounds in January 2025 smashed every previous monthly record. This was almost 20% higher than January 2024 which was the second highest month of imports on record (Figure 15). Imports from Brazil alone totaled 197 million pounds in January 2025, which was more than the total for entire years from Brazil previous to 2020.10
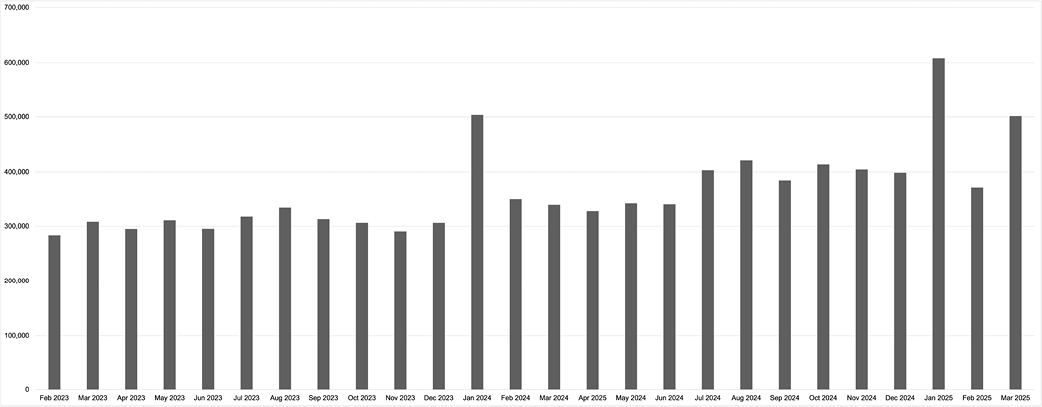
Figure 15. U.S. Beef and Veal Imports (carcass wt. 1,000 pounds). Information obtained from https://ers.usda.gov/data-products/livestock-and-meat-international-trade-data
Competition in international beef markets will affect U.S. producers if the trend of an expanding beef trade deficit continues. The outlook for the trade balance will likely not change until the cycle for U.S. beef swings and inventory numbers recover.
Through the first 5 months of 2025, COF numbers are slightly lower compared to most of the last several years and cattle prices are still expected to rise due to steady demand (Figure 16). Meanwhile, a strong dollar increased production from foreign competitors, and variations in consumer preferences have hampered international demand for U.S. beef and veal.
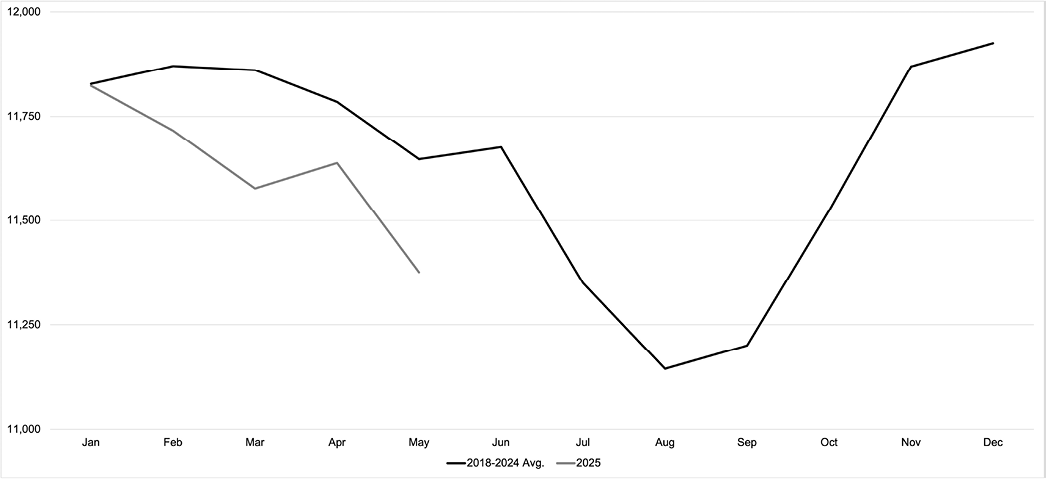
Figure 16. U.S. Cattle on Feed (1,000 head). Information obtained from https://quickstats.nass.usda.gov/
References
- Ates, A.M. (2025). Feed Outlook: February 2025. https://www.ers.usda.gov/publications/pub-details?pubid=110952
- Banegas, J. (2025, May). New World Screwworm and Livestock Border Closures: A Guide for New Mexico Livestock Producers [Guide Z-131]. New Mexico State University Cooperative Extension Service. https://pubs.nmsu.edu/_z/Z131/index.html
- FeedLot. (2025). Hay Prices Lowest in Four Years. https://www.feedlotmagazine.com/news/industry_news/hay-prices-lowest-in-four-years/article_a73f016c-cf59-11ef-93dd-77dabc0ea233.html#:~:text=National%20hay%20(alfalfa%20and%20other,per%20ton%20in%20November%202024
- Knight R., & Taylor, H. (2025, May 16). Livestock, Dairy, and Poultry Outlook: May 2025. https://www.ers.usda.gov/publications/pub-details?pubid=112615
- Knight, R., & Taylor, H. (2025, February 18). Livestock, Dairy, and Poultry Outlook: February 2025. https://www.ers.usda.gov/publications/pub-details?pubid=110744
- Knight, R., & Taylor, H. (2025, January 16). Livestock, Dairy, and Poultry Outlook: January 2025. https://www.ers.usda.gov/publications/pub-details?pubid=110971
- USDA Agricultural Marketing Service. Livestock Auction Dashboard. https://mymarketnews.ams.usda.gov/livestock_auction_dashboard
- USDA AMS Livestock, Poultry and Grain Market News; & New Mexico Department of Agriculture Market News. (2025). New Mexico Direct Hay Report. https://www.ams.usda.gov/mnreports/ams_2939.pdf
- USDA Economic Research Service. (2025). Cattle & Beef – Sector at a Glance. https://www.ers.usda.gov/topics/animal-products/cattle-beef/sector-at-a-glance
- USDA Economic Research Service. (2025). Livestock and Meat International Trade Data. https://www.ers.usda.gov/data-products/livestock-and-meat-international-trade-data
- USDA Economics, Statistics and Market Information System. (2024, January 31). Cattle [Report]. https://usda.library.cornell.edu/concern/publications/h702q636h
- USDA National Agricultural Statistics Service. (2025). Prices Received for Corn by Month – United States. https://www.nass.usda.gov/Charts_and_Maps/Agricultural_Prices/pricecn.php
- USDA National Agricultural Statistics Service. (2025). Prices Received: Cattle Prices Received by Month, United States. https://www.nass.usda.gov/Charts_and_Maps/Agricultural_Prices/priceca.php
- USDA Press Releases. (2025, May 11). Secretary Rollins Suspends Live Animal Imports Through Ports of Entry Along Southern Border, Effective Immediately [Press Release No. 0105.25]. https://www.usda.gov/about-usda/news/press-releases/2025/05/11/secretary-rollins-suspends-live-animal-imports-through-ports-entry-along-southern-border-effective

Jason Banegas is an NMSU Extension Economist specializing in statewide forecasting. He earned a master’s degree in economics from the University of Oklahoma and is in the NMSU Doctor of Economic Development program and the NMSU Water Science and Management Ph.D. program. His Extension work provides current research-based information to New Mexico livestock and crop producers to enhance profitability and farm and ranch sustainability. With input from producers, industry representatives, researchers, extension agents, and other stakeholders he transforms data into usable guides and tools.
To find more resources for your business, home, or family, visit the College of Agricultural, Consumer and Environmental Sciences on the World Wide Web at pubs.nmsu.edu.
Contents of publications may be freely reproduced, with an appropriate citation, for educational purposes. All other rights reserved. For permission to use publications for other purposes, contact pubs@nmsu.edu or the authors listed on the publication. New Mexico State University is an equal opportunity employer and educator. NMSU and the U.S. Department of Agriculture cooperating.
July 2025. Las Cruces, NM.