Guide Z-115
Anil Rupasingha and J. Michael Patrick
College of Agricultural, Consumer and Environmental Sciences, New Mexico State University
Authors: Community Economic Development Specialists, New Mexico Cooperative Extension Service, New Mexico State University, Las Cruces. (Print Friendly PDF)
Introduction
One of the most notable labor market trends in recent decades in the state of New Mexico has been the increase in non-farm proprietorships (Goetz & Rupasingha, 2007). The Bureau of Economic Analysis (BEA) data show that the number of non-farm proprietors increased by 334 percent between 1969 and 2005, from 43,918 to 190,788, while the number of farm proprietors increased 29 percent, from 13,310 to 17,157. While this trend varies across counties in New Mexico, more than 20 counties recorded an over 200 percent increase in non-farm proprietorships. During this same time period, the number of full- and part-time employment grew by 170 percent (Table 1). As a share of total full- and part-time employment, non-farm proprietorships increased from 11 to 18 percent (Figure 1). Further, as a share of total non-farm employment, non-farm proprietorships increased from 12 to 18 percent (Figure 2). Data also show that some counties have a significantly higher rate of non-farm proprietorships than others, and they may therefore have a more conducive environment for non-farm proprietor businesses (Figure 3). This significant growth in non-farm proprietorships likely reflects a combination of factors, including exits from agriculture, job losses, and downsizing of workforces in manufacturing and other large firms coupled with new opportunities created by information technology and a growing preference for natural amenities.
|
Table 1. Full- and Part-Time Employment and Non-Farm and Farm Proprietor Change in New Mexico Counties, 1969–20051 |
|||||||||
|
|
Total full-time and |
Non-farm proprietors |
Farm proprietors |
||||||
|
Area Name |
1969* |
2005 |
% change |
1969 |
2005 |
% change |
1969 |
2005 |
% change |
|
New Mexico |
394,799 |
1,064,351 |
170 |
43,918 |
190,788 |
334 |
13,310 |
17,157 |
29 |
|
Bernalillo |
134,349 |
419,581 |
212 |
13,994 |
68,326 |
388 |
193 |
564 |
192 |
|
Catron |
1,016 |
1,606 |
58 |
156 |
659 |
322 |
281 |
253 |
-10 |
|
Chaves |
17,107 |
29,137 |
70 |
2,704 |
5,745 |
112 |
758 |
677 |
-11 |
|
Cibola |
6,185 |
10,527 |
70 |
1,011 |
1,555 |
54 |
176 |
208 |
18 |
|
Colfax |
5,239 |
8,450 |
61 |
666 |
2,133 |
220 |
398 |
382 |
-4 |
|
Curry |
17,590 |
24,763 |
41 |
1,996 |
3,551 |
78 |
1,110 |
748 |
-33 |
|
De Baca |
1,076 |
1,116 |
4 |
235 |
239 |
2 |
280 |
215 |
-23 |
|
Doña Ana |
26,608 |
87,493 |
229 |
2,468 |
13,481 |
446 |
841 |
1,547 |
84 |
|
Eddy |
16,286 |
27,098 |
66 |
2,124 |
4,740 |
123 |
656 |
577 |
-12 |
|
Grant |
9,095 |
14,302 |
57 |
820 |
3,111 |
279 |
275 |
378 |
37 |
|
Guadalupe |
1,785 |
2,143 |
20 |
287 |
407 |
42 |
220 |
285 |
30 |
|
Harding |
732 |
777 |
6 |
51 |
323 |
533 |
264 |
205 |
-22 |
|
Hidalgo |
1,909 |
2,474 |
30 |
237 |
479 |
102 |
219 |
180 |
-18 |
|
Lea |
21,722 |
33,000 |
52 |
2,612 |
5,164 |
98 |
747 |
683 |
-9 |
|
Lincoln |
3,183 |
11,560 |
263 |
718 |
3,663 |
410 |
368 |
395 |
7 |
|
Los Alamos |
8,750 |
21,888 |
150 |
362 |
2,284 |
531 |
0 |
0 |
0 |
|
Luna |
4,348 |
10,871 |
150 |
594 |
1,747 |
194 |
395 |
239 |
-39 |
|
McKinley |
13,617 |
29,325 |
115 |
1,100 |
5,482 |
398 |
94 |
253 |
169 |
|
Mora |
1,033 |
2,051 |
99 |
140 |
544 |
289 |
157 |
490 |
212 |
|
Otero |
19,648 |
29,377 |
50 |
1,153 |
5,291 |
359 |
291 |
525 |
80 |
|
Quay |
4,827 |
4,838 |
0 |
622 |
729 |
17 |
959 |
730 |
-24 |
|
Rio Arriba |
6,196 |
18,748 |
203 |
717 |
4,197 |
485 |
318 |
1,153 |
263 |
|
Roosevelt |
6,586 |
9,448 |
43 |
1,102 |
1,450 |
32 |
1,497 |
927 |
-38 |
|
Sandoval |
2,968 |
36,739 |
1,138 |
480 |
7,105 |
1,380 |
151 |
402 |
166 |
|
San Juan |
17,330 |
62,584 |
261 |
1,953 |
9,567 |
390 |
343 |
769 |
124 |
|
San Miguel |
6,092 |
13,437 |
121 |
697 |
2,925 |
320 |
274 |
801 |
192 |
|
Santa Fe |
21,803 |
88,783 |
307 |
2,557 |
19,905 |
678 |
104 |
407 |
291 |
|
Sierra |
2,174 |
4,799 |
121 |
452 |
1,412 |
212 |
160 |
235 |
47 |
|
Socorro |
3,483 |
8,455 |
143 |
454 |
1,591 |
250 |
292 |
483 |
65 |
|
Taos |
4,823 |
18,256 |
279 |
630 |
5,869 |
832 |
137 |
522 |
281 |
|
Torrance |
2,005 |
5,791 |
189 |
319 |
1,375 |
331 |
428 |
576 |
35 |
|
Union |
2,433 |
2,746 |
13 |
398 |
551 |
38 |
663 |
560 |
-16 |
|
Valencia |
8,986 |
22,188 |
147 |
1,120 |
5,188 |
363 |
437 |
788 |
80 |
|
1 Proprietor numbers are calculated for each county by the BEA based on federal tax Form 1040 (Schedule C) for sole proprietorships and Form 1065 for partnerships data. These estimates include individuals who may be otherwise employed but have additional income from self-employment, and they may include multiple filings by the same individual. While proprietors cannot be equated with entrepreneurs per se, they arguably have more in common with this group than with wage and salary workers, or workers who choose to remain unemployed after a lay-off. Proprietors create new jobs for themselves, and often for others. * 1982 Data for Cibola County, Source: BEA Regional Economic Information System |
|||||||||
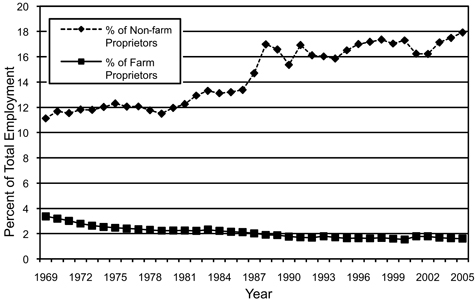
Figure 1. Change of farm and non-farm proprietors in New Mexico, 1969–2005.
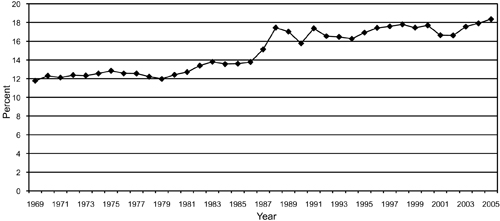
Figure 2. Non-farm proprietorships as a percent of total non-farm employment, 1969–2005.
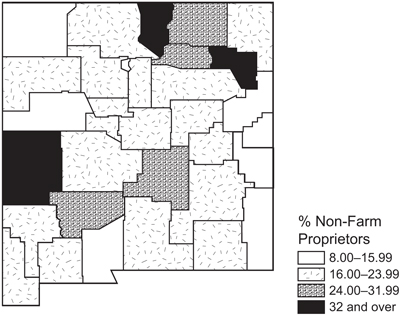
Figure 3. Non-farm proprietors as a percent of total, by county.
However, data also show that the returns or earnings per non-farm proprietor in New Mexico lag behind the returns to wage-and-salary employment (Figure 4). In 1969, the average non-farm proprietor earned $5,940, whereas the average wage-and-salary job paid only $4,977 (Table 2). By 2005, the average non-farm proprietor earned $22,321, whereas the average payroll worker earned $26,453, a more than $4,000 difference. While this trend varies across counties, only nine counties recorded higher earnings for non-farm proprietorship than payroll employment in 2005. Non-farm proprietorship earnings as a percent of total personal income declined from 1969 until around 2000, but have shown an upward trend since then (Figure 5). Non-farm proprietors as a group received a share of total personal income in 2005 (8%) that was considerably smaller than their share of the workforce (18%) would suggest. However, if the alternative to creating non-farm proprietorships is unemployment, then it is important for local and state decision makers to know whether and how state- and county-level policies and socioeconomic characteristics foster or impede the net formation of non-farm proprietorships. This is especially true for rural communities that have lost their manufacturing base, since they will unlikely be able to recreate this base. Thus, for many rural counties, home-grown entrepreneurship or self-employment is the only viable source of economic growth and development available.
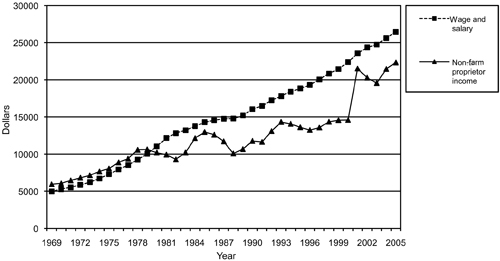
Figure 4. Average non-farm proprietor income and average wage and salary earnings, 1969–2005.
Table 2. Per Capita Earnings for Full- and Part-Time Employment and Non-Farm and Farm Proprietor in New Mexico Counties, 1969 and 2005.
| 1969 | 2005 | |||||
| Area Name | payroll | non-farm | farm | payroll | non-farm | farm |
| New Mexico | 4,977 | 5,940 | 5,450 | 26,453 | 22,321 | 22,214 |
| Bernalillo | 5,567 | 5,250 | 8,637 | 29,951 | 21,430 | -10,337 |
| Catron | 2,891 | 4,577 | 2,075 | 11,379 | 6,759 | -13,024 |
| Chaves | 3,892 | 5,581 | 9,145 | 20,551 | 39,071 | 124,935 |
| Cibola | N/A | N/A | N/A | 21,612 | 13,891 | -6,332 |
| Colfax | 3,788 | 8,200 | 1,113 | 17,726 | 16,508 | -16,613 |
| Curry | 4,333 | 4,275 | 9,990 | 24,259 | 15,032 | 97,896 |
| De Baca | 2,089 | 4,043 | 3,982 | 13,100 | 20,623 | -1,530 |
| Doña Ana | 5,186 | 6,293 | 9,713 | 23,159 | 17,993 | 60,993 |
| Eddy | 4,591 | 8,047 | 7,407 | 27,790 | 45,890 | 20,582 |
| Grant | 5,708 | 8,465 | 3,269 | 19,887 | 10,582 | -11,923 |
| Guadalupe | 2,889 | 5,362 | 6,605 | 14,984 | 15,133 | -19,568 |
| Harding | 2,482 | 6,098 | 2,004 | 7,708 | 9,003 | -11,463 |
| Hidalgo | 3,656 | 3,751 | 4,968 | 18,407 | 9,296 | 1,250 |
| Lea | 5,080 | 7,725 | 5,722 | 26,419 | 28,997 | 33,876 |
| Lincoln | 2,956 | 5,326 | 459 | 15,825 | 12,711 | -23,441 |
| Los Alamos | 8,218 | 8,931 | N/A | 57,237 | 13,197 | N/A |
| Luna | 3,606 | 4,879 | 7,357 | 20,340 | 17,860 | 27,280 |
| McKinley | 5,523 | 6,637 | 5,649 | 22,693 | 4,918 | -17,652 |
| Mora | 3,458 | 4,457 | -1,465 | 12,027 | 9,676 | -11,851 |
| Otero | 5,760 | 7,053 | 1,825 | 23,114 | 11,259 | 4,130 |
| Quay | 2,870 | 4,767 | 660 | 17,479 | 13,110 | 5,445 |
| Rio Arriba | 4,186 | 5,929 | 3,362 | 17,195 | 13,340 | -4,843 |
| Roosevelt | 2,651 | 4,005 | 6,768 | 17,860 | 13,871 | 80,529 |
| Sandoval | 3,762 | 7,371 | 2,901 | 28,849 | 14,943 | -11,415 |
| San Juan | 5,353 | 6,442 | 4,994 | 27,744 | 30,630 | 46,524 |
| San Miguel | 3,763 | 5,393 | 5,507 | 17,623 | 11,392 | -13,587 |
| Santa Fe | 4,403 | 7,329 | 10,692 | 25,232 | 40,387 | -17,265 |
| Sierra | 3,214 | 4,175 | 2,500 | 15,340 | 11,620 | 7,881 |
| Socorro | 3,931 | 5,037 | 8,599 | 20,465 | 10,209 | 20,950 |
| Taos | 4,081 | 6,643 | 3,095 | 16,180 | 26,741 | -2,293 |
| Torrance | 2,707 | 3,263 | 2,346 | 16,687 | 11,769 | 15,281 |
| Union | 2,268 | 4,188 | 4,913 | 13,585 | 12,740 | 53,738 |
| Valencia | 4,404 | 6,126 | 3,050 | 18,433 | 11,440 | -2,376 |
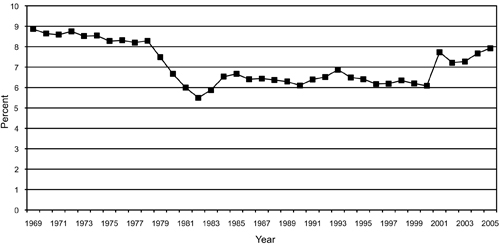
Figure 5. Non-farm proprietor employment income as a percentage of total personal income, 1969–2005.
Policy Significance
The emergence of non-farm proprietors or self-employed workers in New Mexico counties has two important implications that have not been recognized. First, without these workers, the decline in rural population, which has been widely documented, would likely have been even greater. Second, these workers could become a crucial source of new stakeholders for land grant universities like New Mexico State University (NMSU) that were established primarily to serve the rural population.
Rural areas have traditionally been served by land grant universities and colleges of agriculture. When these universities were established in the late 19th century, the rural population primarily earned its income from farming, and maximizing returns to taxpayer investments in rural areas under the Hatch (Land Grant) Act of 1887 meant that universities needed to develop research and outreach capacity within agriculture. Today, many such institutions are faced with stagnant and (in real terms) declining core federal funding, and leaders of many land grant colleges and universities are beginning to recognize that they must expand their rural stakeholder base beyond production agriculture if they wish to maintain program funds and continue to serve the public interest generally (as opposed to serving only a declining farm population). Some land grant systems, such as NMSU, are expanding their role beyond their original, more narrowly-conceived missions by adopting a universitywide outreach philosophy and seeking community partners to address the needs of this new and growing set of rural stakeholders.
The economic forces now affecting rural areas can be traced to the consequences of globalization, including outsourcing that has altered the spatial operation of the production cycle and labor-saving technological changes in natural resource-based industries. In agriculture, much of the labor-saving technological change originated from within the land grant universities themselves, producing not only a stable, low-cost food supply but also the widespread adjustment problems associated with farm labor displacement.
Because the fundamental causes of rural economic decline are not likely to be reversed, the types of jobs that have been lost from rural areas will, for the most part, not return. Consequently, rural areas must seek new economic bases and sources of employment if they wish to stem and perhaps reverse the out-migration of workers and their families. In particular, observers agree that there will be only few new branch plant locations, and that not all areas can draw on their natural amenities to recruit business owners who, unlike retirees, bring with them new jobs, or can attract vacationers and a second-home industry. Others may become regional retail hubs by attracting big-box retailers such as Walmart, which may entail other problems, or regional medical centers.
This brief analysis of non-farm proprietor data indicates that the economic well-being of many farm and non-farm families continues to depend on the strength of and employment opportunities offered by the local economy. It also suggests that an economic development approach that focuses on local, individual entrepreneurs may be a viable option. While we may not find very many new economy entrepreneurs among these non-farm proprietors (Goetz, 2003), there may be a host of other entrepreneurship areas that have potential for growth in rural areas. The Center for Rural Affairs (2003) in Nebraska lists the following examples of rural businesses that have been helped by its Rural Enterprise Assistance Program: “wood craft businesses, bird house makers, a pottery maker, picture framers, a Christmas tree ornament maker, a meeting planner, caterers, day care centers, a fitness center, tanning salons, carpenters, auto repair businesses, makers of wooden barrels and casks for movie sets and many, many others” (p. 4).
Concluding Comment
Growth in the U.S. agricultural sector has been primarily driven by innovation, including high-yielding varieties, chemicals like fertilizers and pesticides, and machinery. Increases in productivity have also been achieved through improved management practices, efficient use of inputs, and marketing of products. The land grant university system has played a major role in this overall increase in agricultural productivity and improved quality of life in rural areas.
However, the role of production agriculture as an engine of rural growth and development has been diminishing over time. One goal of NMSU’s 21st century land grant mission could be to raise the productivity and incomes of non-farm proprietors. In former NMSU president Mike Martin’s (2007) words, “land-grants must embrace the commitment to fully engage beyond their campuses. This means taking research-based solutions to pressing problems in the service of all citizens. It also means engaging citizens in the process of setting long-term priorities for the ‘people’s’ universities” (p. 7). Understanding the origins of entrepreneurial or self-employment behavior and designing educational programs needed to nurture and expand this behavior are important to the future economic growth of New Mexico. Potential areas that NMSU and the Cooperative Extension Service (CES) can become involved in include helping to create new businesses, providing support to existing businesses, innovation (in collaboration with the College of Engineering), feasibility studies and cost-benefit analyses, marketing plans, profitable use of information technology, access to capital, and training of economic development professionals. A small business-centered research program would provide the basis for these and other extension and outreach activities.
Through expanded partnerships with federal and state business and economic development programs, such as the U.S. Small Business Administration’s Small Business Development Centers, the U.S. Department of Agriculture’s Office of Rural Development, the New Mexico Economic Development Department, the NMSU New Mexico Works offices, the New Mexico Rural Development Response Council, and non-profit economic development organizations such as the New Mexico Rural Development Alliance, the NMSU CES can play an important and significant role in helping the growing number of rural-based non-farm proprietors (entrepreneurs) become established and prosper, thereby contributing more jobs and income to New Mexico rural communities.
References
Goetz, S. J. (2003, February 20). Critical development issues in rural economies (RDP-16). Paper presented at the Agricultural Outlook Forum 2003, Arlington, VA. Available from http://www.nercrd.psu.edu/publications/rdppapers/rdp16BW.pdf
Goetz, S. J., & Rupasingha, A. (2007). Determinants of growth in county-level self-employment densities, 1990–2000. Small Business Economics, Online First (DOI 10.1007/s11187-007-9079-5).
Martin, M. V. (2001, November 11). Induced Innovation: The Story of Land-Grant Universities.
Rural economic development depends on small entrepreneurship. (2003, January) Center for Rural Affairs, 4–5.
To find more resources for your business, home, or family, visit the College of Agricultural, Consumer and Environmental Sciences on the World Wide Web at pubs.nmsu.edu.
Contents of publications may be freely reproduced for educational purposes. All other rights reserved. For permission to use publications for other purposes, contact pubs@nmsu.edu or the authors listed on the publication.
New Mexico State University is an equal opportunity/affirmative action employer and educator. NMSU and the U.S. Department of Agriculture cooperating.
Printed and electronically distributed October 2008, Las Cruces, NM.