Guide X-002
Sawssan Boufous, Clinton Owusu, Alexander Wilson, and Brian Hurd.
College of Agricultural, Consumer and Environmental Sciences, New Mexico State University
Authors: Respectively, Extension Specialist and Assistant Professor, Department of Extension Economics; Graduate Student, Department of Agricultural and Extension Education; Statewide Agent Value Added, Department of Extension Economics; Professor, Department of Agricultural Economics and Agricultural Business. (Print-friendly PDF).
Executive Summary
This report presents the findings from a 2024 survey of 1200 New Mexico residents regarding their perceptions of and adaptation strategies to climate change. It provides information regarding their preferred information outlets for learning about climate change, their opinions on who is responsible for addressing it, and the motivations behind their adaptation to mitigation strategies.
Major Findings
More than half of the respondents are familiar with the concepts: climate change, clean energy, and ecosystem.
- 55% of the respondents affirm being concerned about climate change.
- 36% of the respondents think that climate change is caused by human activity and natural changes.
- 25% of the sample think that non-governmental organizations and environmental groups make a significant effort to address climate change.
- 31% of the respondents affirm that their daily activities were affected during the extreme weather conditions of summer 2023.
- 55% of the respondents linked the increase in utility bills and food prices to extreme weather conditions.
- About 22% of the respondents think that long-term changes in the weather need to be addressed by the government, companies, and individuals.
- About 43% of respondents reduced their energy and water consumption to mitigate summer 2023 weather effects.
- 55% affirm to opt for mitigating strategies because they would like to live in a healthier and cleaner environment.
- 45% of the respondents believe that climate change can be mitigated if everybody changes their behavior.
Recommendations
- Enhance Public Education Campaigns: Since over half of respondents are already familiar with key climate concepts, targeted educational campaigns through preferred information outlets can deepen understanding and motivate broader action.
- Promote Collective Responsibility: With only 22% believing that governments, companies, and individuals must act together, awareness efforts should emphasize the shared responsibility of all sectors in addressing climate change.
- Support Behavioral Change Programs: Given that 45% believe behavior change can mitigate climate effects, the state should invest in community-based programs that incentivize sustainable practices, such as reduced energy and water consumption.
- Leverage Health and Economic Motivations: Since over half are motivated by the desire for a cleaner environment and are linking weather extremes to rising costs, climate strategies should highlight health and financial benefits to increase public engagement.
- Strengthening NGO and Environmental Group Visibility: Partnerships should be strengthened between the government and environmental organizations to showcase and expand their roles in climate solutions.
Introduction
New Mexico’s temperatures have risen by more than 2°F from 1970 to 20201 and are projected to rise between 5° and 7°F over the next 50 years.2-6
The state’s climate is becoming warmer and drier, driven by regional and global warming trends, which are impacting seasons and precipitation patterns (such as earlier springs, warmer summers, and less predictable winters, as well as more intense droughts and rainfall, and less snowfall).7 These variations lead to various issues, including water shortages, extreme temperatures, and wildfires, which have a direct economic impact on New Mexico’s agriculture and ranching sectors, resulting in an estimated annual loss of $73 million.8
The literature has shown that individuals’ perceptions of climate change influence their support for mitigation and adaptation policies.9 In their study focusing on water issues, Distler & Scruggs (2020) found that even if a large portion of Albuquerque residents acknowledge anthropogenic climate change, knowledge gaps persist regarding the science behind local impacts and the efficacy of adaptation measures.10 Moreover, the study emphasizes that varying levels of trust in state agencies and community organizations shape willingness to adopt strategies such as water reuse, wildfire preparedness, or heat-resilient building practices.
Therefore, understanding how climate change is perceived and the strategies adopted to mitigate its effects is crucial for tailoring outreach to diverse socio-cultural groups, including Indigenous and rural communities, who often bear the greatest burdens of climate risks.11 This report provides information on how New Mexicans perceive and experience climate change, as well as their opinions on various mitigation strategies.
By supporting this survey, the National Center on Carbon Management and Soil Health (NCCMSH) aims to consolidate its efforts to provide a deeper understanding of the impacts of climate change on lives and solutions to mitigate its effects.
Materials and Methods
This report analyzes responses of a representative sample of New Mexico’s population to unveil how New Mexicans perceive and adapt to climate change. Questionnaires were distributed online to 1,200 New Mexico residents. Questions asked pertained to individual perceptions, familiarity, opinions, and strategies for adapting to climate change. We use descriptive statistics to summarize the data and describe the relationships between the variables in the sample.
Survey Methods
The survey questionnaire was developed based on existing literature on climate change perceptions, knowledge, and adaptation behaviors. Questions were carefully structured to ensure clarity, relevance, and alignment with the study objectives. Before full deployment, the survey underwent pretesting with a sample of 40 residents from New Mexico, who are representative of the target population, to identify potential issues with wording, structure, or length. Feedback from the pretest was used to refine the survey, thereby improving its reliability and validity. Additionally, the final version was reviewed by experts in climate change adaptation and survey methodology to ensure the accuracy of content and the soundness of methodology.
Survey Result
How Familiar are New Mexicans with Climate Change Concepts and Terms?
Before assessing our respondents’ perceptions and adaptation strategies to climate change, they were asked about their familiarity with ten climate change concepts and terms, and then about their beliefs in the occurrence of climate change.
The objective of this question was to directly expose the respondents to a range of concepts closely related to climate change, in addition to the main concept itself, in order to evaluate their familiarity with the general topic and to provide insight into the direction of the subsequent survey questions. Given the vast concepts related to climate change, we constructed the choice responses to this question with the consensus of NMSU researchers and Extension specialists who agreed on ten main concepts. As a preliminary analysis, we focused on five concepts in this survey as listed in the appendix (A).
Figure 1 illustrates that respondents had varying levels of familiarity with climate-related topics. Approximately half of the respondents reported familiarity with climate change (55.1%), clean energy (52.2%), and ecosystems (50.9%). In contrast, familiarity with biodiversity and carbon footprints was considerably lower, with slightly more than 30% of respondents familiar with carbon footprints (around 36%). Biodiversity was the least familiar concept among all topics (29%).
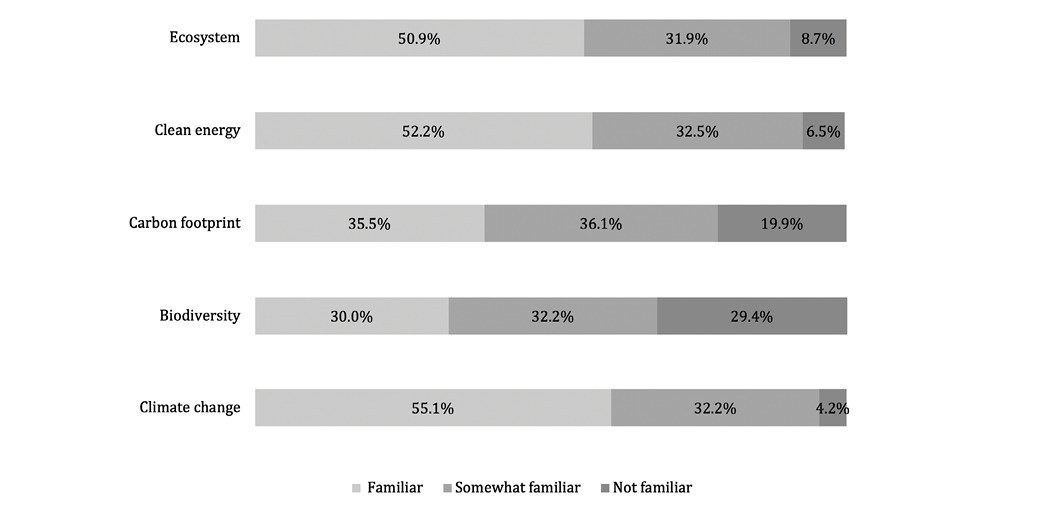
Figure 1. Familiarity with climate terms and concepts.
Concern about climate change was higher among the sample than the national average of 65%,12 with 83% of respondents reporting some level of concern (Figure 2). Of these respondents, 55% were highly concerned, 28% were partially concerned, and only 9% were unconcerned.
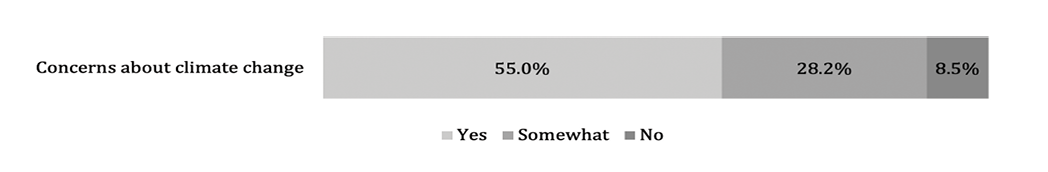
Figure 2. Concerns about climate change.
The survey revealed varied opinions on the causes of climate change (Figure 3). Most participants believe that human activity is a factor, with 36% attributing climate change primarily to human actions, such as burning fossil fuels, while another 35% believe it is caused by a combination of human activity and natural changes. The remaining participants were divided, with 14% citing natural atmospheric changes as the main cause, 5% finding insufficient evidence, and 2% not believing climate change is happening.
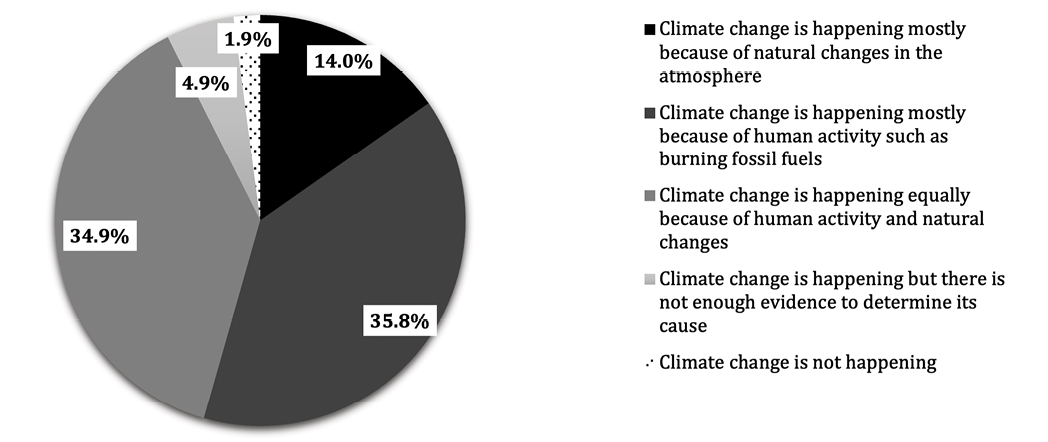
Figure 3. Opinions about climate change.
When respondents were asked whether enough was being done to address climate change (Figure 4), 47% of respondents believed that, to some extent, Non-Governmental Organizations and environmental groups have done enough to address climate change, followed by 44% for individuals and families, and 39% for government authorities. In contrast, 43% of respondents felt that corporations and industries have not done enough to address climate change, indicating that respondents have little trust in their efforts to address climate change. The respondents believe that no single group is putting in a full effort to address climate change, with the highest percentage of “yes” responses being 25% and the lowest percentage being 13%.
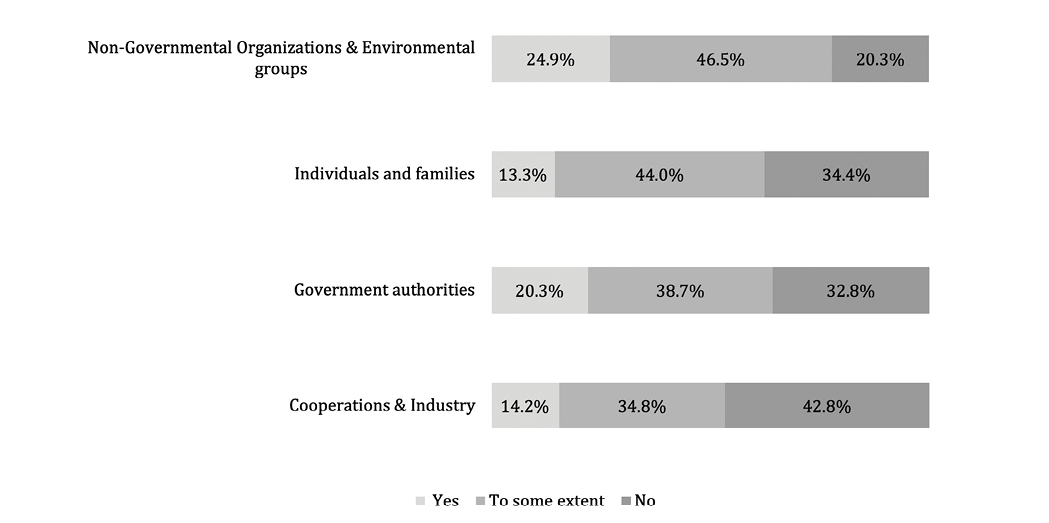
Figure 4. Sufficient efforts are being made to address climate change.
In the summer of 2023, New Mexico experienced record-breaking temperatures that surpassed the statewide average by 2.5°F, accompanied by a worsening drought, a weaker monsoon season, and reduced precipitation.13 Therefore, we considered summer 2023 as a reference to extreme weather to ask respondents how this event affected their daily activities at that time. Approximately 60% of respondents reported that their daily activities were altered by this extreme weather, while 29% of respondents didn’t notice any impact on their daily activities (Figure 5). To provide further context for this potential impact, respondents were presented with ten specific effects of extreme weather and asked if they had experienced any of them. Results (Figure 6) show that a large portion of respondents noticed an increase in utility bills and food prices (approximately 77% each), as well as higher cancellation rates for events and activities and housing costs (approximately 61% each).
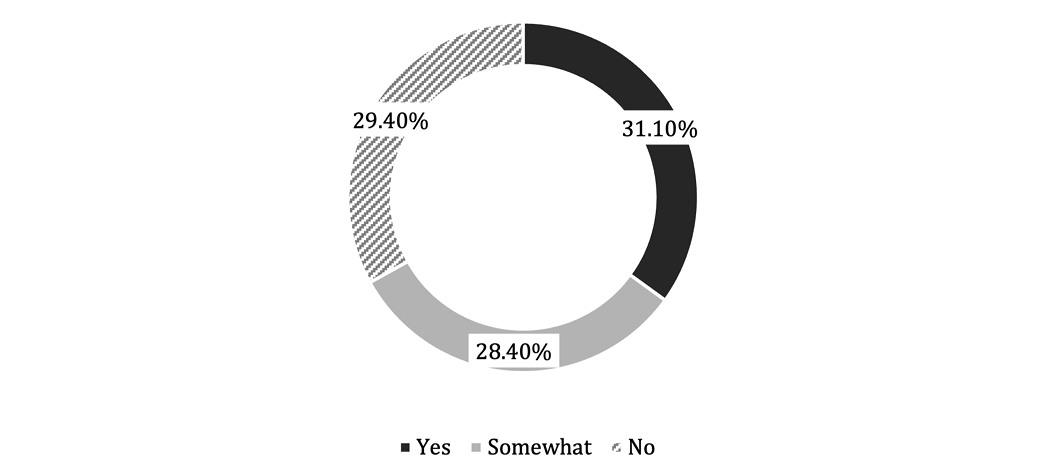
Figure 5. Extreme weather conditions disrupting normal activities.
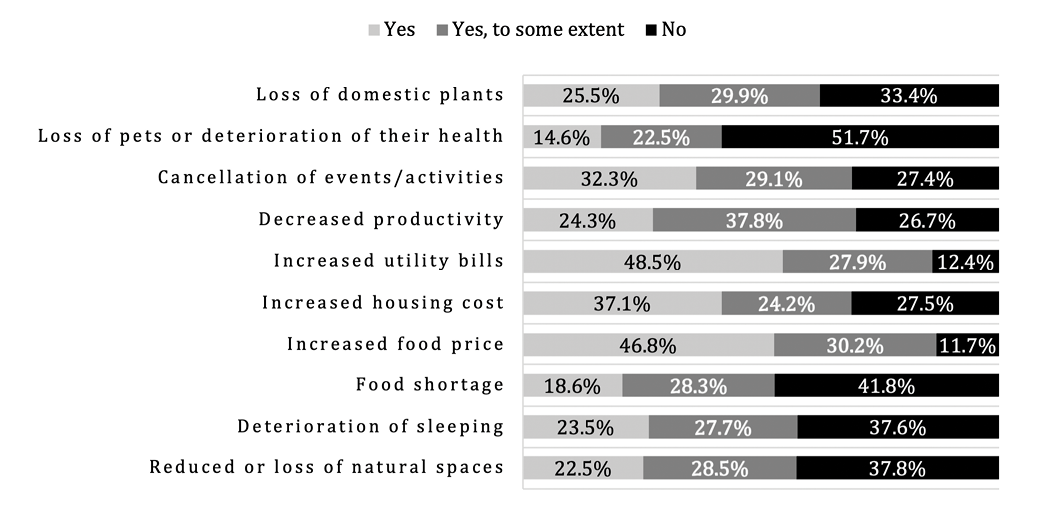
Figure 6. Impact of extreme weather conditions on daily life.
Moreover, some respondents affirm that, to some extent, extreme weather conditions have reduced natural spaces, affected their sleep, and contributed to the loss of domestic plants (respectively 52%, 56%, and 52%).
Respondents were also asked who they thought was responsible for addressing climate change; responses weren’t unanimous and varied (Figure 7). Roughly a third of respondents believe that climate change needs to be addressed by governments, while about same proportion of respondents think it is the duty of companies and industries (24% and 22% respectively), while fewer respondents think that it is too late to mitigate the effects while others reported not being concerned about climate change (3% and 6%). However, 96% of respondents who chose “other” reported that the responsibility for addressing climate change should concern everybody, with no differentiation
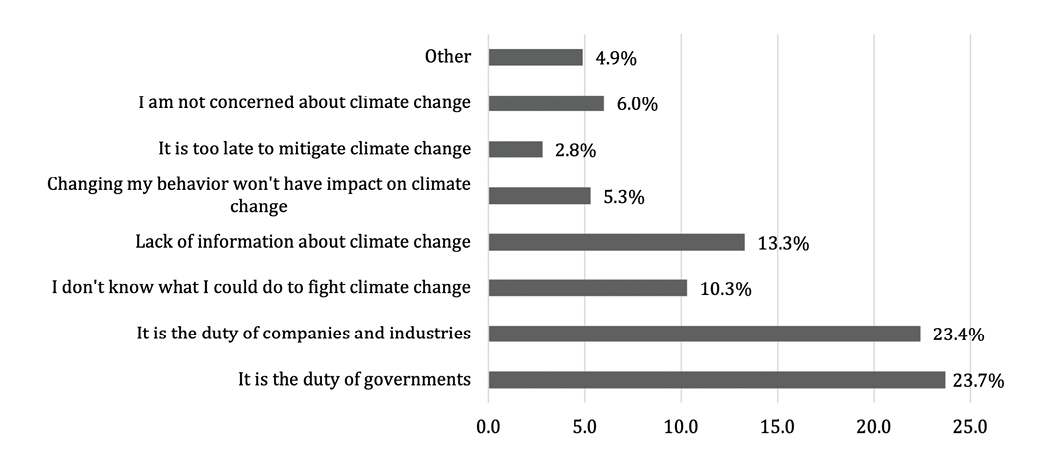
Figure 7. Opinions about addressing long-run weather changes.
Climate Change Adaptation
Climate change refers to the process of adjusting to actual or expected changes in climate and their effects, with the aim of reducing harmful impacts on both human and natural systems. According to the IPCC, adaptation in human systems aims to mitigate harm from climate impacts, such as extreme weather, sea-level rise, and food and water insecurity. In natural systems, it involves adjustments to climate conditions, sometimes facilitated by human intervention.14
Respondents were asked to report what source of information was the most helpful for them to learn more about mitigating strategies. Research has shown that social networks and collective action,15 as well as institutions and governance,16 are effective sources to shape adaptation strategies. Our results show almost similar answers for each of the seven response choices given (Figure 8).
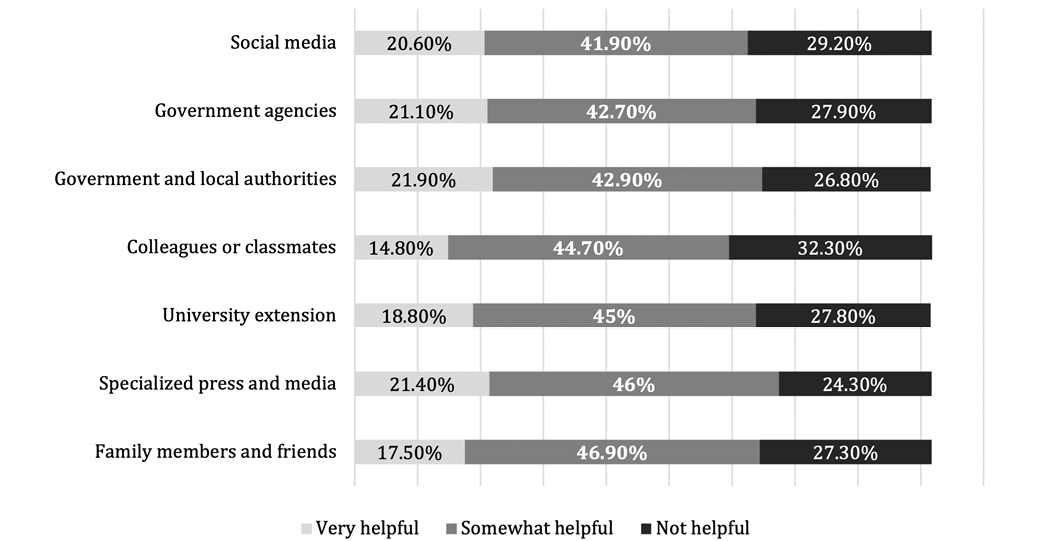
Figure 8. Sources to learn about suitable technologies and activities to mitigate climate impact.
Government and local authorities, specialized media and press, and government agencies are perceived as the most helpful sources for learning about mitigation strategies for climate change (22%, 21%, and 21%, respectively). University Extension and family members and friends are considered similar in their usefulness in information (19% and 18%), while colleagues seem to be the least helpful.
To explore their adaptation strategies, respondents were asked to identify the actions they considered as a response to the extreme weather in summer 2023. Results (Figure 9) show that decreasing energy and water consumption appear to be the most popular options (45% and 40%), closely followed by reducing disposable items and increasing the consumption of seasonal and local products (37% and 30%). Actions like recycling water, alternative transportation, and home insulation were less popular (27%, 21%, 19%). And 15% claimed not to take any action. These actions were also mostly motivated by the hope of living in a cleaner and healthier environment (55%), the belief that individual action is impactful (45%), and concerns about the future generations (45%) (Figure 10).
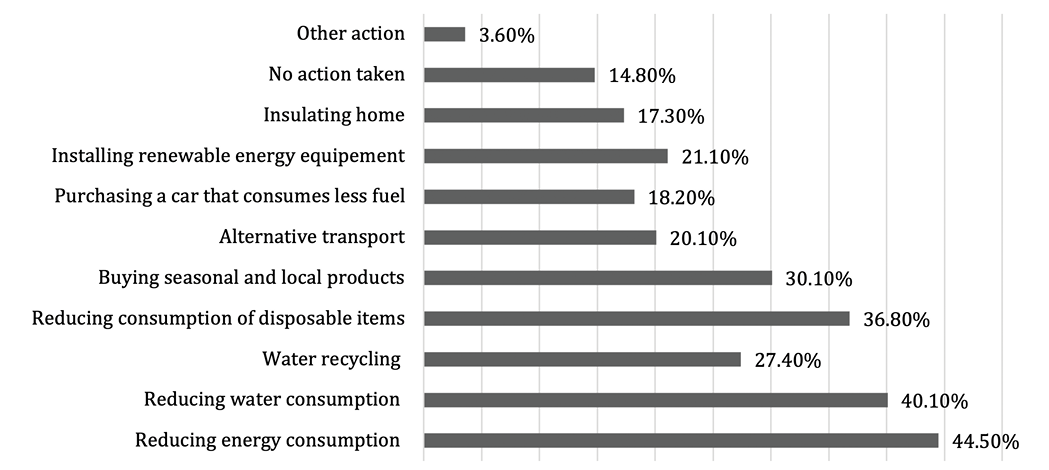
Figure 9. Actions considered during these recent extreme weather conditions.
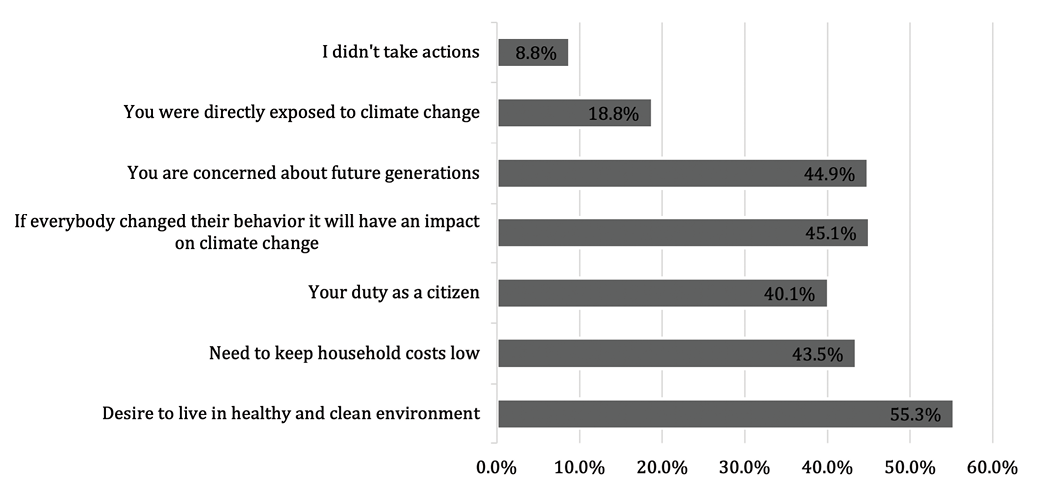
Figure 10. Reasons why people take action aimed at fighting climate change
Respondents’ Demographics
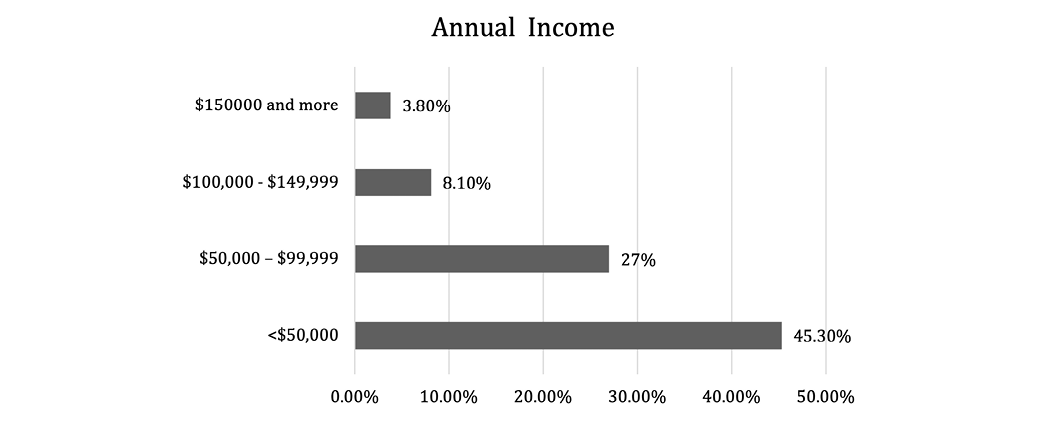
On average, our typical respondent is a married woman in her late 40s, who has some college, earns less than $50,000 annually, and works in the Information Technology Industry. This result aligns with the most recent New Mexico demographics, where women slightly outnumber men (50.2% to 49.8%), and 87.7% of individuals 25 or older have completed some college but have not earned a credential.17
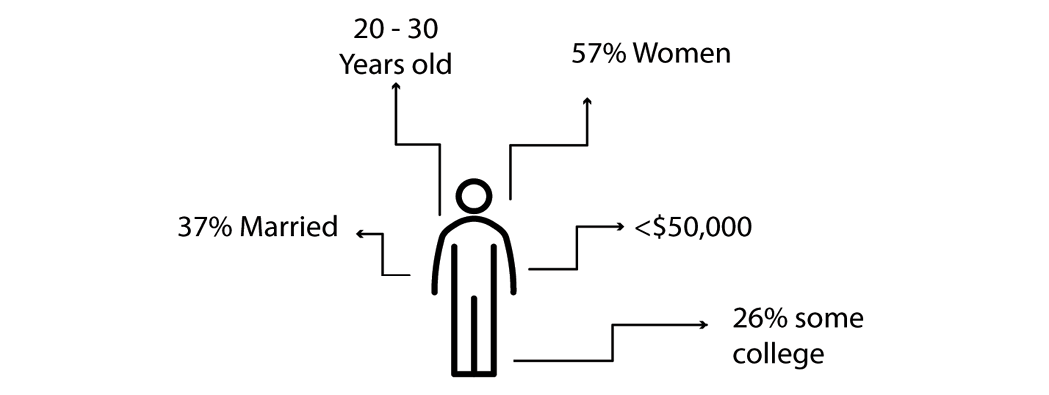
Figure 11. Average survey respondent’s demographics.
Survey Analysis
Perceptions by gender and education level
Results of cross-tabulations (Table 1 and Table 2) show that respondents with education levels above high school and female respondents are the most familiar with climate change concepts and terms. Additionally, these individuals are the ones who express more concerns about climate change and claim that their daily activities were altered by the extreme weather of the summer of 2023.
|
Table 1. Familiarity with Climate Change Concepts and Adaptation by Gender |
||||
|---|---|---|---|---|
|
Female |
Male |
High school or less |
Undergraduate or more |
|
|
Familiarity with concepts |
||||
|
Climate Change |
64.61% |
30.76% |
26.26% |
69.1% |
|
Biodiversity |
44.46% |
25.59% |
1.5% |
52.7% |
|
Carbon |
51.78% |
27.39% |
19.25% |
59.62% |
|
Clean |
62.58% |
30.47% |
25.47% |
67.52% |
|
Ecosystem |
61.14% |
29.89% |
24.1% |
66.93% |
|
Concerned about |
63.65% |
27.29% |
26.36% |
64.66% |
|
Climate change |
46.58% |
20.54% |
20.43% |
46.79% |
Referring to the extreme weather events of summer 2023, our respondents were presented with a set of ten adaptation actions that they might or might not have taken to mitigate the effects of these events, which were combined into four categories to facilitate interpretation.
|
Table 2. Adaptation Strategies by Gender and Education Level |
||||
|
Female |
Male |
High school or less |
Undergraduate or more |
|
|
Energy |
45.79% |
21.87% |
19.54% |
48.23% |
|
Water |
38.19% |
19.40% |
15.28% |
42.41% |
|
Recycle |
36.76% |
17.66% |
15.28% |
39.2% |
|
Other |
13.42% |
5.5% |
6% |
12.85% |
Women respondents and respondents with undergraduate education or above seem to be the most reactive to extreme weather conditions. Followed by actions related to water consumption reduction and recycling, actions related to energy consumption, such as reducing consumption, choosing alternative transport, purchasing a car that consumes less fuel, installing renewable energy equipment, and insulating the home, were the most selected by these respondents. Other actions, such as reducing the consumption of disposable items and buying seasonal and local products, were the least adopted among all respondent categories.
Conclusions
In conclusion, the survey reveals a growing awareness and concern among respondents regarding climate change and its associated impacts. Over half are familiar with related concepts and affirm concern about the issue, with many acknowledging the influence of both human and natural factors. While a minority credit NGOs and environmental groups for meaningful action, a significant portion experienced direct effects during the summer of 2023’s extreme weather. Many respondents associated these conditions with rising utility and food costs, and a notable number adopted personal mitigation strategies. Overall, the findings highlight a collective willingness to act, driven largely by the desire for a cleaner environment and the belief that behavioral changes can make a meaningful difference.
References
- Dunbar, N.W., Gutzler, D.S., Pearthree, K.S., Phillips, F.M., & Bauer, P.W. Climate Change in New Mexico over the Next 50 Years: Impacts on Water Resources [Bulletin 164]. New Mexico Bureau of Geology and Mineral Resources. https://geoinfo.nmt.edu/publications/monographs/bulletins/164/
- U.S. Global Change Resaerch Program (USGCRP). (2014). Climate Change Impacts in the United States. www.nca2014.globalchange.gov
- USGCRP. (2018). Fourth National Climate Assessment: Volume II, Impacts, Risks, and Adaptations in the United States. www.nca2018.globalchange.gov
- Intergovernmental Panel on Climate Change (IPCC). (2014). Climate Change 2014: Synthesis Report. Contribution of Working Groups I, II and III to the Fifth Assessment Report of the Intergovernmental Panel on Climate Change [Core Writing Team, R.K. Pachauri and L.A. Meyer (eds.)].
- IPCC. (2021). Climate Change 2021 – The Physical Science Basis: Working Group I Contribution to the Sixth Assessment Report of the Intergovernmental Panel on Climate Change. doi:10.1017/9781009157896
- Gutzler, D.S., & Dubois, D. (2020). Our Climate Future, 2020 - Climate Change in New Mexico Over the Next 50 Years: Impacts on Water Resources [Bulletin 164]. New Mexico Bureau of Geology and Miineral Resources. https://geoinfo.nmt.edu/publications/monographs/bulletins/164/
- Wilson, A.B., Bromwich, D.H., & Hines, K.M. (2016). Simulating the Mutual Forcing of Anomalous High Southern Latitude Atmospheric Circulation by El Niño flavors and the Southern Annular Mode. Journal of Climate, 29(6), 2291-2309.
- Repetto, R. (2012). New Mexico’s Rising Economic Risks from Climate Change. Demos. https://www.demos.org/sites/default/files/publications/UpdatedNMFullReport.pdf
- Marlon, J.R., Wang, X., Bergquist, P., Howe, P.D., Leiserowitz, A., Maibach, E., Mildenberger, M., & Rosenthal, S. (2022). Change in US state-level public opinion about climate change: 2008-2020. Environmental Research Letters, 17(12), 124046. https://doi.org/10.1088/1748-9326/aca702
- Distler, L. N., & Scruggs, C. E. (2020). Arid Inland Community Survey on Water Knowledge, Trust, and Potable Reuse. I: Description of Findings. Journal of Water Resources Planning and Management, 146(4). https://doi.org/10.1061/(ASCE)WR.1943-5452.0001218
- New Mexico Energy, Minerals, and Natural Resource Department, Climate Policy Bureau. (2023). New Mexico Climate Adaptation and Resilience Plan. https://www.env.nm.gov/climateaction/wp-content/uploads/sites/39/2024/07/NM-C.A.R.P._03.06.24_Updated.pdf
- Leiserowitz, A., Maibach, E., Rosenthal, S., Kotcher, J., Goddard, E., Carman, J., Myers, T., Verner, M., Marlon, J., Goldberg, M., Ettinger, J., Fine, J., & Thier, K. (2024). Climate Change in the American Mind: Beliefs & Attitudes. Yale University and George Mason University. New Haven, CT: Yale Program on Climate Change Communication.
- National Weather Service. (2023, December 9). July Weather Summary. Weather Forecast Office, Albuquerque, NM. https://www.weather.gov/media/abq/Briefings/July2023.pdf
- IPCC. (2022). Climate Change 2022: Impacts, Adaptation, and Vulnerability. Contribution of Working Group II to the Sixth Assessment Report of IPCC [H.-O. Pörtner, D.C. Roberts, M. Tignor, E.S. Poloczanska, K. Mintenbeck, A. Alegría, M. Craig, S. Langsdorf, S. Löschke, V. Möller, A. Okem, B. Rama (eds.)]. doi:10.1017/9781009325844
- Toman, E., & Richard M. (2013). Human Dimensions of Climate Change Adaptation: Factors that Influence Behaviors. In Sivakumar, M., Lal, R., Selvaraju, R., Hamdan, I. (eds) Climate Change and Food Security in West Asia and North Africa. https://doi.org/10.1007/978-94-007-6751-5_20
- Hegazi, F., & Seyuba, K. (2022). The social side of climate change adaptation: reducing conflict risk [Policy brief]. Stockholm International Peace Research Institude (SIPRI). https://www.sipri.org/sites/default/files/2022-09/pb_2209_climate_change_adaptation.pdf
- US Census. (2024). Quick Facts New Mexico. https://www.census.gov/quickfacts/fact/table/NM/PST045224
Appendices
Appendix A. Survey Instrument
Default Question Block
Consent Form
You are invited to participate in the following online, anonymous survey aiming to understand how extreme weather- changing patterns are perceived among New Mexico’s population.
Purpose of the Study
This survey explores your perceptions and adaptation to extreme weather conditions. To effectively support New Mexico in dealing with extreme weather conditions, we need to better understand how you experience climate change and how you adapt to it. The results of this survey will help researchers at New Mexico State University (NMSU) better understand the perceptions and adaptability of weather changes from New Mexico’s population
Potential Risks and Benefits
There are no known risks associated with your participation in this survey other than those encountered in daily life. You will not receive direct benefits for participation in this survey.
Confidentiality
Responses will be recorded in a secure database. No identifying information will be stored by researchers at NMSU. Anonymous survey responses will be stored in a data repository and may be available to third parties in accordance with transparence and research principles.
Participation and Withdrawal
Your participation in this survey is voluntary. You may withdraw from the survey at any time without penalty
Study Results
The results of this study may be summarized in publications and presentations provided to academic audiences, industry stakeholders, and the public
Identification of Investigators and Review Board
If you have any questions about the research, please contact: Sawssan Boufous, PhD; (575)646-5737; sawssanb@nmsu.edu; Faculty at the Extension Economics Department, New Mexico State University, MSc 3169. P.O. Box 30 0003, Las Cruces, New Mexico 88003-8003. Brian Hurd, PhD; (575)646-2674; bhurd@nmsu.edu; Faculty at the Department of Agricultural Economics and Agricultural Business, New Mexico State University, MSc 3169. P.O. Box 30 0003, Las Cruces, New Mexico 88003-8003. If you have any questions about the research subject, please contact the Institutional Review Board Office of New Mexico State University at (575) 646-7177 or ric_admin@nmsu.edu.
__ I consent
__ I don’t consent
|
How would you rate your knowledge/familiarity regarding these climate terms and concepts? |
|||
|---|---|---|---|
|
Familiar |
Somewhat familiar |
Not |
|
|
Ecosystem |
|||
|
Clean |
|||
|
Carbon footprint |
|||
|
Biodiversity |
|||
|
Climate change |
|||
|
Are you concerned about climate change? |
|||
|---|---|---|---|
|
Yes |
Somewhat |
No |
|
| Are you concerned about climate change? |
|
|
|
| Which of the following best describes your opinions about climate change | |
|---|---|
| 1 | Climate change is happening mostly because of natural changes in the atmosphere |
| 2 | Climate change is happening mostly because of human activity such as burning fossil fuels |
| 3 | Climate change is happening equally because of human activity and natural changes |
| 4 | Climate change is happening but there is not enough evidence to determine its cause |
| 5 | Climate change is not happening |
|
Have extreme weather conditions ever affected any of these aspects of your daily life? |
|||
|---|---|---|---|
|
Yes |
To some extent |
No |
|
|
Reduced or loss of natural spaces |
|||
|
Deterioration of sleeping |
|||
|
Food shortages |
|||
|
Increased food prices |
|||
|
Increased housing costs |
|||
|
Increased utility bills |
|||
|
Decreased productivity |
|||
|
Cancellation of events/ |
|||
|
Loss of pets or deterioration of their health |
|||
|
Loss of domestic plants |
|||
|
Do you think enough is being done for climate change by the following? |
|||
|---|---|---|---|
|
Yes |
To some extent |
No |
|
|
Governmental authorities |
|||
|
Individuals and families |
|||
|
Non-Governmental Organizations & Environmental Groups |
|||
|
Corporations & Industry |
|||
|
In the summer of 2023, the United States in overall, and the Western region specifically experienced very extreme weather conditions ranging from deadly flooding to extremely high temperatures. Did any of these events alter your normal activity? |
|||
|
Yes |
Somewhat |
No |
|
| Did any of these events alter your normal activity? |
|
|
|
|
Who do you believe is primarily responsible for addressing changes in climate and long-run weather changes? |
|
|
1 |
It is the duty of governments |
|
2 |
It is the duty of companies and industries |
|
3 |
I don't know what I could do to fight climate change |
|
4 |
Lack of information about climate change |
|
5 |
Changing my behavior won't have impact on climate change |
|
6 |
It is too late to mitigate climate change |
|
7 |
I am not concerned about climate change |
|
8 |
Other, please precise |
| How helpful are the following sources for you to learn about suitable technologies and activities to mitigate adverse climate impacts? | |||
| Very helpful | Somehow helpful | Not helpful | |
| Family members and friends | |||
| Colleagues or classmates |
|||
| Government and local authorities | |||
| Government agencies | |||
| University extension | |||
| Social media | |||
| Specialized press and media | |||
| Which of the following actions did you consider during these recent extreme weather conditions? | |
| 1 | Reducing energy consumption |
| 2 | Reducing water consumption |
| 3 | Water recycling |
| 4 | Reducing consumption of disposable items |
| 5 | Buying seasonal and local products |
| 6 | Alternative transport |
| 7 | Purchasing a car that consumes less fuel |
| 8 | Installing renewable energy equipment |
| 9 | Insulating home |
| 10 | I didn't take action |
|
There are many reasons why people take actions aimed at fighting climate change. Which of the following apply to you? |
|
|
1 |
Desire to live in healthy and clean environment |
|
2 |
Need to keep household costs low |
|
3 |
Your duty as a citizen |
|
4 |
If everybody changed their behavior it will have an impact on climate change |
|
5 |
You are concerned about future generations |
|
6 |
You were directly exposed to climate change |
|
7 |
I didn't take actions |
Appendix B. Demographics
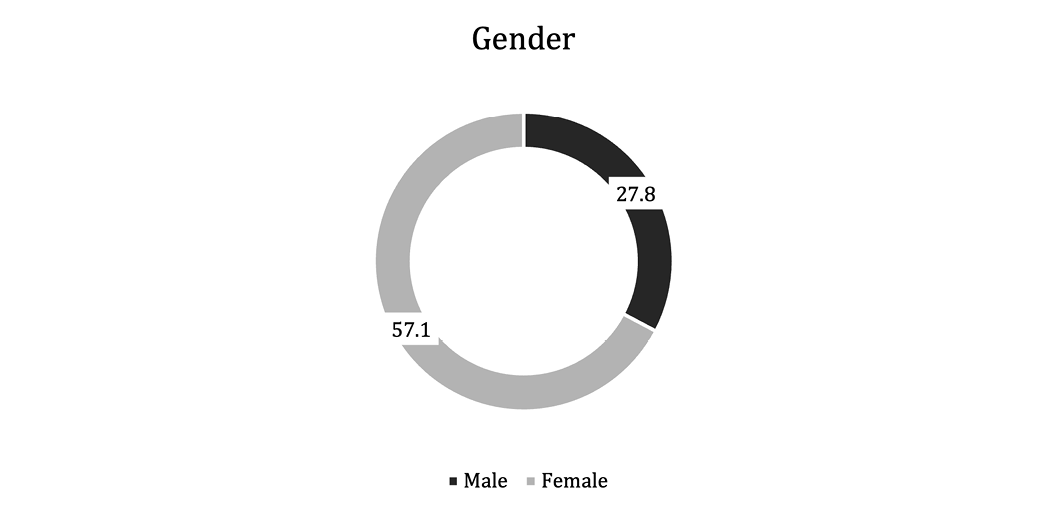
Figure 12. Respondents’ gender composition.
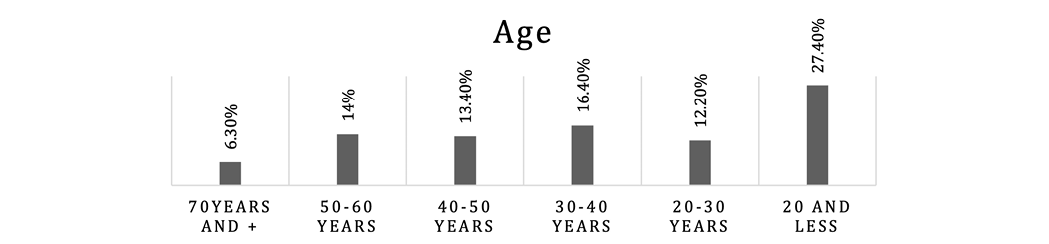
Figure 13. Respondent’s age distribution.
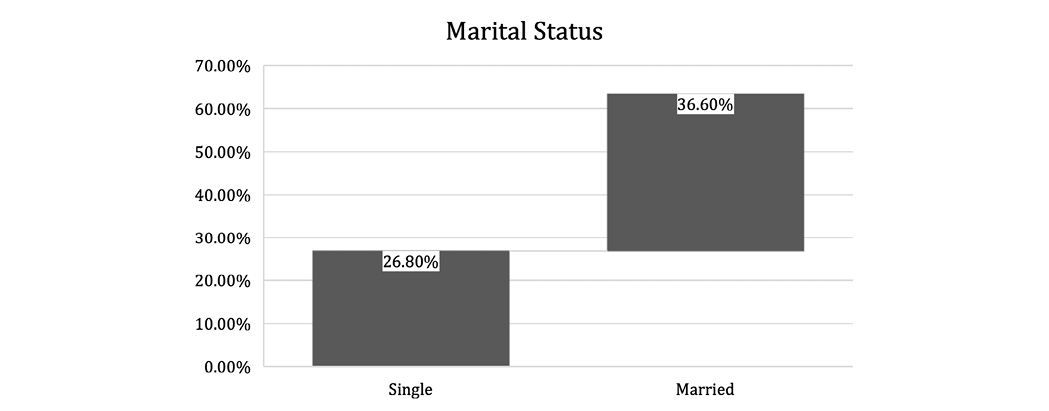
Figure 14. Respondents’ marital status.
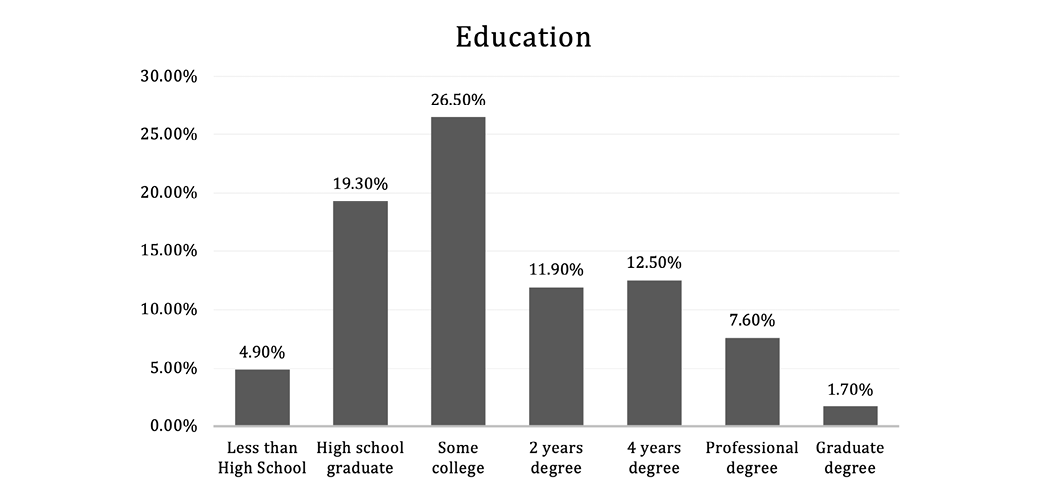
Figure 15. Respondents’ education.
Appendix C. Comparison of New Mexico’s General Population and Sample Characteristics


|
Comparison of New Mexico’s General Population and Sample Characteristics |
||
|---|---|---|
|
Characteristics |
New Mexico’s General Population |
Sample population |
|
Gender |
||
|
Female |
50.3% |
57% |
|
Male |
49.6% |
29% |
|
Age |
||
|
40 years and above |
48.9% |
56.5% |
|
Education |
||
|
Doctorate |
14.1% |
2% |
|
Degree |
17.5% |
13% |
|
Some college |
21.6% |
27% |
|
High school graduate |
25.1% |
19% |
|
Marital status |
||
|
Married |
43.5% |
37% |
|
Widowed |
5.85% |
5% |
|
Divorced |
13.05% |
14.2% |
|
Separated |
1.45% |
1.7% |
|
Never Married |
36% |
26.8% |
|
Total population |
2,117,522 |
1,202 |
|
Source: Field survey, 2020, https://data.census.gov/profile/New_Mexico?g=0400000US35 |
||

Sawssan Boufous is an Extension Specialist and Assistant Professor in the Extension Economics Department at the College of Agricultural, Consumer and Environmental Sciences. Her research focuses on sustainability, producer profitability, and the adoption of sustainable agricultural practices, including consumer demand and behavioral economics. She holds multiple advanced degrees in Agricultural and Applied Economics and Management Sciences.
To find more resources for your business, home, or family, visit the College of Agricultural, Consumer and Environmental Sciences on the World Wide Web at pubs.nmsu.edu.
Contents of publications may be freely reproduced, with an appropriate citation, for educational purposes. All other rights reserved. For permission to use publications for other purposes, contact pubs@nmsu.edu or the authors listed on the publication. New Mexico State University is an equal opportunity employer and educator. NMSU and the U.S. Department of Agriculture cooperating.
January 2026. Las Cruces, NM.