Circular 711
M.A. Marsalis, G.R. Hagevoort, J.L. Turner, and L.M. Lauriault
College of Agricultural, Consumer and Environmental Sciences, New Mexico State University
Authors: Respectively, Extension Forage Specialist, Department of Extension Plant Sciences; Extension Dairy Specialist and Extension Horse Specialist, Department of Extension Animal Sciences and Natural Resources; and Forage Crop Management Scientist, Department of Plant and Environmental Sciences. (Print Friendly PDF)
This publication serves as an update to the previously published Circular 641 "Hay Quality Sampling and Testing", originally authored by Mark A. Marsalis, Robert Hagevoort, and Leonard M. Lauriault. The original publication can still be found in our guides and circulars for reference.
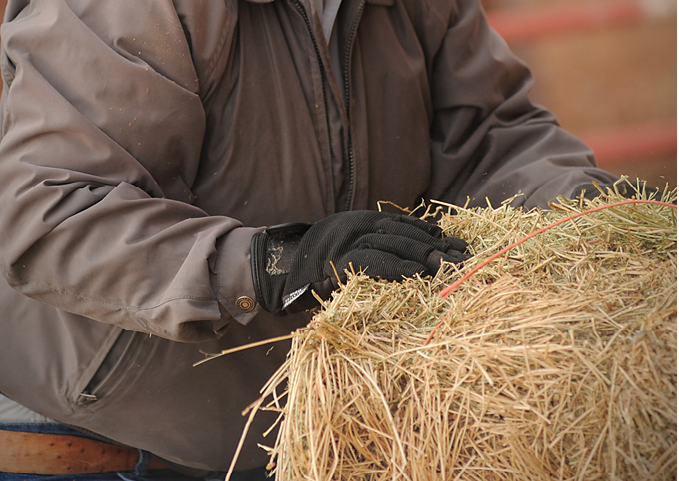
Photo by Darren Phillips. NMSU, 2021.
Introduction to Hay Testing
Hay is one method of forage preservation for animal feed that can be kept for long periods of time with little loss of nutrients if stored properly. Alfalfa is New Mexico’s top forage crop, with annual hay sales surpassing $200 million. Much of New Mexico’s hay is marketed to the dairy industry; however, significant quantities also are sold to the horse, beef cattle, and other livestock markets.
Knowing the nutritive value of hay is very important for both seller and buyer. High-quality hay brings a profitable price for the grower and allows dairies to feed less grain to cows. Dairies want hay with a high relative feed value (RFV), relative forage quality (RFQ), and digestibility that contribute to maximum milk production. Much of the hay for horses is sold based on appearance and horse owners prefer soft, leafy, and green alfalfa that is free of blister beetles, weeds, and other contaminants. Because hay is such a significant component of New Mexico’s agriculture and economy, accurate hay nutritive value estimates are critical not only for fair trading and proper diet formulation, but for hay grower and livestock industry livelihoods as well.
Occasionally, questions arise concerning the value of testing alfalfa and other hay and using a nutritive value measurement such as RFV as a basis for labeling and marketing. Feed, seed, and fertilizer manufacturers and distributors have wrestled with this problem in the past; to address it, each sector has developed a method of communication between buyer and seller known as the “guaranteed analysis.” The analysis is important because it gives the buyer an idea of what to expect from the product. Guidelines have been established for label contents, sampling and analytical procedures, and, in some cases, penalties for noncompliance. Hay grading systems must fairly reflect the product’s nutritive value for both the seller and the buyer. This is difficult with a forage product whose nutritive value can vary across a field and is inconsistent throughout a bale due to random distribution of leaves and stems.
Over the past several decades, forage analysis has become a valuable tool for hay marketing, mainly because of increased awareness and technology in the beef and dairy cattle industries. Sampling procedures and laboratory certification guidelines have been developed based on a recognized need to standardize hay sampling and analysis, and to assist those marketing hay based on the forage analysis. The following information regarding the National Forage Testing Association and its guidelines can be obtained from the website at www.foragetesting.org.
In 1984, the American Forage and Grassland Council (AFGC), the National Hay Association (NHA), and forage testing laboratories combined to form the National Forage Testing Association (NFTA). One goal of the NFTA was to initiate a forage testing certification program that would “improve the accuracy of forage testing and build grower and consumer confidence”. The NFTA certification program is updated each year to include new methods of grading laboratory performance. Since participation in the certification program is voluntary, not all hay testing laboratories are involved. Additionally, not all those participating receive certification.
Presently, laboratories are evaluated and graded six times every year. Reference samples, including five alfalfa samples (one of which contains approximately 20% grass), two corn silage samples, and one grass sample are sent to each laboratory, which analyzes them using standard, accepted techniques. Currently accepted techniques of forage analysis include traditional wet chemistry and near infrared reflectance spectroscopy (NIRS); NIRS is a newer technique that correlates the sample’s light reflectance with wet chemistry results. Although the initial investment in equipment for NIRS is high, it is quicker and more cost-effective in the long run compared to wet chemistry, while delivering equivalent results. Some laboratories will use only one technique, while others use both. The same forage sample is used in both techniques and grading is the same. Grading is done on the final cumulative bias total accuracy for all analyses (e.g., percent dry matter, crude protein, acid detergent fiber, and neutral detergent fiber).
When the results from each laboratory are received, they are compared to each other to determine if all laboratories came up with the same analysis results within specific limits (bias from the average). Those laboratories within the specified limits are certified. Nationally certified laboratories located in selected states are listed on the www.foragetesting.org website. Certified laboratories receive an NFTA-certified stamp for the year they are certified. Increasingly hay dealers, brokers, nutritionists, and dairy producers rely exclusively on certified analyses for their negotiations. For information on specific laboratories, check the NFTA website, or ask for proof of certification. For more information about the National Forage Testing Association, visit the NFTA website www.foragetesting.org
Sampling Guidelines for Hay Testing
Nutritive value analysis is an important alfalfa and other hay marketing tool for sellers and buyers, and sampling technique is a significant aspect of standardized hay testing. A laboratory analysis is valid only to the extent to which the sample was obtained properly and how accurately it represents the lot of hay. In addition, because the actual amount of sample that will be analyzed in the lab may be as little as 0.5 grams, it is imperative that an accurate and representative sample be taken. Hay sampling errors add more variation to results representing the whole lot than laboratory errors. A lot is defined as up to 200 tons of dry matter (approximately 225 tons of hay at 12% moisture) baled from the same field, cutting, and stage of maturity. It is important to not mix cuttings, fields, or hay types into a single sample. Additional lot divisions may be necessary to sample separately due to environmental and handling variation (e.g., rain-on vs. non-rained on hay). Any given lot can be packaged in any form or size of bale or stack. Although there can be considerable bale-to-bale variation (e.g., leaves, stems, weeds), proper sampling practices will incorporate this variability to represent the overall nutritive value of the lot.
What to Use for Sampling
The sample for each lot should consist of cores from at least 20 bales and weigh approximately 1/2 lb (approximately enough material to fill a quart size bag). Core-to-core and bale-to-bale variation can be quite large; hence, it is critical to take at least 20 cores per lot. Cores are taken using a hollow tube probe with an inside diameter of 3/8 to 5/8 in. that can take a 14- to 24-in. long core. Using a probe with a greater diameter or length or taking more than 20 cores may make the sample too large. In contrast, probes with smaller diameters may tend to push stems out of the way and gather only leafy material, thereby giving a misleading high-value result. Even if the sample is large it should not be divided because stems and leaves will separate and settle, thus creating subsamples that do not represent the lot. Send the whole sample to the laboratory. The laboratory may not be able to handle samples larger than 1/2-lb, and they may sub-sample the larger sample. This is not ideal; laboratories should utilize the entire sample submitted for their analysis. The probe’s cutting tip should be kept sharp to make coring easier and prevent the hay from wadding around the outside. Some commercial probes come with a replaceable cutting tip; for others, sharpening is best done using a round file to scallop the inside edge. Both hand-powered and drill-powered probes are available. A listing of hay probe types and company information is available on the NFTA website. Some county Extension offices have hay probes for use and can assist with collecting samples.
How and Where to Sample
Sample rectangular bales of any size by centering the probe at the end of the bale and drilling horizontally into the bale (across multiple flakes; Fig. 1). Round bales are sampled by drilling horizontally into the center of the bale’s curved side towards the core (Fig. 2).
Sampling at the end of a square bale or on the curved edge of the round bale helps obtain a representative field sample as it is collecting material from multiple windrows or locations in the field. If only the bale’s sides are exposed or fewer than 20 ends are exposed, as with large bales on a truck, drill on a sharp angle from as close to the end of the bale as possible and in the vertical center. Sample bales at random. There should be no predetermined reason to select a specific bale (location, color, leafiness, etc.). Hay bale “flakes” and grab samples are unacceptable for testing because they do not provide a good, random sample, and they often underestimate the nutritive value of the lot because they represent only a single location in the field. Do not sample on the sides or tops of bales or near the edges. If multiple samples are to be taken per bale (as may be the case with large bales), choose a new location for each core and do not reuse the same core hole. Remember, do not combine samples from different lots; submit each lot as a separate sample to the laboratory.
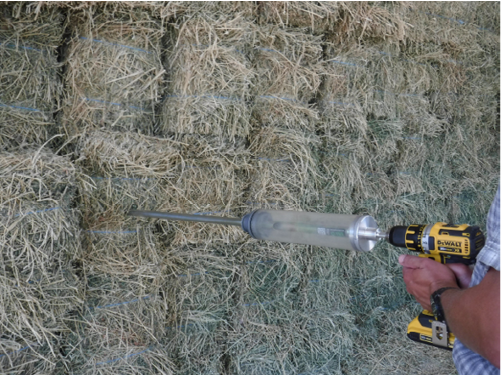
Figure 1. Proper sampling location on rectangular bales. Small 2-string bales shown here. Photo credit: Mark Marsalis.
To sample bales still in the field, count the number of bales, divide by 20 (= n), and sample every nth bale. For example, a farmer just baled a 120-acre circle of alfalfa. There are 4,800 small square bales in the field weighing about 75 lb each (180 tons). Since 4,800 / 20 = 240, the farmer will probe at least every 240th bale to get exactly 20 cores. If 1-ton bales are made, the farmer will have 180 bales, and in this scenario every 9th bale should be sampled (180 / 20 = 9). If the bales are not randomly distributed throughout the field, the farmer may want to take 25 or 30 cores rather than 20 to get a more random distribution. Remember, though, that taking more cores may make the sample too large. For stacked hay or truckloads, take an equal number of cores from each accessible side. Count the number of bale ends exposed, divide by 20 as before, and sample every nth bale. If the lot contains fewer than 20 small square or large round bales, core all the bales. If there are less than 20 large square bales, core each bale twice, but from opposite ends if possible. If deteriorated hay from the exterior of the bale or stack will not be fed to animals, or if they can be selective in their feeding, it should not be included in the sample. Otherwise, if hay is sold based on quality or if it will be ground before feeding, the deteriorated portion should be included in the sample.
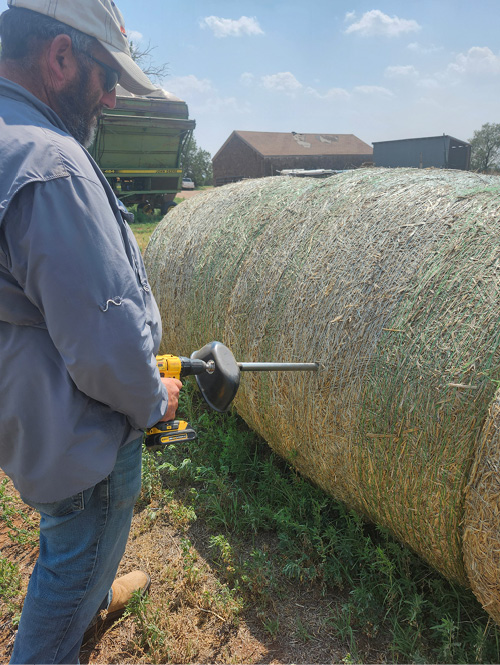
Figure 2. Proper sampling location on large round bales. Photo credit: Leonard Lauriault.
When to Sample
During the three weeks following baling, hay undergoes a “sweat” that results in a decline in nutritive value. This sweat is a result of continued bacterial respiration that consumes plant sugars and produces heat. In time, bacterial activity slows, heat generation ceases, and the hay stabilizes to what is referred to as cured hay. Any hay that will not be fed for more than three weeks should be sampled as close to feeding time as possible. Additionally, hay stored outside should be sampled within two to four weeks of feeding so that continued deterioration does not significantly lower bale nutritive value compared to the sample taken for analysis. Sellers of hay who wish to use a nutritive value test to market their hay should sample as close as possible to the sale.
Submitting Sample to Laboratory
Take samples early in the week, seal them tightly in an airtight polyethylene bag (e.g., zipper-type freezer bags), and immediately mail or deliver them to the laboratory so they will not spend the weekend in shipment. Do not allow samples to sit for prolonged periods exposed to extreme conditions such as heat or sunlight. Label each sample with the lot, area where grown (field), forage type (species), cutting, stage of maturity, and special conditions (e.g., rain/sun damage, frosted, drought, etc.). Use a fine point permanent marker to label directly on the sample bag. It also may be helpful to include a label inside the bag. Submit your sample to an NFTA-certified laboratory that has shown a commitment to quality and has taken steps to ensure accurate and reliable testing. A list of certified laboratories can be found on the NFTA website. Most laboratory websites will list the types (and cost) of analysis options they provide and will have downloadable forms to include with your sample prior to shipping. Work with your local County Extension office to determine the proper analysis for your feeding or marketing goals.
Forage Nutritive Value Analysis: Definitions
A distinction is made between the terms “forage quality” and “nutritive value”. Nutritive value is a term that describes the nutrient composition of a forage (e.g., protein, fiber, sugars, energy), determined by laboratory procedures and equations. Forage quality, however, describes the potential of a forage to meet the nutritional requirements of a class of livestock. Quality is quantified by animal performance or response from feeding the forage. This can include milk production, weight gains/pounds of beef, palatability/acceptance, intake, etc. This publication focuses mainly on forage nutritive value as it pertains to sampling, testing, and interpretation of laboratory results of a hay sample.
Laboratory evaluation of nutritive value of alfalfa and other hay may be performed by chemical analysis or by near infrared reflectance spectroscopy (NIRS), which is a more rapid and cost-effective method than traditional wet chemistry. In this method, nutritive value parameters are measured via prediction equations developed from a set of calibration samples analyzed through wet chemistry. Most parameters below can be estimated now through the NIRS procedure. Equations for NIRS estimates of nutritive value are well developed for alfalfa and most other traditional forages. They are not as well developed for emerging forages, although universal equations that include many species can be applied. Once the results are obtained from the laboratory, assessment of actual nutritive value must be conducted. Below are some of the more common terms used in nutritive value analysis, what they mean, and how they are measured or calculated. The listing below is not all-inclusive of every option offered by forage-testing laboratories. Table 1 provides an example of a result from a hay sample submitted to a commercial laboratory.
Dry matter (DM) is the percentage of the forage that is not water. If a forage is 55% dry matter, it has 45% water (100 − 55 = 45). Rations are balanced on a dry matter basis. Most laboratories will report results in two columns: “As Sampled”, “As Received”, or “As Fed”; and “Dry Basis” or “Dry Matter Basis.” Only values designated as “Dry Basis” can be compared across nutritive value parameters. “As Sampled” values can be converted to “Dry Basis” by multiplying by the actual DM percentage.
Crude protein (CP) is a mixture of true protein and non-protein nitrogen, and also includes insoluble crude protein. It is estimated by measuring the total nitrogen in the sample and multiplying this value by 6.25. In general, a high CP level is desirable, but a high CP level is not always indicative of highly nutritious forage. High CP is usually obtained by harvesting at an early growth stage. Crude protein declines with maturity in most forages. Heat damage can alter protein availability, and CP values give no indication if heat damage has occurred.
Insoluble crude protein (ICP) and acid detergent insoluble crude protein (ADICP) refer to the proportion of CP that is not available to the animal and are an indicator of the amount of heating that has taken place in storage. A low ICP value is desirable, and the ICP:CP ratio should be less than 0.1, indicating that harvest and storage practices were correct. ICP:CP ratios higher than 0.1 can occur when cutting is delayed, hay is baled too wet, or haylage is stored too dry, resulting in excessive heating that can cause significant heat damage.
Adjusted crude protein (ACP), also referred to as available crude protein, is the amount of crude protein available to the animal for digestion. It is adjusted for the amount of bound or insoluble protein: ACP = CP − ICP. If the heat-damaged protein is not more than 10% of the crude protein, some labs will present the same value for CP and ACP.
Ash (and Minerals) is the measure of the total mineral content in the forage. It is the residue that remains after burning away all organic matter in the sample. Ash can include both internal plant minerals (e.g., calcium, phosphorus) and external mineral contamination (e.g., soil particles, iron, aluminum, and silica). While providing a source of some essential minerals for livestock, ash has a negative impact on energy content of forages by replacing energy-dense nutrients. Every 1% increase in ash leads to a 1% decrease in digestibility. Excessive ash content also can lead to reduced animal performance. Typical ranges are 5-6% for grasses and 7-8% for legume hays. Most laboratories offer individual mineral analysis to provide estimates of calcium, phosphorus, magnesium, potassium, sulfur, chloride, and other microminerals (e.g., iron, zinc, copper, selenium).
Neutral detergent fiber (aNDF, uNDF, and uNDFom) represents the cell wall portion of the forage and includes hemicellulose, cellulose, lignin, and insoluble nitrogen compounds. The aNDF designation indicates that amylase and sodium sulfite were used during the wet chemistry process, which is the preferred method. Many NIRS estimates of NDF are based on calibrations using aNDF. A further processing of the NDF residue is to remove all of the insoluble ash via burning in a furnace and weighing the difference. This is referred to as aNDFom and is considered NDF presented on an “organic matter” or “ash free” basis. Overall, the NDF portion is only partially digestible. As such, labs will also report uNDF and uNDFom, which is the undigestible portion of the NDF fraction, and the uNDF on an “ash free” basis, respectively. On one hand, NDF is necessary for ruminants as it provides a source of slowly- and steadily- available energy for rumen microbes and acts as a mat that traps other feed particles. Effective fiber promotes rumen health and proper function. It also stimulates chewing, salivation, and rumination which help buffer rumen pH. However, NDF is negatively correlated with intake—the higher the percentage NDF, the less of the forage the animal will eat and high fiber amounts will reduce overall performance. In general, low amounts of fiber are desirable. Neutral detergent fiber increases as forages mature.
Dry matter intake (DMI) is based on NDF concentration and is an estimate of the amount of forage an animal will consume. Feeding studies have shown that as percent NDF increases in forages, animals tend to consume less. Therefore, NDF can be used to estimate DMI. Use the following formula to estimate DMI: DMI (% of body weight) = 120 / NDF (% of DM).
Neutral detergent fiber digestibility (NDFD) is a term that expresses digestible neutral detergent fiber (dNDF) as a percent of actual NDF. It is an indicator of how much of the total cell wall is digestible. Digestibility of NDF can be determined by in vivo, in vitro, and in situ techniques in addition to NIRS analysis. The NDFD is estimated at 24-, 30-, and 48-hr increments. The 48-hr NDFD is required to calculate RFQ. Some labs will also provide an NDFDom estimate, which is fiber digestibility presented on an “ash free” basis.
Acid detergent fiber (ADF) represents the portion of the forage remaining after a weak acid digestion and contains cellulose, lignin, silica, and insoluble nitrogen compounds. In general, as forage plants mature, ADF increases and digestibility of forage decreases. While it has been commonly used to predict digestibility, ADF has not been shown consistently to be highly correlated with actual digestibility. Low ADF is desirable. Acid detergent fiber is commonly used to calculate RFV, DDM, and TDN (all defined below).
Digestible dry matter (DDM) is a calculated value used to estimate the percentage of the forage that is digestible as determined from ADF. Digestible dry matter can be used to estimate the energy value of the forage, but other estimates are perhaps more suited for energy. The lower the ADF, the higher the DDM will be. Digestible dry matter is used in the calculation of RFV. The following formula is used to calculate DDM: DDM (%) = 88.9 − [0.779 * ADF (% of DM)].
Total digestible nutrients (TDN) is an estimate of the total amount of nutrients in a forage that is digestible by the animal. Historically, it has been calculated from ADF similar to DDM; however, newer calculations summing CP, non-fiber carbohydrates, NDFD, and fat may be more accurate (e.g., TDN (legume) = (NFC * 0.98) + (CP * 0.93) + (FA * 0.97 * 2.25) + [NDFn * in vitro NDFD / 100] − 7). (FA = fatty acids, NFC = non-fiber carbohydrates, NDFn = NDF*0.93). This TDN calculation varies slightly for grasses.
In-Vitro True Dry Matter Digestibility (IVTDMD or IVTD or IVDMD) is an estimate of the potential digestible content of a forage. In vitro dry matter digestibility (IVDMD) is determined by incubating a ground feed sample under anaerobic conditions in rumen fluid for a determined amount of time (48 hrs.), followed by acid-pepsin digestion, after which remaining residue is dried and weighed to estimate the amount of the sample lost to “digestion”. The IVTD method uses a NDF solution for the final step. These digestibility estimates can be predicted by NIRS.
Net energy for lactation (NEL) is an estimate of the energy of a particular forage that is used for milk production by the animal during lactation in addition to maintenance (NEM). It is most commonly used for predicting how a forage will meet the energy needs of dairy cows. This system is based on the utilization of the forage by the animal at specific levels of energy requirements. Net energy for maintenance and for gain (NEG) are two other components of the net energy system, and represent estimates of energy required for basic metabolic processes and body gain (i.e., weight) of the animal, respectively.
Digestible Energy (DE) is a term used to describe the energy value of feedstuffs and is particularly used in estimating potential energy for horses. In simple terms, it is the gross energy of the feed minus the energy remaining in the feces, or the amount of energy available to the horse during digestion. It can be calculated from laboratory estimates of CP, ADF, non-structural carbohydrates, ash, hemicellulose, and fat, and is expressed as Mcal/lb. Laboratories may present this value as “Horse DE”. While DE can be used to compare different forages, it should not be solely relied upon for determining a forage’s usefulness in the equine diet.
Non-Fiber (NFC), Water-Soluble (WSC), and Ethanol-Soluble (ESC) Carbohydrates
Non-fiber carbohydrates (NFC) are the readily digestible carbohydrates that are not contained in the plant cell walls and consist of starch, sugars, pectins, and organic acids. It is calculated as: 100- (CP% +NDF% +Fat% + Ash%). Water-soluble carbohydrates consist of simple sugars and fructans. Ethanol-soluble carbohydrates represent the portion of carbohydrates soluble in an 80% ethanol/20% water solution (primarily mono- and disaccharides). Starch content is another common estimate provided on analysis reports.
Non-structural carbohydrates (NSC), or total non-structural carbohydrates (TNC), is another measure that is sometimes reported and includes simple sugars, fructans, and starch. It can be calculated by adding WSC and starch from a report. The NSC value is important, and often used, for determining if a hay, or other forage, will cause problems in horses with disorders such as equine metabolic syndrome (insulin dysregulation, laminitis). In such cases, low NSC (NSC <10%) is generally preferred. Hays with a high fructan content may also be undesirable for horses prone to laminitis, so owners may wish to know the fructan content in the hay. Many cool-season grasses can accumulate high levels of fructan. It can be roughly estimated by subtracting ESC from WSC.
Fat, Crude Fat (CF), Ether Extract (EE) are estimates and procedures for the high-energy, highly digestible lipid and fatty acid compounds of a forage. These compounds are relatively insoluble in water, but are soluble in an ether solvent (ether extract). Important lipids include triglycerides and phospholipids. Lipids are energy-dense and contain 2.25 times the energy as carbohydrates. Most laboratories will report crude fat (ether extract) or total fatty acids in the analysis report. Crude fat contains fatty acids, but also includes compounds of no nutritional value such as terpenes, waxes, and pigments. “True fat” is estimated as crude fat minus one. Reporting of individual fatty acids (e.g., oleic, linoleic, linolenic) is becoming more commonplace. In general, forages contain low fat content (i.e., 1-3%).
Relative feed value (RFV) is an index that combines ADF (DDM) and NDF (DMI) nutritional factors to arrive at one number to measure and compare potential forage value. It has been used to allocate forages with varying digestibility and intake to different livestock classes. This index is now antiquated and a newer index (RFQ, see below) was created to replace RFV as the industry standard. Despite this, RFV is still used extensively for marketing hay and price determination (Table 4). It may be adequate to compare different alfalfas to one another, but RFV is not a good index to use to compare grass or grass-legume hays. The following formula is used to calculate RFV: RFV = DDM * DMI / 1.29; where DDM and DMI are calculated from ADF and NDF, respectively.
Relative forage quality (RFQ) is a better index and estimate of actual forage value than RFV, and better predicts how an animal may perform on a particular forage. It is calculated from TDN and intake based on in vitro estimates of digestible fiber (NDFD) instead of simply ADF, which RFV uses. For convenience, index value ranges have been kept similar to those of RFV. Since it takes into account NDFD, RFQ is particularly useful for predicting the value of grass hays because digestibility of fiber is typically high in grasses. This characteristic is not accounted for with RFV. It is considered a fairer first step of setting hay prices for both buyer and seller by determining how a particular lot of hay may or may not meet the nutritional needs of a class of livestock. When both values are given, RFQ should be used. The analysis in Table 1 includes a 48-hr in vitro analysis of the NDF fraction, which allows RFQ to be calculated, along with RFV. Knowing RFQ helps explain unexpected milk response differences in dairy cows (and other livestock performance indicators) from apparently similar testing hays (based on RFV). The following formula is used to calculate RFQ: RFQ = (DMI, % of body weight) * (TDN, % of DM) / 1.23; where DMI takes NDFD into account, and TDN is calculated using CP, NFC, fatty acids, and NDFD. Neither RFQ nor RFV are intended to be used for balancing feed rations, nor are they recommended for use with corn silage as they do not reflect starch availability.
|
Table 1. Example of a Nutritive Value Analysis Report from a Legume Hay Submitted to a Commercial Laboratory |
|||
|---|---|---|---|
|
Legume |
As Sampled |
Dry Matter |
Unit |
|
Moisture |
11.8 |
% |
|
|
Dry Matter |
88.2 |
% |
|
|
Crude Protein |
17.8 |
20.1 |
% DM |
|
ADICP |
0.4 |
0.5 |
% DM |
|
Available Protein |
17.4 |
19.6 |
% DM |
|
Soluble Protein |
7.8 |
8.9 44.0 |
% DM % CP |
|
Degradable Protein (calc.) |
12.8 |
14.5 72.0 |
% DM % CP |
|
TDN |
62.6 |
70.9 |
% DM |
|
Net Energy Lactation |
0.65 |
0.74 |
Mcal/lb |
|
Net Energy Maintenance |
0.67 |
0.75 |
Mcal/lb |
|
Net Energy Gain |
0.42 |
0.48 |
Mcal/lb |
|
Acid Detergent Fiber (ADF) |
22.9 |
25.9 |
% DM |
|
Neutral Detergent Fiber (NDF) |
26.9 |
30.5 |
% DM |
|
NDF 48-hr. Digestibility (NDFD) |
48.4 |
% NDF |
|
|
Ash |
9.7 |
11.0 |
% DM |
|
NFC |
32.3 |
36.6 |
% DM |
|
Calcium |
1.61 |
1.82 |
% DM |
|
Phosphorous |
0.20 |
0.23 |
% DM |
|
Magnesium |
0.29 |
0.33 |
% DM |
|
Potassium |
2.40 |
2.72 |
% DM |
|
Sodium |
0.144 |
0.163 |
% DM |
|
Iron |
183 |
208 |
PPM |
|
Manganese |
37 |
42 |
PPM |
|
Zinc |
23 |
26 |
PPM |
|
Copper |
7 |
8 |
PPM |
|
Relative Feed Value (RFV) |
210 |
||
|
Relative Forage Quality (RFQ) |
213 |
||
|
DM = dry matter, ADICP = acid detergent insoluble crude protein, Mcal = megacalories, NFC = non-fiber carboydrates, TDN = total digestible nutrients, PPM = parts per million. |
|||
Other Analyses
All forage testing laboratories offer additional services that go beyond the scope of basic nutritive value. These include toxicity analyses (e.g., nitrate, prussic acid, mycotoxins), mold/yeast counts, and fermentation profiles (for silages). Additional tests may be warranted if hay is suspected of potential toxicity due to species (e.g., sorghums) of hay, environmental stressors, or weeds contained in the hay.
For more information on nitrate and prussic acid poisoning in livestock, see: B-807: Nitrate Poisoning of Livestock (https://pubs.nmsu.edu/_b/B807/index.html) and B-808: Prussic Acid Poisoning of Livestock (https://pubs.nmsu.edu/_b/B808/index.html), respectively.
Hay Grading and Quality Standards
Now it is common for hay to be shipped not only across state lines but also to different countries, making a standardized product evaluation essential. While current standards still do not require specific laboratory or digestibility nutrient analysis testing, alfalfa hay standards do provide a slightly more specific distinction among classes of hay. This ensures fairer pricing because it also provides a better estimate of potential feeding value prior to purchase than appearance alone.
The nutritive value parameters described in the previous section can be examined after laboratory analysis and results compared to the ranges of “quality” standards and marketing categories in Tables 2 (old system), 3 and 4 in order to determine the rank and value of a particular hay. While RFQ is considered a better index to use, RFV is still very popular and widely used throughout the western U.S. for determining price of hays. However, RFV is calculated based only on the amount of ADF and NDF and doesn’t take into account the digestibility of the fiber fraction. On the other hand, RFQ takes NDFD into account and helps explain variation in digestibility and animal performance responses to similarly testing hays based on RFV. In addition, crude protein is another important factor in ranking value of hay. Slight changes in any of the values (especially RFV and CP) can have a significant effect on negotiated hay price, whether justified or not. While the current USDA guidelines still list only crude protein to rank grass hays (Table 3), certainly the “value” of grass hay is affected by more than protein content alone. In fact, fiber digestibility (NDFD) can be quite high, leading to RFQ values greater than 150 in some cool-season grasses. Standards for alfalfa hay are higher than those for grasses or legume/grass blends, and the expected high nutritive value of alfalfa is evidenced by the common desire among dairies in the West to purchase “supreme” hay (Table 4). In any event, all these guidelines should be used cautiously and as a starting point for discussions on how the important parameters for both buyer and seller are able to match the nutritional needs of the animal consuming the hay.
|
Table 2. Quality Standards for Legume, Grass, or Mixed Hay |
||||||
|---|---|---|---|---|---|---|
|
Quality Standard |
Legume Stage |
CP |
ADF |
NDF |
DMI |
RFV |
|
Prime |
Bud, Pre-bloom |
>19 |
<31 |
<40 |
>3.0 |
>151 |
|
1 |
Early flower |
17-19 |
31-35 |
40-46 |
3.0-2.6 |
151-125 |
|
2 |
Mid-bloom |
14-16 |
36-40 |
47-53 |
2.5-2.3 |
125-103 |
|
3 |
Full-bloom |
11-13 |
41-42 |
54-60 |
2.2-2.0 |
102-87 |
|
4 |
Full-Bloom |
8-10 |
43-45 |
61-65 |
1.9-1.8 |
86-75 |
|
5 |
Mature or Damaged |
<8 |
>45 |
>65 |
<1.8 |
<75 |
|
Source: Hay Market Task Force, American Forage and Grassland Council. CP = crude protein, ADF = acid detergent fiber, NDF = neutral detergent fiber, DMI = dry matter intake, RFV = relative feed value, RFQ = relative forage quality. |
||||||
Visual Estimates of Nutritive Value and Quality
Early hay standards established grades on visual estimates only, but these estimates of feeding value were subjective and difficult to substantiate. Even today, too much emphasis is put on visual characteristics of hay as it relates to nutritive value.
Still, while it is not recommended to assess hay on appearance alone, certainly visual observations of the hay are important. An initial visual estimate of hay can alert you to hay that might or might not be worth buying. It is impossible to estimate the actual nutritive value of hay based on looks, and visual criteria are not necessarily related to animal performance. Bright green, vibrant-looking hay may not always test high, and hay with a poor appearance may be good but give an impression of low nutrition.
Buyers and sellers should use both laboratory results and visual appraisal to set a fair price. Several factors should be considered when inspecting a bale or load of hay, including maturity, leafiness, color, proportion and coarseness of stems, foreign material (including weeds), odor, mold, and dust. Leaves are the most digestible part of the plant and contain the most protein, so they should be retained as much as possible. In contrast, excessive stemminess can lead to high levels of fiber, reduced digestibility and intake, and rejection by livestock consuming the forage (e.g., horses). Green color is an indicator of high vitamin A content and implies proper curing.
Visual inspection is complicated by the fact that any one bale is not a uniform product. Distribution of leaves and stems is not uniform throughout the bale. In addition, large variability can exist from one part of the field where the hay was harvested to another, leading to bale-to-bale variation. This further supports the need for good representative samples for laboratory analysis to be taken not only from individual bales but also from the whole lot.
The laboratory parameters for alfalfa hay in Table 4 should be used with and coincide with the physical descriptions within each category listed below.
Supreme: Very early maturity, pre-bloom, very soft, fine-stemmed, extra leafy—factors contributing to a very high nutritive content. Hay is excellent in color, free of damage, mold, dust, and foreign material. For legumes, this will occur at bud to first flower.
Premium: Early maturity, pre-bloom, fine-stemmed, extra leafy—factors contributing to a high nutritive content. Hay is green and free of damage, mold, dust, or foreign material (< 5%). Also occurs from bud to first bloom in legumes.
Good: Early to average maturity, that is, early- to mid-bloom (first flower to 50% of plants in bloom). Leafy, fine- to medium-stemmed, free of damage, mold, and dust, may have slight discoloration.
Fair: Late maturity, mid-to-late bloom (> 50% of plants in bloom). Moderate or low leaf content and generally coarse-stemmed. Hay may show slight damage.
Utility: Hay in very late maturity with mature seedpods. Very coarse-stemmed. Could include hay discounted due to excessive damage and heavy weed content or mold.
|
Table 3. Grass Hay Guidelines |
|
|---|---|
|
Quality |
Crude Protein Percent |
|
Premium |
Over 13 |
|
Good |
9-13 |
|
Fair |
5-9 |
|
Utility |
Under 5 |
|
Source: USDA Hay Quality Designation Guidelines. Agricultural Marketing Service. |
|
While laboratory analyses and visual inspections are helpful in determining the nutritive value of hay, they are not absolute, and the most accurate test of quality is animal performance. High-quality hay will be readily consumed. Animal performance is determined by intake, digestibility, and nutrient content, and is also impacted by toxic compounds within the hay product. Some hay or hay mixtures are just naturally preferred by animals. Softer, leafier hay is more palatable than hay with more stems (less digestible) or hay that has lost leaves due to pest problems or leaf shatter at baling. The hay must also be free of harmful components that might limit animal intake. This includes not only toxic compounds within the hay or weeds that were harvested but also dust or mold that may have accumulated within the hay product during baling, storing, or at feeding.
Weeds can lead to considerable reductions in price and should be eliminated as much as possible regardless of their nutritive value. Buyers, whether purchasing for dairy cows or horses, desire hay that is free of weeds, and growers should recognize a price incentive to maintain a weed-free crop.
Some states, such as Colorado and New Mexico, have a weed-free certification program that has added another set of criteria to certain certified hay sold in and out of state. Usually, the certification is for “noxious weed-free” hay to prevent the spread of particularly problematic weeds. Use of certified noxious weed free hay is often required when feeding animals on public lands. Few states have implemented a weed-free certification program due to additional costs for color-coded twine used on certified bales and the need for multiple inspections in the field in addition to an inspection of the final product.
With weed-free certification, however, another sales class of hay and straw has emerged for marketing beyond the standards of supreme, premium, good, fair, and utility. For the weed-free program, hay fields are inspected for the presence of certain weeds shortly before harvest. The harvested hay is certified rather than the field, so each cutting must be certified. Certified weed-free hay must be labeled as such, and it can be identified by color-coded twine. This is the best form of proof, as the twine is only available through the certification program. Additional labels and transit certificates are available as well. There are no other classes within the weed-free certification program, and hay is either certified weed-free or not certified. For more information on the New Mexico Certified Noxious Weed Free Program visit: https://pubs.nmsu.edu/_a/A145/index.html
Aside from feeding the product to determine overall quality, forage nutritive value analysis is the best estimate of potential animal performance and, consequently, the best basis for hay pricing. Only a properly collected and analyzed sample is of value in this regard. Bear in mind that ultimate forage quality is determined by the animal to which the hay is to be fed. Some species of livestock will perform best on lower-quality hay than what is necessary to sustain a highly productive dairy cow. Be sure to balance your ration for the animals to be fed. Consult your County Extension Agent with questions regarding formulating rations for your livestock.
|
Table 4. Alfalfa Guidelines (domestic livestock use and not more than 10% grass); Commonly Used for Marketing in the Western U.S. |
|||||
|---|---|---|---|---|---|
|
Hay Quality Category* |
CP |
ADF |
NDF |
TDN |
RFV |
|
Supreme |
>22 |
<27 |
<34 |
>62 |
>185 |
|
Premium |
20-22 |
27-29 |
34-36 |
61-62 |
170-185 |
|
Good |
18-20 |
29-32 |
36-40 |
58-60 |
150-170 |
|
Fair |
16-18 |
32-35 |
40-44 |
56-58 |
130-150 |
|
Utility |
<16 |
>35 |
>44 |
<56 |
<130 |
Source: USDA Hay Quality Designation Guidelines. Agricultural Marketing Service.* All quality parameters are based on 100% DMAbbreviations: CP = crude protein, ADF = acid detergent fiber, NDF = neutral detergent fiber, TDN = total digestible nutrients, RFV = relative feed value |
|||||
References:
Allen, V.G., Batello, C., Berretta, E.J., Hodgson, J., Kothmann, M., Li, X., McIvor, J., Milne, J., Morris, C., Peeters, A., & Sanderson, M. (2011). An international terminology for grazing lands and grazing animals. Grass and Forage Science, 66, 2–28.
Ball, D.M., Collins, M., Lacefield, G.D., Martin, N.P., Mertens, D.A., Olson, K.E., Putnam, D.H., Undersander, D.J., & Wolf, M.W. (2001). Understanding Forage Quality. American Farm Bureau Federation Publication 1(1). https://fyi.extension.wisc.edu/forage/files/2017/04/FQ.pdf
Hancock, D.W. (2011). Using relative forage quality to categorize hay (CSS-F048). University of Georgia Extension. https://hdl.handle.net/10724/34984
Newman, Y.C., Lambert, B., & Muir, J.P. (2006). Defining forage quality: Nutritive value of southern forages (SCSCPU-119). Texas A&M AgriLife Extension. https://agrilifelearn.tamu.edu/s/product/defining-forage-quality/01t4x000004OUi1AAG
Undersander, D., & Moore, J.E. (2002). Relative forage quality. Focus on Forage, 4(5). University of Wisconsin Extension. https://cropsandsoils.extension.wisc.edu/articles/relative-forage-quality/
USDA. Hay quality designation guidelines. USDA-Agricultural Marketing Service. Retrieved April 16, 2024, from https://www.ams.usda.gov/sites/default/files/media/HayQualityGuidelines.pdf

Mark Marsalis is a professor and Extension Forage Specialist in the Department of Extension Plant Sciences at New Mexico State University. He earned his M.S. at the University of Tennessee and his Ph.D. at Texas Tech University. His Extension and research interests include efficient and sustainable management of irrigated and dryland forage crops to maximize yields and profitability in limited-water situations.
To find more resources for your business, home, or family, visit the College of Agricultural, Consumer and Environmental Sciences on the World Wide Web at pubs.nmsu.edu.
Contents of publications may be freely reproduced, with an appropriate citation, for educational purposes. All other rights reserved. For permission to use publications for other purposes, contact pubs@nmsu.edu or the authors listed on the publication.
Brand names appearing in publications are for product identification purposes only. No endorsement is intended, nor is criticism implied of similar products not mentioned. Persons using such products assume responsibility for their use in accordance with current label directions of the manufacturer.
New Mexico State University is an equal opportunity/affirmative action employer and educator. NMSU and the U.S. Department of Agriculture cooperating.
October 2024 Las Cruces, NM