Circular 675
Joel Diemer, Terry Crawford, and Michael Patrick
College of Agricultural, Consumer and Environmental Sciences
Respectively, Professor/Extension Economic Development Specialist, Professor/Department Head, and Associate Professor/Extension Community Resource and Economic Development Specialist, Department of Agricultural Economics and Agricultural Business, New Mexico State University. (Print Friendly PDF)
Executive Summary
The combination of agriculture and food processing is an important part of New Mexico’s economy1. Together the two broad industries accounted for $10.6 billion (roughly 12.3%) of New Mexico’s $86.5 billion gross state product (GSP) 2 in 2012. In addition, the two industries directly created 32,578 jobs and 18,308 jobs in related support activities for a total of 50,886 jobs statewide 3.
Agriculture alone accounted for $3.9 billion in sales at the farm/ranch level and an additional $2.1 billion in value-adding processing/distribution, marketing, financing, and supporting servicesi. Agriculture was responsible for a total of 41,961 jobs in New Mexico in 2012, including 26,924 jobs in production-related activities and an additional 15,037 jobs in processing/distribution, marketing, financing, and supporting activities.
Food processing alone accounted for $2.9 billion in products and an additional $1.7 billion in value-adding processing/distribution, marketing, financing, and supporting services. Food processing was responsible for 8,924 jobs in New Mexico in 2012, including 5,654 jobs in production-related activities and an additional 3,270 jobs in processing/distribution, marketing, financing, and supporting activities.
Background
New Mexico Agriculture and Food Processing: A Snapshot
According to the New Mexico Department of Agriculture (NMDA), there were 24,721 farm and ranch operations in New Mexico in 2012. The state’s agriculture is dominated by family operated farms and ranches. Fully 62.1% are considered small by USDA standards, with annual sales less than $250,000ii.
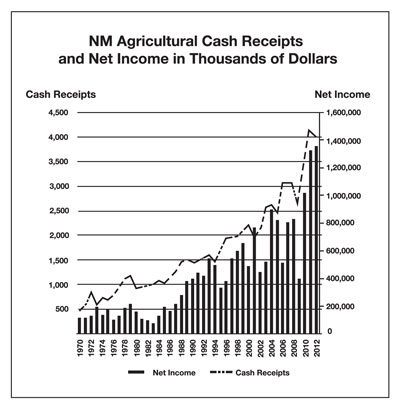
Figure 1. New Mexico agricultural cash receipts and net income, 1970–2012.
The total value of the agricultural sector’s production increased from $2.9 billion in 2009 (a poor year because of dairy losses) to $4.26 billion in 2012—up 47% (Figure 1). The value of livestock production increased 56% from 2009 to 2012 to $3.14 billion, primarily due to increased milk and cattle prices. The value of crop production increased 29% from 2009 to 2012 to $823 million, but has remained steady since 2010. The total value of services related to agriculture was approximately $240 million in 2012, down 26.58% from 2008, the most recent high point (USDA–NASS, 2012).
In 2012, New Mexico’s top six agricultural commodities accounted for 89% of total agricultural revenues (Figure 2): cattle and calves ($1.751 billion), dairy products ($1.409 billion), hay ($172.3 million), pecans ($110.5 million), chile ($65.4 million), and onions ($56.1 million).
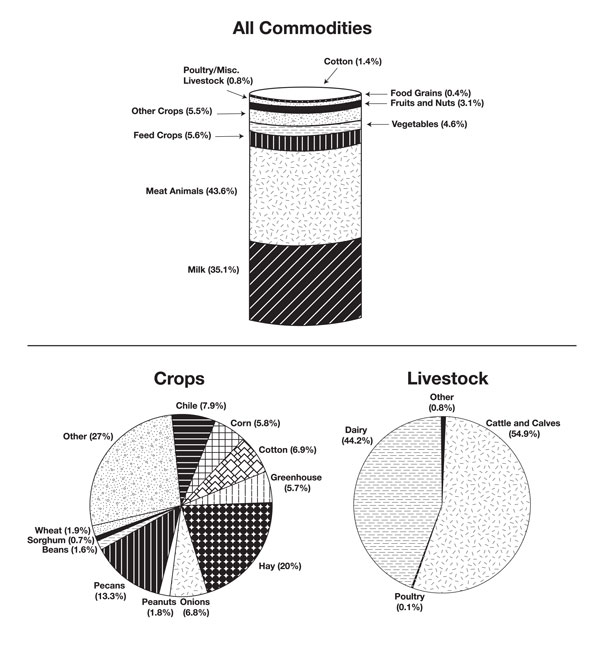
Figure 2. New Mexico cash receipts, all commodities, 2012.
Agriculture and Food Processing Contributions to New Mexico’s Economy
Agriculture and food processing have direct, indirect, and induced effects on New Mexico’s economy. For this analysis, an input/output model (IMPLANiii is used to calculate the indirect and induced effects of agriculture and food processing activities.
The direct contribution (direct effect) of agriculture and food processing to New Mexico’s economy is the value of production, the jobs and employee compensation it creates, and the local and state taxes generated.
The indirect effects include the economic impact of producers and their suppliers buying goods and services (inputs) from local (state of New Mexico) industries.
The induced effects occur through re-spending of income received by owners of the labor inputs (see endnotes section for additional information on indirect and induced effects).
In 2012, New Mexico agriculture and food processing produced $10.6 billion in output ($6.8 billion direct and $3.8 billion indirect and induced); created 50,886 jobs (32,578 direct and 18,308 indirect and induced); and generated $1.47 billion in employee compensation ($376.5 million direct and $1.1 billion indirect and induced), $23 million in personal income taxes ($11 million direct and $12 million indirect and induced), $40 million in corporate income taxes ($7 million direct and $33 million indirect and induced), and $460 million in indirect business taxes ($132 million direct and $328 million indirect and induced).
New Mexico Agriculture and Food Processing: Future Opportunities
When compared to national statistics, New Mexico is below average in processing and utilizing its agricultural output (Ramirez and Crawford, 2005). An overwhelming majority of New Mexico’s agricultural and processed food products find their way to markets outside the state. According to NMDA (2010), 99% of New Mexico’s cattle are sent out of state for processing. Ninety-seven percent of New Mexico’s agricultural products leave the state, but the state in turn imports more than $4 billion in food products annually (NMDA, 2010).
The proximity of many producers to New Mexico’s population centers provides a significant opportunity to increase sales to meet the growing consumer demand for locally produced agricultural products. In 2010, over $13 million in New Mexico agricultural products were sold directly to consumers (via farmers’ markets and other venues). According to NMDA (2010), if New Mexico consumers increased their purchases of food from local farmers and ranchers by 15%, over $375 million in direct farm income would be generatediv. The total income (direct, indirect, and induced) associated with these added purchases would contribute $725 million per year in outputs and wealth for New Mexico communities (NMDA, 2010).
The benefits of expanded consumer-oriented agriculture and food processing are readily apparent. However, such expansions face a number of substantial hurdles. Not least of these are government policy and private sector investments that will improve the state’s agricultural infrastructure and services. These include financing to implement new technologies to lengthen production seasons and food storage facilities to ensure reliable supplies to wholesale and retail customers. Also needed are improved collaboration, networking, and distribution mechanisms that currently limit opportunities for connecting local producers and consumers to wholesale and retail outlets.
State and Regional Impacts of Agriculture and Food Processing
Agricultural production’s total impact4 is about 7.4% of New Mexico gross domestic product (GDP)5. Food processing’s total impact adds another 5.7% to New Mexico’s GDP. According to our IMPLAN analysis, agricultural production ranked 3rd in total statewide impact and food processing ranked 11th in total statewide impact.
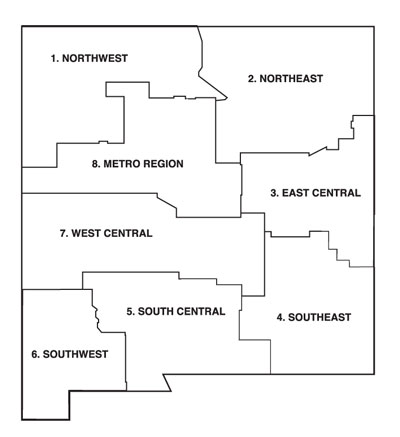
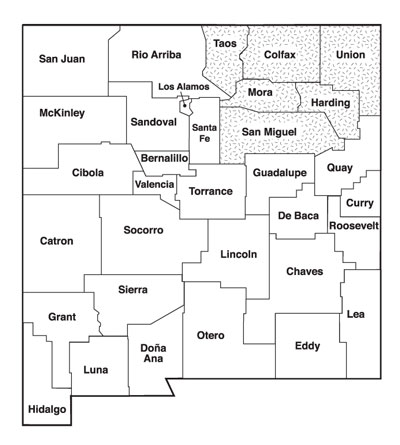
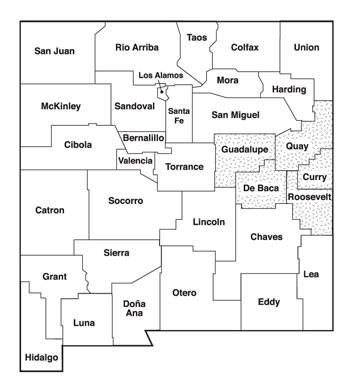
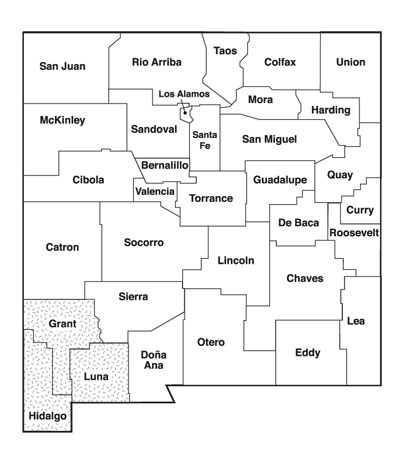
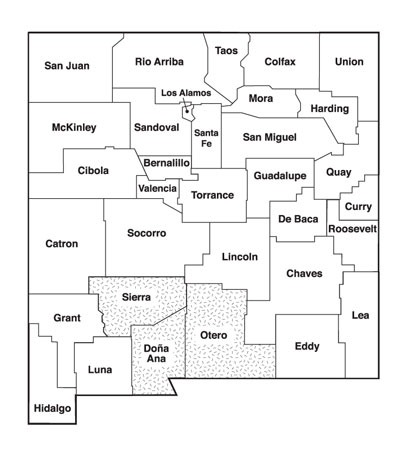
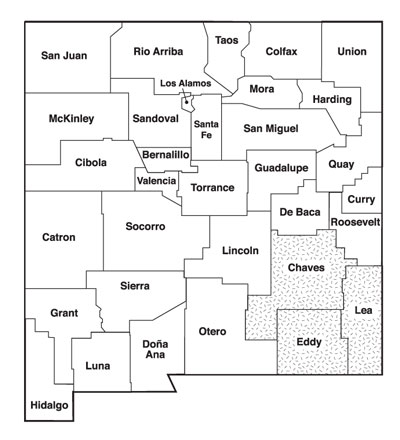
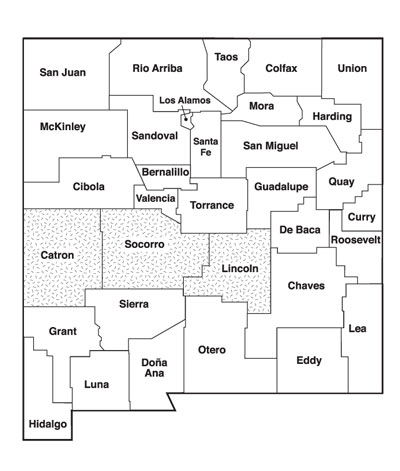
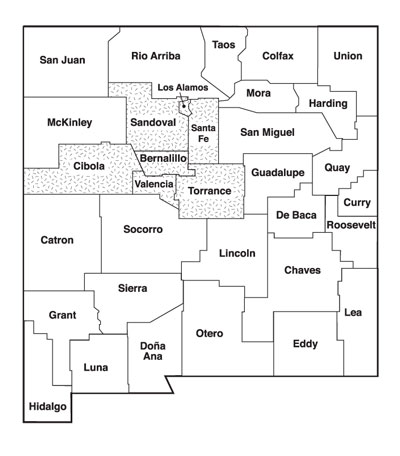
For this report, eight regions of the state (each containing from three to six counties) were examinedv (Figure 3). The total impact of agriculture in each of the eight regions ranged from $224 million to $1.66 billion. In three of the regions, the total impact from agriculture makes it the number one sector in the region. The three regions on the east side of the state accounted for 83% of the state’s total agricultural impact. Agriculture ranked 5th or higher for six of the eight regions, with only two regions (the Northwest and Metro regions) ranked lower than 5th.
Food processing has a higher total value than agricultural production in two of the eight regions (the Southwest and Metro regions). The Metro region, which includes Bernalillo County, is the biggest food processing region in the state. However, even with nearly half of all the state’s food processing, the sector ranks only 25th in importance to the Metro economy. In two regions (East Central and Southwest), food processing is the second most important sector. However, only in the Southwest region is food processing’s impact larger than agricultural production.
|
STATE OF NEW MEXICO |
DIR. EMPL. IMPACT |
TOT. EMPL. IMPACT |
OUTPUT DIRECT $ IMPACT |
OUTPUT TOTAL $ IMPACT |
$ RANK |
|
State & Local Govt. Education |
98,311 |
160,598 |
5,574,507,324 |
9,106,339,439 |
1 |
|
Scientific R&D Services |
32,155 |
56,251 |
4,970,488,281 |
8,695,228,758 |
2 |
|
AG PRODUCTION |
26,924 |
41,961 |
3,881,871,821 |
6,008,285,299 |
3 |
|
State & Local Govt. |
62,164 |
101,535 |
3,664,326,416 |
5,985,103,474 |
4 |
|
Food & Drinking Places |
69,146 |
106,238 |
3,712,477,783 |
5,703,955,481 |
5 |
|
Federal Govt. Non-military |
29,545 |
48,746 |
3,288,753,662 |
5,426,083,042 |
6 |
|
Construction – |
26,475 |
43,310 |
3,209,204,102 |
5,249,951,667 |
7 |
|
Petroleum Refineries |
604 |
665 |
4,326,457,031 |
4,759,017,299 |
8 |
|
Banking, Credit Unions |
9,236 |
15,940 |
2,751,842,285 |
4,749,509,082 |
9 |
|
Wholesale Businesses |
25,637 |
38,226 |
3,167,260,254 |
4,722,592,393 |
10 |
|
FOOD PROCESSING |
5,654 |
8,925 |
2,888,843,602 |
4,635,452,275 |
11 |
|
1. NORTHWEST |
DIR. EMPL. IMPACT |
TOT. EMPL. IMPACT |
OUTPUT DIRECT $ IMPACT |
OUTPUT TOTAL $ IMPACT |
$ RANK |
|
Petroleum Refineries |
213 |
227 |
1,514,066,040 |
1,618,193,104 |
1 |
|
Oil & Natural Gas Extraction |
3,292 |
4,396 |
672,063,782 |
897,328,597 |
2 |
|
State & Local Govt. Education |
12,579 |
18,746 |
665,946,899 |
992,491,552 |
3 |
|
Electricity Generation, Transmission & Distribution |
1,270 |
1,500 |
653,704,346 |
772,166,034 |
4 |
|
Support for Oil & Gas Ops. |
2,436 |
3,438 |
458,677,429 |
647,379,687 |
6 |
|
Wholesale Businesses |
4,450 |
5,824 |
456,078,583 |
597,035,083 |
7 |
|
Food & Drinking Places |
7,195 |
9,810 |
373,729,706 |
509,566,019 |
8 |
|
Construction – |
2,882 |
4,052 |
357,830,597 |
503,059,684 |
9 |
|
Hospitals – Private |
2,633 |
3,860 |
352,323,730 |
516,595,684 |
10 |
|
AG PRODUCTION |
4,523 |
6,671 |
270,370,665 |
396,766,874 |
13 |
|
FOOD PROCESSING |
91 |
116 |
32,309,966 |
40,725,693 |
63 |
|
2. NORTHEAST |
DIR. EMPL. IMPACT |
TOT. EMPL. IMPACT |
OUTPUT DIRECT $ IMPACT |
OUTPUT TOTAL $ IMPACT |
$ RANK |
|
AG PRODUCTION |
2,413 |
3,624 |
421,826,080 |
643,777,146 |
1 |
|
State & Local Govt. Education |
5,131 |
7,507 |
274,399,078 |
401,444,631 |
2 |
|
Mining Gold, Silver |
401 |
460 |
240,289,139 |
275,913,553 |
4 |
|
State & Local Govt. |
2,602 |
3,799 |
139,370,163 |
203,538,578 |
5 |
|
Food & Drinking Places |
2,699 |
3,629 |
144,613,434 |
194,423,302 |
6 |
|
Banking, Credit Unions |
412 |
627 |
119,851,807 |
182,554,958 |
7 |
|
Hospitals – Private |
944 |
1,354 |
116,459,961 |
167,152,237 |
8 |
|
Health Services – |
1,281 |
1,871 |
110,637,115 |
161,564,530 |
9 |
|
Construction – |
1,076 |
1,421 |
111,619,621 |
147,405,351 |
10 |
|
FOOD PROCESSING |
38 |
48 |
27,139,555 |
32,939,418 |
39 |
|
3. EAST CENTRAL |
DIR. EMPL. IMPACT |
TOT. EMPL. IMPACT |
OUTPUT DIRECT $ IMPACT |
OUTPUT TOTAL $ |
$ RANK |
|
AG PRODUCTION |
3,906 |
5,396 |
934,627,904 |
1,309,814,598 |
1 |
|
FOOD PROCESSING |
757 |
1,219 |
517,217,038 |
838,138,919 |
2 |
|
Federal Govt. Military |
3,325 |
4,398 |
494,559,692 |
654,100,491 |
3 |
|
State & Local Govt. Education |
4,429 |
6,353 |
229,376,236 |
328,975,393 |
4 |
|
Rail Transport |
456 |
638 |
145,506,287 |
203,533,634 |
6 |
|
Food & Drinking Places |
2,715 |
3,624 |
137,187,393 |
183,122,544 |
7 |
|
Banking, Credit Unions |
413 |
612 |
120,942,459 |
179,087,187 |
8 |
|
Oil & Natural Gas Extraction |
1,027 |
1,204 |
137,688,232 |
161,476,759 |
9 |
|
State & Local Govt. |
1,684 |
2,415 |
90,673,416 |
130,031,583 |
10 |
|
4. SOUTHEAST |
DIR. EMPL. IMPACT |
TOT. EMPL. IMPACT |
OUTPUT DIRECT $ IMPACT |
OUTPUT TOTAL $ |
$ RANK |
|
Petroleum Refineries |
382 |
410 |
2,730,044,678 |
2,926,911,625 |
1 |
|
Oil & Natural Gas Extraction |
6,560 |
8,838 |
1,522,124,023 |
2,050,731,367 |
2 |
|
Support for Oil & Gas Ops. |
6,145 |
8,844 |
1,151,085,938 |
1,656,527,202 |
3 |
|
AG PRODUCTION |
2,993 |
4,052 |
840,845,110 |
1,155,862,850 |
4 |
|
FOOD PROCESSING |
1,064 |
1,697 |
662,629,536 |
1,103,669,315 |
5 |
|
State & Local Govt. Education |
6,666 |
9,859 |
375,766,296 |
555,735,496 |
7 |
|
Construction – |
2,666 |
3,833 |
337,676,331 |
485,468,480 |
8 |
|
Banking, Credit Unions |
1,025 |
1,611 |
305,533,936 |
480,375,437 |
9 |
|
Oil & Natural Gas Extraction |
1,152 |
1,361 |
393,381,653 |
464,874,284 |
10 |
|
5. SOUTH CENTRAL |
DIR. EMPL. IMPACT |
TOT. EMPL. IMPACT |
OUTPUT DIRECT $ IMPACT |
OUTPUT TOTAL $ |
$ RANK |
|
Federal Govt. Non-military |
7,255 |
11,066 |
848,863,831 |
1,294,796,767 |
1 |
|
State & Local Govt. Education |
15,410 |
23,229 |
844,259,521 |
1,272,617,206 |
2 |
|
Federal Govt. Military |
4,769 |
6,511 |
679,694,885 |
927,966,124 |
3 |
|
AG PRODUCTION |
4,272 |
5,748 |
614,514,662 |
841,347,200 |
5 |
|
FOOD PROCESSING |
1,031 |
1,498 |
490,915,594 |
732,678,159 |
6 |
|
Health Services – |
3,838 |
5,881 |
387,642,883 |
594,104,010 |
7 |
|
Hospitals – Private |
3,173 |
4,716 |
372,887,024 |
554,114,572 |
8 |
|
Food & Drinking Places |
7,549 |
10,385 |
398,321,655 |
547,909,010 |
9 |
|
Construction – New Non-residential |
3,224 |
4,610 |
361,664,886 |
517,233,008 |
10 |
|
6. SOUTHWEST |
DIR. EMPL. IMPACT |
TOT. EMPL. IMPACT |
OUTPUT DIRECT $ IMPACT |
OUTPUT TOTAL $ IMPACT |
$ RANK |
|
Mining Copper, Nickel, Lead & Zinc |
812 |
943 |
462,385,437 |
536,997,265 |
1 |
|
FOOD PROCESSING |
788 |
985 |
319,036,178 |
397,158,146 |
2 |
|
AG PRODUCTION |
1,479 |
2,030 |
191,553,707 |
266,152,617 |
3 |
|
Federal Govt. Non-military |
1,427 |
1,979 |
173,526,825 |
240,659,833 |
4 |
|
State & Local Govt. Education |
3,230 |
4,424 |
167,991,974 |
230,095,381 |
5 |
|
Mining Gold, Silver & Other Metals |
194 |
229 |
115,569,824 |
136,761,918 |
6 |
|
State & Local Govt. |
2,133 |
2,920 |
113,867,386 |
155,869,252 |
7 |
|
Health Services – Non-hospitals |
818 |
1,123 |
77,588,142 |
106,513,220 |
8 |
|
Food & Drinking Places |
1,511 |
1,944 |
74,544,815 |
95,882,208 |
9 |
|
Banking, Credit Unions |
223 |
317 |
64,771,721 |
91,944,700 |
10 |
|
7. WEST CENTRAL |
DIR. EMPL. IMPACT |
TOT. EMPL. IMPACT |
OUTPUT DIRECT $ IMPACT |
OUTPUT TOTAL $ IMPACT |
$ RANK |
|
AG PRODUCTION |
1,071 |
1,495 |
156,385,284 |
224,808,919 |
1 |
|
State & Local Govt. Education |
2,758 |
3,948 |
148,973,419 |
213,205,939 |
2 |
|
Food & |
1,771 |
2,339 |
93,220,711 |
123,150,244 |
3 |
|
Banking, Credit Unions |
229 |
363 |
66,644,142 |
105,823,214 |
4 |
|
Real Estate |
1,002 |
1,117 |
89,645,615 |
99,936,943 |
5 |
|
State & Local Govt. |
1,133 |
1,623 |
65,433,678 |
93,742,686 |
6 |
|
Scientific R&D Services |
501 |
735 |
59,897,583 |
87,808,627 |
7 |
|
Construction – |
560 |
726 |
57,064,083 |
73,902,126 |
8 |
|
Federal Govt. |
532 |
763 |
46,592,064 |
66,769,168 |
9 |
|
Hospitals – Private |
329 |
474 |
44,778,191 |
64,412,632 |
10 |
|
FOOD PROCESSING |
23 |
28 |
5,181,815 |
6,121,411 |
71 |
|
8. METRO REGION |
DIR. EMPL. IMPACT |
TOT. EMPL. IMPACT |
OUTPUT DIRECT $ IMPACT |
OUTPUT TOTAL $ IMPACT |
$ |
|
Scientific R&D Services |
29,683 |
55,483 |
4,650,383,789 |
8,692,377,779 |
1 |
|
State & Local Govt. Education |
48,107 |
82,604 |
2,867,794,189 |
4,924,243,333 |
2 |
|
Semiconductors & Related Manufacturing |
4,080 |
6,128 |
2,813,451,416 |
4,225,781,340 |
4 |
|
State & Local Govt. |
38,591 |
66,221 |
2,367,196,777 |
4,061,985,962 |
5 |
|
Food & Drinking Places |
39,389 |
63,745 |
2,164,564,209 |
3,503,033,881 |
6 |
|
Construction – |
14,673 |
25,886 |
1,829,187,988 |
3,227,112,940 |
7 |
|
Wholesale Businesses |
15,502 |
24,577 |
2,033,204,102 |
3,223,592,622 |
8 |
|
Telecommunications |
5,794 |
9,460 |
1,907,824,951 |
3,114,909,638 |
9 |
|
Federal Govt. Non-military |
14,987 |
25,972 |
1,714,665,161 |
2,971,448,107 |
10 |
|
FOOD PROCESSING |
1,850 |
2,848 |
832,137,129 |
1,237,654,407 |
25 |
|
AG PRODUCTION |
4,624 |
7,424 |
401,713,926 |
649,162,266 |
48 |
Figure 3. Value and employment impacts of agricultural production and food processing in eight sub-state regions, 2012.
Conclusion
New Mexico is a net exporter of food products grown in our state but processed elsewhere. Exports are good for the economy, but when we export commodities that might be viably processed here in New Mexico, we lose the opportunity to add value to our production and to add jobs and income to the state. As the 3rd and 11th ranked sectors in the New Mexico economy, agriculture and food processing account for approximately 7% and 6% of the state’s GDP, respectively.
An additional and potentially far greater opportunity for both of these sectors is the expansion of locally produced and processed consumer-oriented food products. There is a wide variety of crops that consumers have come to expect to find in retail outlets (in particular, tomatoes, cucumbers, and leafy vegetables) that could bevilocally produced. Any expansion of food products produced year-round on New Mexico farms represents a significant opportunity to increase economic activity and jobs in the state.
References
Hoppe, R., J. MacDonald, and P. Korb. 2010. Small farms in the United States: Persistence under pressure [USDA Economic Information Bulletin No. 63]. http://www.ers.usda.gov/media/147007/eib63_1_.pdf
Jensen, M. 2012. 10 vegetable crops you should consider. https://www.greenhousegrower.com/vegetables/10-vegetable-crops-you-should-consider/
New Mexico Department of Agriculture. 2010. http:// brendanmiller.com/NMgreen/NMGreenformywebsite/www.edd.state.nm.us/greenEconomy/overview/ cleanEnergyEconomyAction.pdf
Ramirez, O.A., and T. Crawford. 2005. Impact of the New Mexico agricultural sector on the state’s economic and social well-being. Presentation to Middle Rio Grande Council of Governments, Albuquerque,
November 4, 2005.
USDA–NASS. 2012. 2012 census publications. https://www.agcensus.usda.gov/Publications/2012/Full_Report/Census_by_State/New_Mexico/index.asp
Washington State Employment Security Department, Labor Market & Economic Analysis Branch. n.d. Agricultural services. https://govinfo.askcarlos.com/wastate/wslmia/specialreports/industry-profiles
Foot Notes
1This overall discussion is focused on two broad industries: agriculture and food processing (e.g., cheese from milk). In some instances the data for the two are combined, and where this occurs is clearly noted in the text.(back to top)
2Gross state product is a measurement of the economic output of a state. It is the sum of all value added by industries within the state and serves as a counterpart
to the gross domestic product at the national level.(back to top)
3 These figures include all jobs, including self employment and part-time.(back to top)
4 “Total impact” is composed of the direct, indirect, and induced impacts.(back to top)
5 The state’s gross domestic product (GDP) is defined as the total value of goods and services produced within the state.(back to top)
End Notes
i “Agricultural services sector is comprised of a wide array of services sold to farm-oriented enterprises and to non-farm final consumers. These farm-oriented services are essentially intermediate activities, providing inputs for agricultural production. These service activities take on various forms; for example, an agricultural service occurs when a firm provides soil preparation services for a farming enterprise, when a company performs crop planting, cultivating and harvesting services, when a veterinary provides services for livestock, or when a firm provides temporary labor on a contract basis to farms during production or harvesting, or even providing management expertise for farming enterprises. Although these examples hint at the variety of services captured by the industry, they do not convey the sheer number of activities performed by ‘non-farm’ agricultural services. Such services include veterinary services for pets and other animal specialties (e.g., non-livestock), landscape architectural and planning services, lawn and garden services, and ornamental shrub and tree services.” (Washington State Employment Security Department, n.d.; p. 1) (back to top)
ii “Ninety-one percent of U.S. farms are classified as small—gross cash farm income (GCFI) of less than $250,000. About 60 percent of these small farms are very small, generating GCFI of less than $10,000. These very small noncommercial farms, in some respects, exist independently of the farm economy because their operators rely heavily on off-farm income. The remaining small farms—small commercial farms—account for most small-farm production.” (Hoppe et al., 2010; p. i)(back to top)
iii The IMPLAN system is an input/output model currently used by government agencies, colleges and universities, non-profit organizations, corporations, and business development and planning organizations. The model measures the relationship between a given set of demands for final goods and the inputs required to satisfy those demands.
Terms used here that are common to input/output models include:
Direct Effect – The value of production, the jobs and employee compensation an industrial sector creates, and the local and state taxes it generates.
Indirect Effect – Industries producing goods and services for consumption purchase goods and services from other producers. These other producers in turn purchase goods and services. These indirect purchases (indirect effects) continue until leakages from the region in the form of imports, wages, and profits exhaust the cycle.
Induced Effect – This is the change in production as a result of spending by households as income increases or decreases due to changes in production (direct effect) and jobs and income are created or lost as a consequence of those changes.
For a complete description of the IMPLAN model visit www.implan.com.(back to top)
iv This assumes that producers develop new capacity and products that are not currently being produced for local markets (or being produced but exported). Turning exports into local sales will produce little if any net gain. (back to top)
v The regional approach is a way to refine and improve the quality of the results. The counties that comprise the state of New Mexico are far from being a set of homogeneous economic units. A case in point is the results for the whole state. These are far more representative of the most developed counties than of the more rural counties.
It is impossible to create sub-state regions that are truly economically homogeneous. However, the regions developed for this impact analysis have the effect of isolating sets of relatively highly linked counties (economically speaking) from others with which they have little in common. In some instances those linkages are evolved from practical considerations, such as access (highways and driving times), as much as the result of industrial similarities.
Whatever the case, the impact results for each sub-region provide far more accurate, plausible, and usable results for each sub-state region’s counties than if the state results were applied to all counties.(back to top)
vi Small-, medium-, and large-scale greenhouse production of crops sometimes produced locally and normally imported during winter months represents a substantial departure from traditional New Mexico agriculture. However, certain specialty products, such as leafy greens, microgreens, cucumbers, tomatoes, peppers, herbs, green beans, Swiss chard, squash, raspberries, and strawberries, all have significant market potential as locally produced fruits and vegetables in conventional retail outlets, restaurants, and, of course, farmers’ markets (Jensen, 2012).(back to top)

Joel Diemer is a Professor and Extension Economic Development Specialist in the Department of Agricultural Economics and Agricultural Business at NMSU. His research and Extension programs focus on regional economic development and strategic planning.
To find more resources for your business, home, or family, visit the College of Agricultural, Consumer and Environmental Sciences on the World Wide Web at pubs.nmsu.edu
Contents of publications may be freely reproduced for educational purposes. All other rights reserved. For permission to use publications for other purposes, contact pubs@nmsu.edu or the authors listed on the publication.
New Mexico State University is an equal opportunity/affirmative action employer and educator. NMSU and the U.S. Department of Agriculture cooperating.
December 2014