Circular 633
Victor E. Cabrera, Mark A. Marsalis, Leonard Lauriault
College of Agricultural, Consumer and Environmental Sciences, New Mexico State University
Authors: Respectively Extension Dairy Specialist and Extension Agronomist, Agricultural Science Center at Clovis, and Forage Agronomist, Agricultural Science Center at Tucumcari, all of New Mexico State University. (Print Friendly PDF)
Introduction
Alfalfa (Medicago sativa L.) is the leading cash crop (>$185 million/year) in the state of New Mexico and is grown on more than 250,000 acres (NM Agricultural Statistics, 2006). It is likely that interest in and planting of alfalfa will increase across the state as rapid dairy industry expansion continues to dictate which crops will be grown in a particular area. Due to its excellent nutritive value, alfalfa is highly sought after by dairies for mixing into feed rations. There is a constant need for current and reliable management information about alfalfa production, and increasing interest in growing the crop efficiently with a reduction in resource use. Yield prediction is difficult—not only from one year to the next but also between cuttings in a given year. Being able to estimate yields by simple, physical methods is one step in improving overall understanding of field potential and input efficiency. The purpose of this publication is to describe the Alfalfa Yield Predictor, a computer model that predicts alfalfa yields based on user-input parameters such as fall dormancy rating, cutting (or general time of year), plant height at time of cutting, growing degree days (GDD), and rainfall, even under irrigation. All of these parameters may be valuable tools for assessing potential alfalfa yields in New Mexico. It is our hope that this publication will assist producers, consultants, New Mexico Cooperative Extension Service personnel, and government personnel by providing a fast, user-friendly application for estimating alfalfa yields.
Materials and Methods
The Alfalfa Yield Predictor was developed from a four-year (1998–2001) dataset generated from a study conducted at the New Mexico State University Agricultural Science Center at Tucumcari, New Mexico (35.20� N, 103.68� W; elev. 4086 ft). Alfalfa was sown at 20 lb/ac on 30 April 1997 into a Canez fine sandy loam soil. All seed was uniformly inoculated before planting with a product including Sinorhizobium meliloti and Rhizobium leguminosarum biovar trifolii. Fall dormancy (FD) categories of alfalfa ranged from 2 to 9 and the following varieties were used: Viking I, representing FD 2; DK 127, Garst 645, and Rainier, representing FD 3; Jade II and Landmark, representing FD 4; Archer and Baralfa 54, representing FD 5; Tahoe and Wilson, representing FD 6; Do�a Ana and Helena 7000, representing FD 7; 13R Supreme and WL 525HQ, representing FD 8; and Salado and WL 612, representing FD 9 (Alfalfa Council, 1999).
Irrigation was furrow applied. Irrigation water was delivered through gated pipe into furrows spaced 3 ft apart for sufficient duration to completely wet the area between furrows. Irrigation and fertility were adequate throughout the collection period.
Harvests were scheduled when the first flower was observed and were executed often within 5 days, before any plot reached 10% bloom but after all plots had reached bud stage. Dry matter yields leaving a 3-in. stubble were measured five times during May through September, based on first flower, and near the end of October, allowing a 6-week fall rest prior to anticipated first fall temperature of 24°F (Bootsma and Suzuki, 1985; Sholar et al., 1983, 1988). Natural height of alfalfa was measured just prior to each harvest as described by Field et al. (1986) and Rhodes and Collins (1993).
Weather data were collected from a National Weather Service station located within 1 mi of the study area. Growing-degree-days (GDD, base temperature 41°F; Sanderson et al., 1994; Sharratt et al., 1989) were calculated for each harvest, beginning after the last spring temperature of 41°F or less and ending between the final harvest and the first fall temperature of 41°F or less (Sholar et al., 1983, 1988). The beginning and ending temperature of 41°F was used because alfalfa can initiate growth at this lower temperature (Sharratt et al., 1989) and continues to remain green throughout the winter at this latitude (Sholar et al., 1983).
Alfalfa Yield Predictor Application
The Alfalfa Yield Predictor (Figure 1) is a query application that retrieves actual measured records according to user-input requests. The application retrieves all of the records that satisfy requested criteria. The application presents a histogram, an exceedance curve and all relevant statistics for a selection.
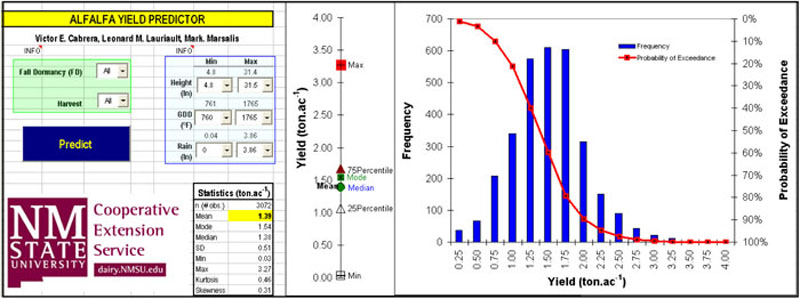
Figure 1. The Alfalfa Yield Predictor
The field trial dataset has 3,072 records, from which the application filters the data according to user selections of FD, cutting, height, GDD, and rainfall. For FD and harvest, users can make selections from drop boxes. Users can specify an FD of 2 to 9 and 1 to 6 cuttings corresponding to May through October harvest dates. It is possible to select All for these two parameters, meaning that all records on that parameter will be used to calculate the predicted yield. In the cases of height, GDD, and rainfall, the user needs to select a range between a minimum and a maximum value for each of these parameters. The minimum and the maximum values in the subset selected are presented above the drop box menus as a reference. The box menus have predefined values that the user can select. It is also possible for the user to enter values directly into the drop boxes.
After entering information for these five parameters, the user can click a button to predict the yields. The application will then select the appropriate records and display the results in the same screen where the selections were made. The application by default, at first opening, displays the results from a broad selection, including all FDs, all cuttings, and all minimum and maximum values found for height, GDD, and rainfall. Also at first opening, the application shows the statistics and distribution of the 3,072 records measured in the field trial. Users can custom-tailor these estimates to their specific situations. For each prediction, the statistics will show how many field records were used for the calculations.
We insisted on presenting probabilistic results in order to provide the user with a more complete picture of all the information, to better suit the decision-making process. Probabilistic results help users to make better decisions according to their risk aversion characteristics. For example, for a selection of FD = 6 and harvest = 4, there will be 64 records with an average of 1.59 tons/ac. However, the minimum value could be as low as 1.24 tons/ac and the maximum as high as 2.00 tons/ac. Additional information presented through the exceedance curve allows the user to make these extra decisions. If the user's goal is to produce at least 1.25 tons/ac, the curve indicates that it is a reachable goal; the yield is expected to fall short in only 3% of cases. Similarly, if the user wants to know the probability of producing 1.75 tons/ac or more, the application will respond to that question immediately, indicating that a 1.75 tons/ac yield or more will occur in one of every seven harvests (14% of the time = 100 – 86%).
We assert that we are not using mathematical equations to predict alfalfa yields. We are presenting all the measured yield variability obtained under field conditions defined by the parameters selected in the application. When smaller ranges are selected for the parameters, fewer observations are returned. If the selection is too specific, there is a possibility of obtaining invalid results. If the selection is too narrow to obtain any record, the application will present a message informing the user of this.
Results and Discussion
This section shows some outcomes obtained using the Alfalfa Yield Predictor. The purpose of showing these results is twofold. First, it summarizes the yields of alfalfa during four years of experiments according to fall dormancy, harvest timing, height, growing degree days, and rainfall. Second, it provides a reference for the application user.
Overall alfalfa yield for all FDs was 1.39 ton/ac (Figure 2—All). The SD for all data was 0.51 ton/acl; the minimum registered yield was 0.03 ton/ac; and the maximum was 3.27 ton/ac. The mean value was higher than the median, and the distribution was slightly skewed to the right. Five percent of the yields were 2.25 ton/ac or higher and ten percent of the yields were 0.75 ton/ac or lower. Yield increased together with fall dormancy until FDs 6 and 7 (Figure 2), after which it decreased again. The average yields for FD 6 and for FD 7 were exactly the same (1.46 ton/ac); however, the SD was slightly higher for FD 6, and the maximum value was also lower for FD 6 (2.90 versus 3.00 ton/ac).
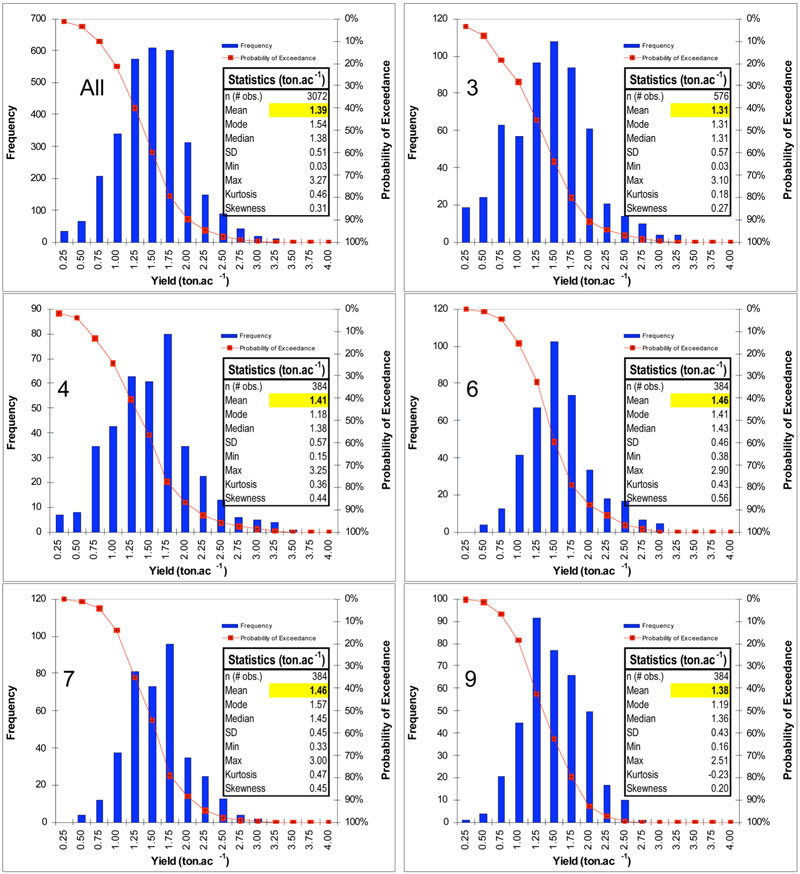
Figure 2. Alfalfa yield distributions for All and for fall dormancies (FD) 3, 4, 6, 7, and 9.
The application indicated that higher alfalfa yields are to be expected during third harvest (1.61 ton/ac) (Figure 3), although harvests 2 to 4 are very comparable (≥1.55 ton/ac). However, harvest 2 has higher probabilities of obtaining yields above 2.00 ton/ac than do harvests 3 and 4, indicated by their less steep probability of exceedance curves. Harvests 5 and 6 are expected to be substantially lower than the others (1.21 and 0.83 ton/ac, respectively). Notice that the curves vary greatly among harvests. With the exception of harvest 4, all other distributions had negative kurtosis, indicating a flattened distribution around the mean, that is, a low probably of having many extreme values at most harvests. Even though harvest 4 showed positive kurtosis, the fourth cutting will not necessarily have a greater chance of extremes, as indicated by a large number of observations (>200) around the mean. Harvests 4 to 6 have negative skewness, suggesting that the distribution has a large proportion of scores grouped on the low end (left tail); this could mean that with later harvests in the season there is a greater chance of obtaining lower yields.
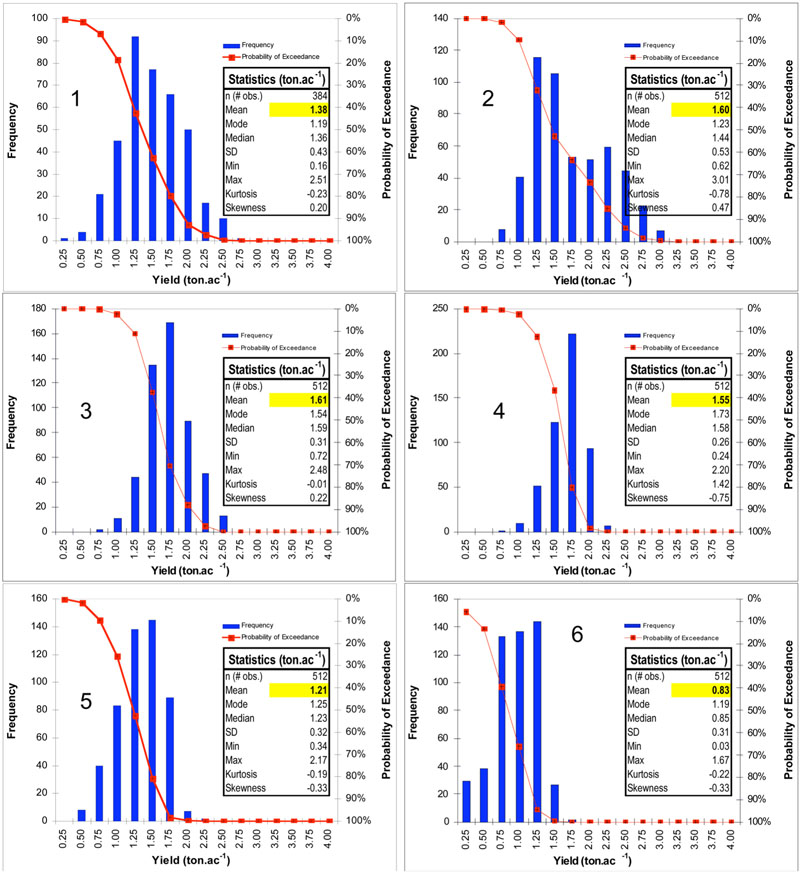
Figure 3. Alfalfa yield distributions for harvest 1 through harvest 6.
Regarding height of plants before harvesting—as expected, taller heights were associated with higher yields, from a mean of 0.30 ton/ac for heights 10 in. or lower to a mean yield of 1.91 ton/ac for heights above 30 in. (Figure 4). Yields for heights 10 in. or lower had only a 16% probability of being higher than 0.50 ton/ac, whereas yields for heights above 30 had a 91% probability of being at most 2.25 ton/ac. In similar fashion, yields were directly impacted by growing degree days (GDD); higher yields are expected for greater GDD accumulated (Figure 5). Whereas with 980�F GDD or less there is a 94% chance of having yields lower than 1.75 ton/ac, with 1,500�F GDD or greater there is only a 9% chance of having yields lower than 1.50 ton/ac.
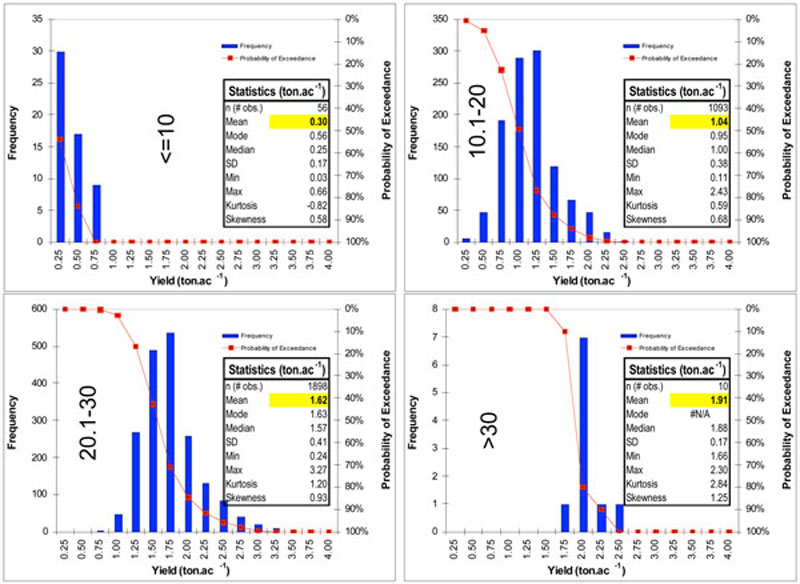
Figure 4. Alfalfa yield distributions for different height ranges: ≤10, 10.1-20, 20.1-30, and >30 in.
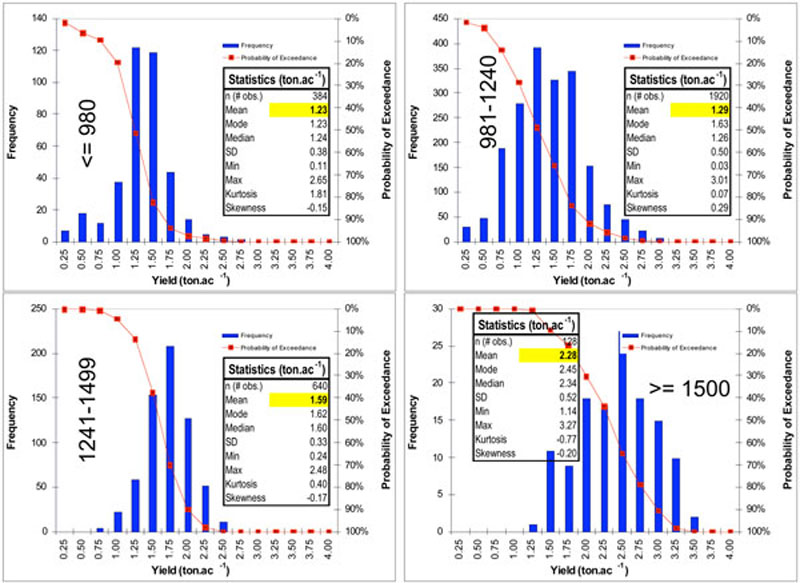
Figure 5. Alfalfa yield distributions for different growing degree days: ≤ 980, 981-1240, 1241-1499, and ≥ 1500 °F.
Conclusions
The Alfalfa Yield Predictor can be openly and freely downloaded at https://dairy.nmsu.edu: Tools. It is a spreadsheet containing macros that need to be enabled at first use. A document covering the specifics of downloading and using the application (user-guide) is also available at the same website or through the New Mexico State University College of Agricultural, Consumer and Environmental Sciences publications and videos page (https://pubs.nmsu.edu/_a/) as Guide A-333, User Manual of the Alfalfa Yield Predictor.
The Alfalfa Yield Predictor is a database query application that retrieves information on demand with respect to user selections. The purpose of the application is to provide alfalfa producers, crop advisers, Extension agents, and other interested stakeholders a user-friendly computer application for the anticipation of yields according to determined parameters of fall dormancy, harvest, standing crop height, growing degree days, and rain. In contrast to other applications, the Alfalfa Yield Predictor provides not one average yield as a result of a query but a whole distribution of yields for better decision-making.
The Alfalfa Yield Predictor can also play a role as an application model to be applied under different environmental conditions or to other crops or livestock farm activities.
Acknowledgements
The authors thank Dr. Garry Lacefield, Extension Forage Specialist at the University of Kentucky, for encouraging the development of this information system.
References
Alfalfa Council. 1999. Fall dormancy and pest resistance ratings for alfalfa varieties, 1999/00 edition. Davis, CA: The Alfalfa Seed Council.
Bootsma, A. and M. Suzuki. 1985. Critical autumn harvest period for alfalfa in the Atlantic region based on growing degree-days. Can. J. Plant Sci. 65:573-580.
Field, L., B. Melton, and C. Currier. 1986. Fall growth of alfalfa and cultivar adaptation. Res. Rep. 595. New Mexico State Univ. Agric. Exp. Stn., Las Cruces, NM.
New Mexico Agricultural Statistics Service. 2006. New Mexico Agricultural Statistics—2006. Las Cruces, NM: USDA—NM Dept. of Agric.
Rhodes, I., and R.P. Collins, 1993. Canopy Structure. In A. Davies, R.D. Baker, D.A. Grant, and A.S. Laidlaw (ed.). Sward Measurement Handbook, 2nd Ed. Reading, England: The British Grassland Society.
Sanderson, M.A., T.P. Karnezos, and A.G. Matches. 1994. Morphological development of alfalfa as a function of growing degree days. J. Prod. Agric. 7:239-242.
Sharratt, B.S., C.C. Sheaffer, and D.G. Baker. 1989. Base temperature for the application of the growing-degree-day model to field-grown alfalfa. Field Crops Res. 21:95-102.
Sholar, J.R., J.L. Caddel, J.F. Stritzke, and R.C. Berberet. 1983. Fall harvest management of alfalfa in the Southern Plains. Agron. J. 75:619-622.
Sholar, J.R., J.F. Stritzke, J.L. Caddell, and R.C. Berberet. 1988. Response of four alfalfa cultivars to fall harvesting in the Southern Plains. J. Prod. Agric. 1:266–270.
To find more resources for your business, home, or family, visit the College of Agricultural, Consumer and Environmental Sciences on the World Wide Web at pubs.nmsu.edu.
Contents of publications may be freely reproduced for educational purposes. All other rights reserved. For permission to use publications for other purposes, contact pubs@nmsu.edu or the authors listed on the publication.
New Mexico State University is an equal opportunity/affirmative action employer and educator. NMSU and the U.S. Department of Agriculture cooperating.
Printed and electronically distributed December 2007, Las Cruces, NM.