Guide B-831
Casey Spackman
College of Agricultural, Consumer and Environmental Sciences, New Mexico State University
Authors: Assistant Professor and Extension Range Management Specialist, Extension Animal Sciences and Natural Resources, New Mexico State University. (Print Friendly PDF)
Introduction
The Rangeland Data Analysis and Records (RaDAR) program is an innovative, web-based platform designed to facilitate the analysis and summarization of rangeland monitoring data. Utilizing the Rapid Assessment Methodology (RAM), RaDAR transforms raw field data into streamlined reports that provide critical insights into rangeland conditions. These reports offer detailed information on ground cover proportions, plant species composition, vegetation stubble heights, production estimates, stocking rates, and animal presence from fecal pellet counts. Additionally, the platform has the capacity to upload monitoring site photos that can be used as a visually appealing supplement to the report. As an account-based system, RaDAR allows users to securely store, access, and compare multiple reports. This platform serves as a centralized location for information on planning and making informed rangeland management decisions.
Getting Started
The website can be accessed on any internet-connected device via web browser by visiting https://rangelandradar.app/. To ensure a secure and private location for personal data, the website requires an account, only accessible to the account holder. To begin, navigate to the ‘login’ page by selecting the menu at the top-right corner of the homepage, then ‘Login’ at the bottom. A prompt will appear requiring an email address and password (Figure 1). If this is the first time visiting the site, select ‘create a new account’ and follow the prompts. A delay may occur before access can be obtained as authorization from the administrator is required for all new accounts.
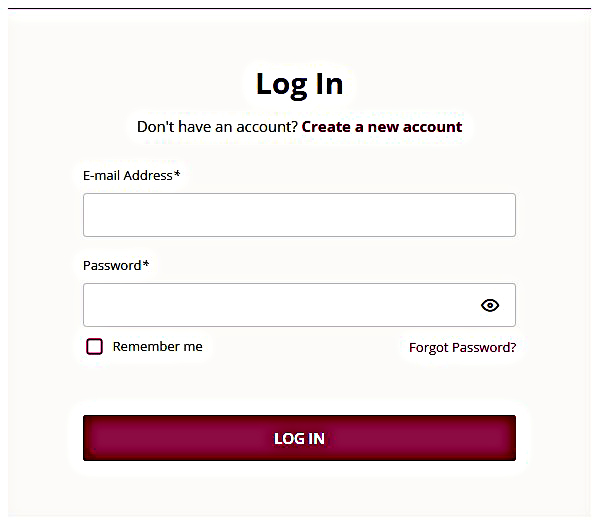 Figure 1. Login screen on RaDAR website.
Entering Data
Data must have been collected using the Rapid Assessment Methodology (RAM) first. Instructions for using RAM can be found at https://pubs.nmsu.edu/_ritf/RITF88/index.html with a blank datasheet provided in the appendix.
Website data entry follows the same format as the datasheet. To begin entering collected data, select ‘Create New Report’ in the top-right corner of the webpage and go through the following five steps.
- Name report. The name entered will be how the report can be found and reviewed or revised later (Figure 2). Select ‘Next’ to continue with data entry. Alternatively, all drafts and final reports can be found by selecting the account icon in the top right corner and selecting the Report Listing Page.
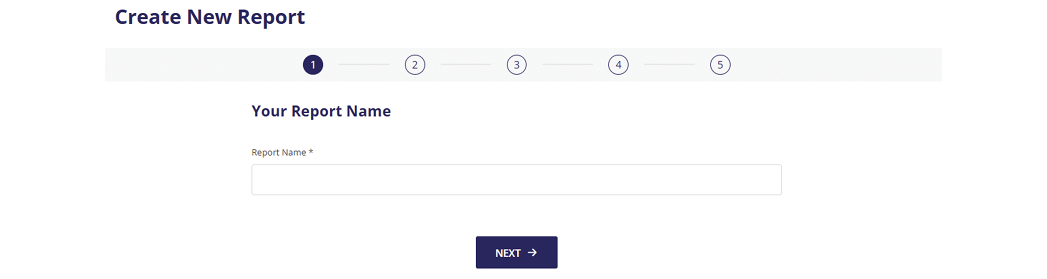
Figure 2. Create New Report screen, prompting users to name the report.
- Add Basic Information. This information corresponds to the top section of the RAM datasheet and is key for future reference and report identification (Figure 3).
- Producer Name: The name can be a person, ranch, or allotment but is not required.
- Pasture Name: If a pasture is not available, the name of the area, meadow, or canyon can be use. The name is to help identify where the assessment took place and used to locate the assessment location for future monitoring. This entry is required to continue.
- Date of Survey: The date is important for additional assessments to be taken. To compare multiple reports, all assessments need to be taken around the same time. This entry is required to continue.
- Collector Name: Although this entry is not required, it helps to identify if any anomalies that may occur from different collectors and if additional training is needed.
- Transect Number: This information is only required if multiple transects were taken from the same area or pasture. A transect is the line or path by which observations or readings were taken.
- Pasture Size: Pasture size is required and is used to estimate stocking rate. For a more accurate stocking rate estimate, reductions based on slope and distance from water (grazable acres) are strongly encouraged.
- GPS Coordinates: The information supplements Pasture Name and helps to easily find the assessment starting point for additional monitoring. It is not required to continue with data entry.
- Heading: This is the direction in which the transect was taken with every 90 degrees representing a cardinal direction (e.g. North 0°, East 90°, South 180°, and West 270°). In order to compare multiple records of the same timeframe and assessment location, the same transect needs to be used. Thus, a heading direction assists in repeatability of the assessment.
- Once the required information is entered, select SAVE TO DRAFT or NEXT to move to the next step of data entry.
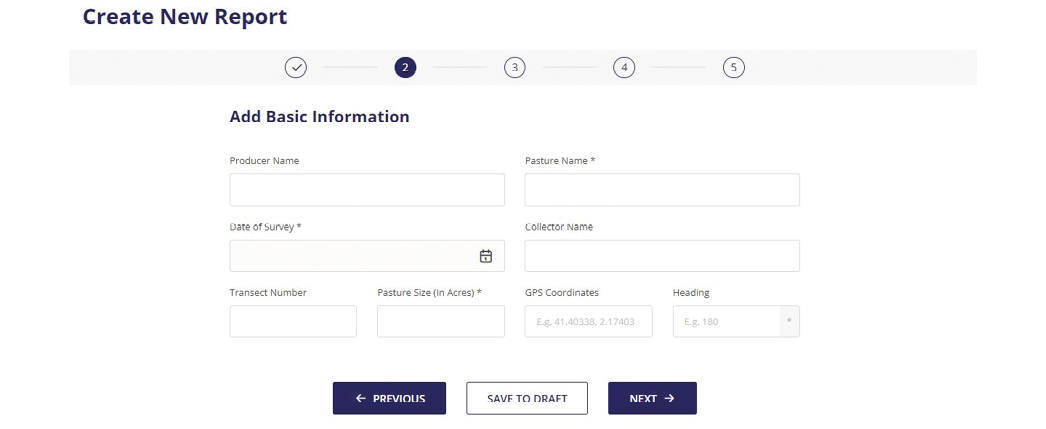
Figure 3. Basic information screen.
- Add Land Records. Each assessment reading is called a ‘Hit’. These correspond to the RAM datasheet measurement section. Each row contains 10 hits for a total of 100 readings. A minimum of 50 hits need to be recorded in order to proceed to step 4 and generate a report Figure 4).
- Hit 1-10: Add Land Cover Name, Height, Species 1 (grass only), and Species 2 (optional; non-grass). If a species is not listed for Species 1, reach out to the administrator to have it added. Additional species for Species 2 can be added by the user. Type the plant abbreviation (symbol), select ‘Add New Species’, and follow the prompts.
- Select Save to move to next Hit. After Hit 10 a new row will appear, and the process continues until at least 50 Hits have been recorded. If a new row fails to appear, select ‘Add New Row’ to continue.
- Once a sufficient number of entries have occurred, the selection ‘Save to Draft’ or ‘Next’ will become available to proceed.
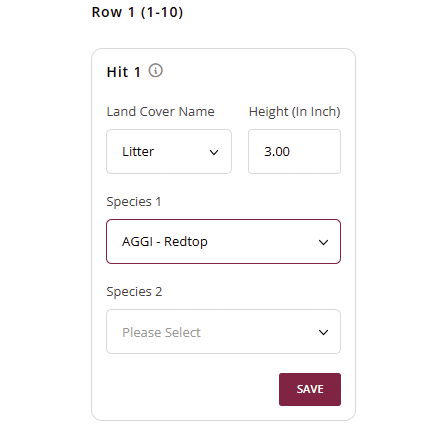
Figure 4. Demonstrating land record ‘Hits’.
- Upload Image. Both a landscape and ground level photo are required. A landscape photo is a picture taken down the length of the transect, while a ground photo is taken from above, parallel to the ground, looking down. These photos help to corroborate the transect data and are an excellent visual representation of changes over time. Photos must be less than 4 MB in size and in a JPEG, PNG, or GIF format. Once uploaded, you can resize the image for the report. Once completed, select ‘Next’ to continue (Figure 5).
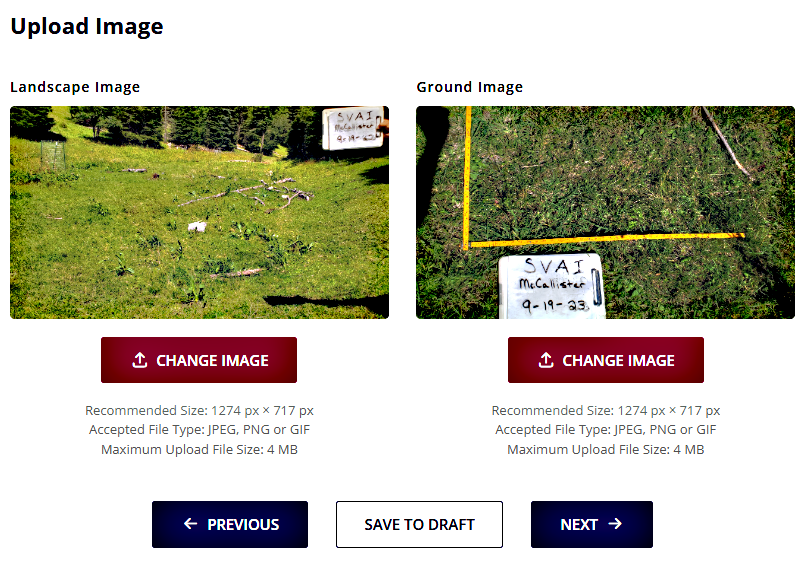 Figure 5. Upload Image example.
 - Add Other Information. Additional assessments such as Dot Tally or fecal counts, and Measurement Comments can be added to the report. Vegetation clippings can occur any time of year along the transect (n=5), while clippings within cages (n=3) only occurs at the end of the growing season. Entering a known Sampling Hoop or quadrant conversion size is required and is used to calculate forage production. Sampling sizes and conversions can be found at https://pubs.nmsu.edu/_b/B829/index.html. Enter dried clip and cage weights (grams) in the space provided (Figure 6). Once the required information is entered, select ‘Save to Draft’ or ‘Generate Report’.
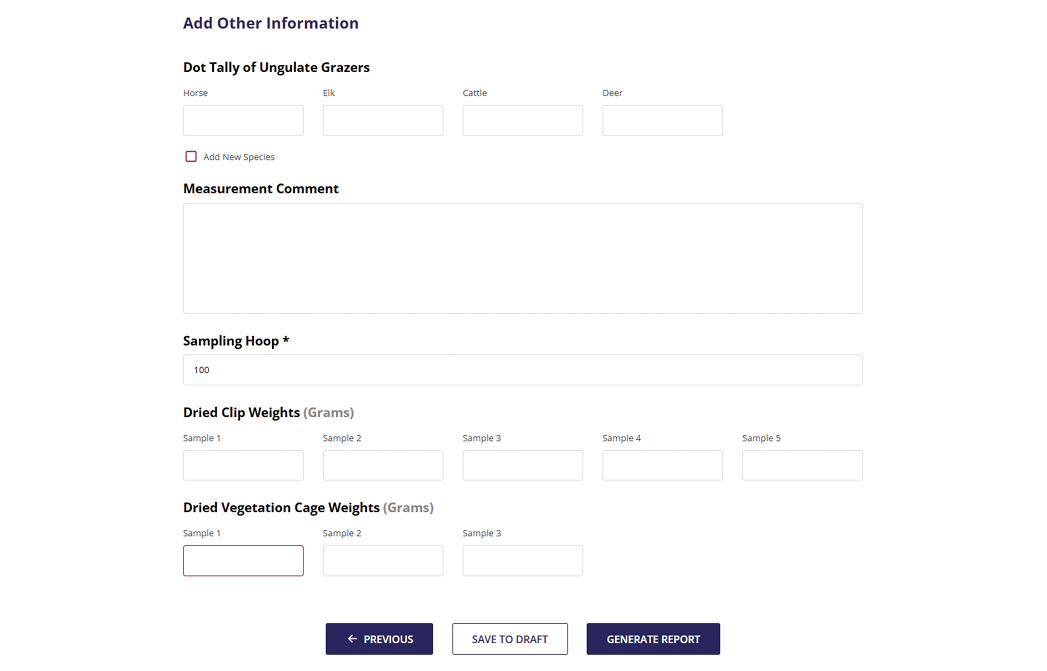
Figure 6. ‘Add Other Information’ screen showing additional options that can be added to the report.
- A congratulations screen will appear once the report has been generated (Figure 7). It can be viewed or downloaded immediately by selecting ‘View Report’ or ‘Download PDF’. Additionally, selecting ‘Go To My Reports’ allows you to view all reports, including the new report that has been created on the account (Figure 8).
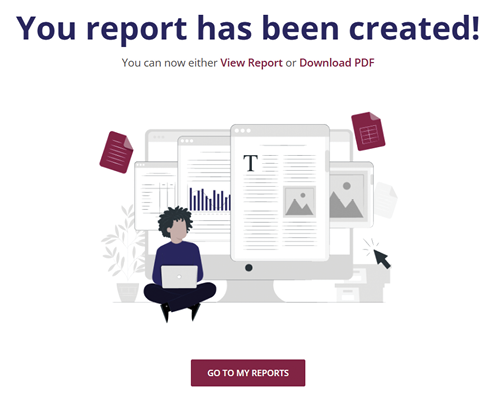
Figure 7. Congratulations screen.
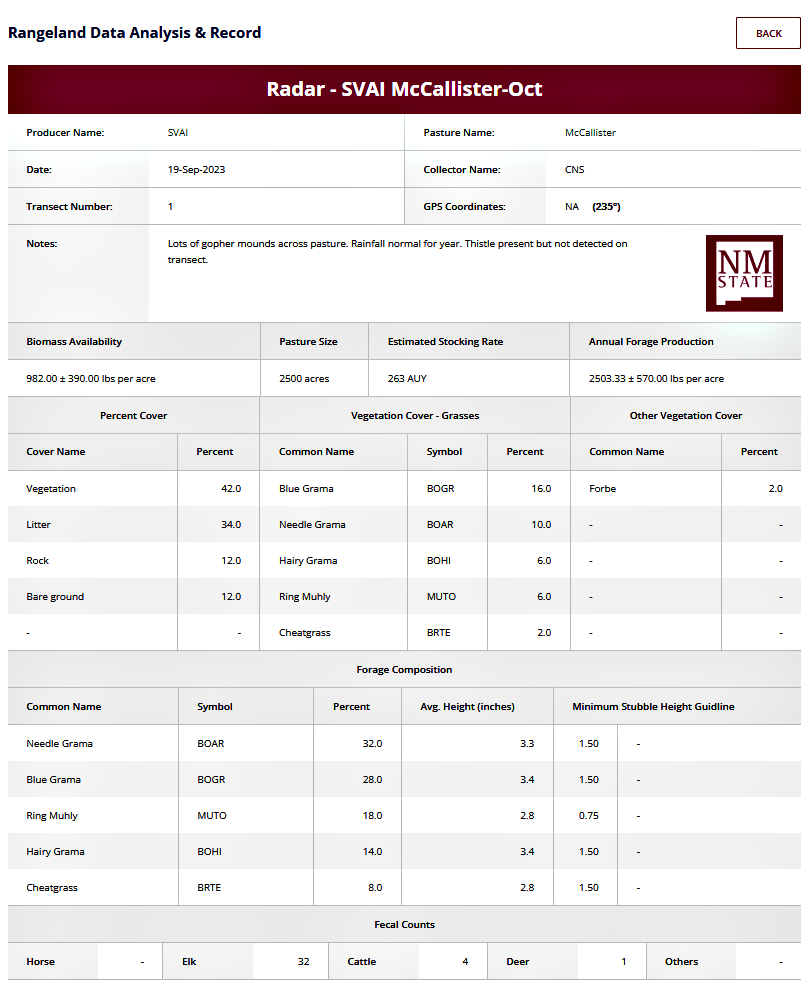
Figure 8. Final report.
Report Interpretation
The created report provides several insights into different aspects of natural resource conditions and management planning. This section will help to explain the report and the information within.
- Basic Information.
- Ranch or producer name, pasture name, transect number, and GPS Coordinates assist in knowing what area was sampled (spatial reference) and where to return for future assessments. It also allows for accurate spatial analysis or identification of specific areas within the landscape that exhibit certain characteristics in need of attention.
- The date lets the land manager know what was occurring during that specific time (temporal reference). Conditions can be dramatically different during different times of the year, so it is important to document when the monitoring took place. Additionally, when multiple years of data are available, a comparative analysis can be done (trends) to determine if changes have occurred and help develop long-term management strategies. Basic information with date allows for repeat assessments from the same location and time (replication).
- The collector names help keep a record of who assisted with the assessment, their expertise, and inform data integrity. It also helps with consistency in monitoring when the same person assesses the same transect.
- The notes section allows for the person monitoring to make other observations that may be of importance. This can help to make general assumptions of any additional changes that may be occurring such as rodents, invasive species, or erosion issues not directly assessed on transect.
- Production Information.
- Biomass Availability (also called standing crop) is the amount of vegetation, expressed as a weight per area in grams, present during a given point in time. This is the average weight of forage that was clipped and collected along the transect (n=5). It can be used as a grazing intensity guide, inform whether stocking rate is appropriate, or be an indicator of possible animal distribution issues. At the end of the growing season, it can also be used in conjunction with annual production to calculate percent utilization. Utilization can be used as a guide for targeted grazing intensities and make adjustments to grazing duration or distribution. In arid to semi-arid regions of the Southwest, a conservative use (< 40 percent) is recommended to maintain forage conditions.
- Pasture Size is used to calculate stocking rates. It is important to make adjustments to the pasture size depending on slope and distance from water for livestock. This is called grazable acres and will more accurately estimate stocking rate. As distance from water or slope increases, grazable acres decreases. Only use the greatest reduction rather than a combined reduction. More information on grazable acres and stocking rates can be found at https://pubs.nmsu.edu/_b/B829/index.html.
- Estimated Stocking Rate is the maximum amount of livestock that the land can support for a given amount of time to sustain forage conditions. The calculation is based on a 40% use allocation over a full year (animal unit year; AUY). It is a maximum stocking rate estimate and may require adjustments based on professional expertise.
- Annual Forage Production is plant material collected from grazing exclusion cages, expressed as a weight per area in grams, and used to assess forage production for an entire year. This is an estimate of what the land can produce without grazing.
- Cover.
- Percent Cover is the proportion of the ground surface that is covered by vegetation, litter, rocks, bare soil, or other attributes. It is used to assess distribution and composition of different material covering the ground. Percent cover provides valuable information about vegetation density, potential erosion, and likelihood of plant matter being incorporated into the soil. These attributes are slow to change and allow land managers to make long-term decisions regarding rangeland conditions or the need to improve an area. For example, when the bare ground percentages are in excess of 50 percent, erosion potential increases. Management should focus on increasing or sustaining vegetation and litter percentages to prevent deleterious soil conditions.
- Vegetation Cover – Grasses is the percentage of grasses (grazing forage) by common name and scientific abbreviation (symbol), calculated from the amount of vegetation cover readings along the transect. The percentage gives the land manager know species composition, biodiversity, and available forage. Changes in composition can be used as an indicator of grazing impact and vegetation trends over time.
- Other Vegetation Cover is the percentage of vegetation that are not grasses calculated from vegetation cover readings along the transect. Similar to vegetation cover-grasses, the percentage also can be used to assess range conditions and be used for land management decisions.
- Forage Composition.
- The percentage of grass species found along the transect, no matter if a vegetation hit was observed (nearest plant method). It provides a better inventory of grasses compared to vegetation cover estimates, as it takes into consideration all transect hits rather than just those of vegetation cover hits. Further, it better identifies the specific combination and distribution of different species and helps assess the relative forage biodiversity within the plant community. Species are listed by their common name, scientific abbreviation (symbol), percent, with the addition of height and their minimum height grazing guideline.
- Fecal Counts
- Are used to estimate and monitor relative presence or absence of animals. It is not used to assess animal abundance but can be used generally as an indicator of increases or decreases in animal visitations to a site.
- Photos
- Are used as a qualitative assessment and support the numeric information. They can be used as an illustrative record of the conditions that occurred at a given point in time. Ground photos when accompanied with a scaled ruler can be used to quantify cover or species composition but are limited unless multiple ground photos are taken. Landscape photos can be used to demonstrate grazing intensity and correlated to the quantitative data.
Conclusion
The Rangeland Data Analysis and Records (RaDAR) program is a robust platform for managing and interpreting rangeland monitoring data. From account setup to entering field data, RaDAR ensures that users can securely store and manage their monitoring information with ease. Additionally, the reports provide users with critical insights into common rangeland conditions empowering them to make informed decisions, essential for sustainable rangeland management. By utilizing this tool and the guidance provided within this document, users can fully leverage the capabilities of RaDAR to enhance their land management strategies and practices.
Casey Spackman is an Assistant Professor and Extension Range Management Specialist at New Mexico State University. He earned his Ph.D. at Utah State University. His Extension efforts aim to assist producers, land managers, and agency personnel in monitoring and developing management objectives that maintain or improve natural resource health and sustainability.
Brand names appearing in publications are for product identification purposes only. No endorsement is intended, nor is criticism implied of similar products not mentioned. Persons using such products assume responsibility for their use in accordance with current label directions of the manufacturer.
To find more resources for your business, home, or family, visit the College of Agricultural, Consumer and Environmental Sciences on the World Wide Web at pubs.nmsu.edu.
Contents of publications may be freely reproduced, with an appropriate citation, for educational purposes. All other rights reserved. For permission to use publications for other purposes, contact pubs@nmsu.edu or the authors listed on the publication.
New Mexico State University is an equal opportunity employer and educator. NMSU and the U.S. Department of Agriculture cooperating.
March 2025 Las Cruces, NM