Guide B-723
Jason L. Turner, Bailey A. Young, and Christy Petry-Adams
College of Agricultural, Consumer and Environmental Sciences
Authors: Respectively, Professor and Extension Horse Specialist, Extension Animal Sciences & Natural Resources, New Mexico State University; Assistant Professor, Department of Agricultural Sciences, West Texas A&M University; and Clinical Assistant Professor, Department of Agricultural Sciences, West Texas A&M University. (Print Friendly PDF)
In memory of Jason L. Turner, who was an excellent professor and horse specialist with a great passion for teaching others.
Introduction
While there are many ways to define drought,1 Merriam-Webster’s Dictionary defines it as “a period of dryness especially when prolonged; specifically, one that causes extensive damage to crops or prevents their successful growth.”2 As a temporary condition, drought differs from an arid climate which has the permanent feature of low annual precipitation. The climate for New Mexico is characterized as semi-arid to arid,3 and owners are familiar with the challenges of caring for livestock under these conditions where some areas of the state can experience a “dry spell” in any given year.
The purpose of this guide is to aid horse owners by: (1) directing them to tools needed to assess drought conditions, (2) guiding them to resources that can help them develop their own drought management plans, and (3) providing some options for adjusting management of horses under drought conditions, especially those periods of extreme drought. These options are meant to provide ideas for management practices to help mitigate the effects of the drought and they may, or may not, be feasible for all equine operations.
Tools to Assess Drought Conditions
Unlike other natural disasters, drought is one that can be monitored, planned for, and mitigated by appropriate management plans. At the local level, there are several factors that can be monitored to identify the likelihood of an oncoming drought. These include precipitation patterns, pasture and range forage availability, irrigation water allotments, etc. It is important that horse owners stay abreast of these conditions, so they can be proactive in implementing drought management plans. There are many online tools available that can be helpful in this respect, and a few of them are described below.
|
Table 1. US Drought Monitor Categories and description of conditions. |
|
|---|---|
|
Category |
Description |
|
D0 |
Abnormally Dry |
|
D1 |
Moderate Drought |
|
D2 |
Severe Drought |
|
D3 |
Extreme Drought |
|
D4 |
Exceptional Drought |
|
Source: U.S. Drought Monitor.4 |
|
The U.S. Drought Monitor4 provides a consistent overview of drought conditions across the country at a specific point in time. In simple terms, this tool shows “where we are today” in terms of drought. This monitor uses the classifications described in Table 1 to characterize and report drought conditions at the national, state, and county level. Figure 1 illustrates the occurrence and severity of D2 to D4 drought conditions in New Mexico from 2000 to 2025. Clearly, severe drought conditions are a frequent occurrence in New Mexico and a drought management plan is essential for addressing this repeated challenge.
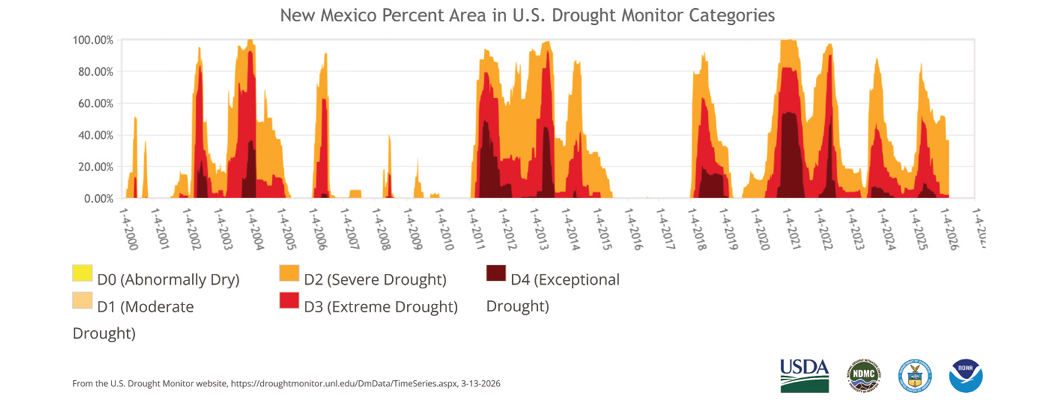
Figure 1. The percentage of New Mexico experiencing D2 to D4 drought conditions from 2000 to 2025. Source: U.S. Drought Monitor.4 The U.S. Drought Monitor is jointly produced by the National Drought Mitigation Center at the University of Nebraska-Lincoln, the United States Department of Agriculture, and the National Oceanic and Atmospheric Administration. Map courtesy of NDMC.
The Climate Prediction Center (CPC) of the National Weather Service (NWS) within the National Oceanic and Atmospheric Administration (NOAA) provides long range forecast maps for precipitation5 (Figure 2). This map provides an outlook (with probabilities) over the next three months, giving an idea of “where we might be headed” in terms of precipitation.
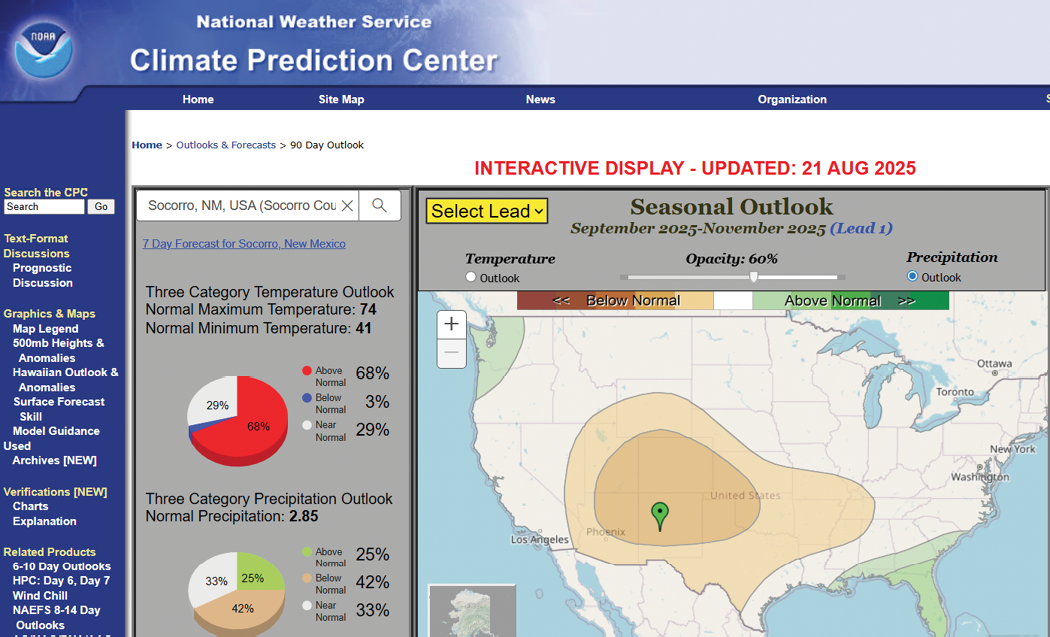
Figure 2. Long range forecast maps for precipitation from the Climate Prediction Center. Source: https://www.cpc.ncep.noaa.gov/products/predictions/long_range/interactive/index.php
Another useful resource for the desert Southwest is the “Grass-Cast” tool,6 which uses historical data on weather and vegetation growth with seasonal climate outlooks from the Climate Prediction Center to model the total vegetation production for a local area compared to its 36-year average. Grass-Cast does not recognize a difference between desirable forage species and undesirable species (e.g., weeds), so it is important that land managers monitor the land to determine the amount of desirable vegetation present. The model estimates Aboveground Net Primary Productivity (ANPP), which is a measure of new plant growth produced in a given area over a specific time period, using three categories of estimated precipitation: above normal, normal, and below normal. Figure 3 provides an example Grass-Cast map for New Mexico. This report can give an idea of “how much vegetation growth we might see” on the land for a specific time interval.
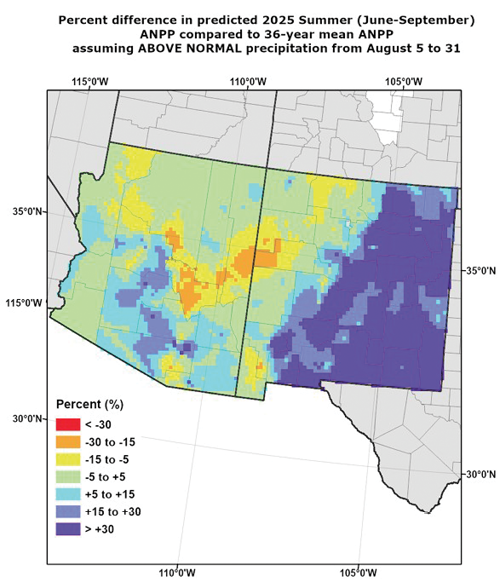
Figure 3a. An example map from a Grass-Cast forecast made on August 5, 2025. Source: https://grasscast.unl.edu/Outlook.aspx. For this scenario: "If precipitation between now and August 31st is above normal, we estimate that grassland production in your area this SUMMER (at lbs / acre of peak biomass on September 30th) will be ____% more or less than its 36-year average."
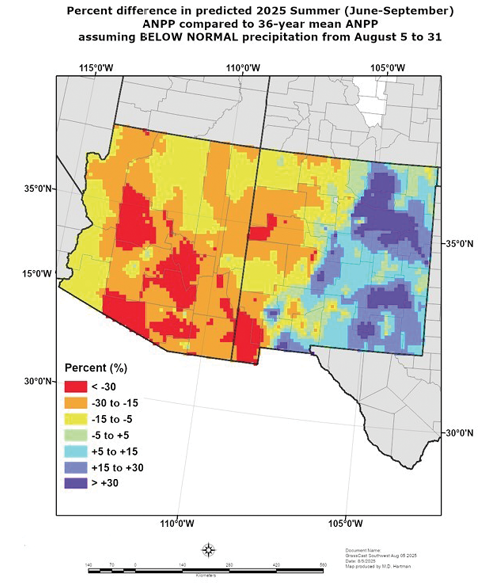
Figure 3b. An example map from a Grass-Cast forecast made on August 5, 2025. Source: https://grasscast.unl.edu/Outlook.aspx. For the 3 maps (scenarios): "If precipitation between now and August 31st is near normal, we estimate that grassland production in your area this SUMMER (at lbs / acre of peak biomass on September 30th) will be ____% more or less than its 36-year average."
Figure 3c. An example map from a Grass-Cast forecast made on August 5, 2025. Source: https://grasscast.unl.edu/Outlook.aspx. For the 3 maps (scenarios): "If precipitation between now and August 31st is below normal, we estimate that grassland production in your area this SUMMER (at lbs / acre of peak biomass on September 30th) will be ____% more or less than its 36-year average."
The U.S. Agricultural Commodities in Drought website7 combines data from the U.S. Drought Monitor and the National Agricultural Statistics Service Census of Agriculture to provide information about the percentage of growing area that is affected by drought for various agricultural commodities, such as hay. For the 2021 drought that impacted much of the Western United States, the map in Figure 4 shows the 35% of hay acreage in the U.S. that was impacted on June 15, 2021. This information can help owners, especially those that normally purchase their entire forage needs as hay, by allowing them to see which forage growing regions are in drought. Then, owners can review hay prices by state using the hay market reports8 provided by the Agricultural Marketing Service of the USDA to determine which areas have lower market prices for hay.
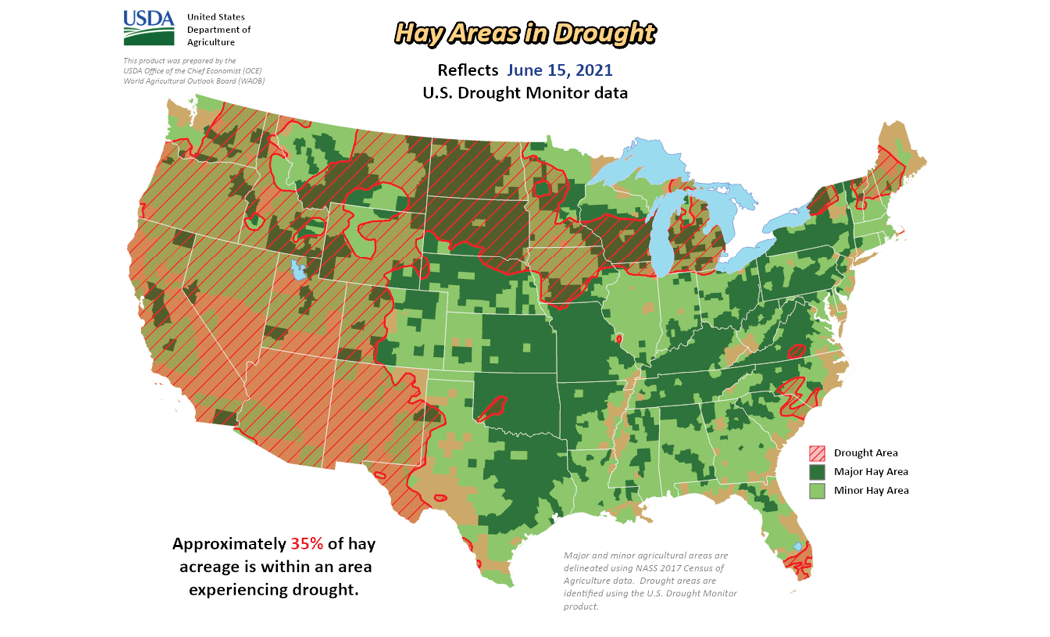
Figure 4. Hay growing regions of the United States experiencing drought conditions on June 15, 2021. Source: https://agindrought.unl.edu/Maps.aspx?2
Basics of a Drought Management Plan
The decisions that you make prior to, during, and after a drought have significant impact on the health and resiliency of your operation. A drought management plan should be tailored to your specific operation and locale. Developing a comprehensive drought management plan is outside the scope and purpose of this publication, but the National Drought Mitigation Center9 is an excellent resource to help you with step-by-step instructions for developing your own plan as well as providing sample plans to review.
One component of a drought management plan is central to our discussion. This is the concept of a “critical date” where you monitor specific conditions and compare them to predetermined “target points.” The critical date is specific for your operation and it may include such dates as: the opening of irrigation season, recorded precipitation for the month when planting of annual forage crops occur, or the amount of standing forage on the land on a set date. The target point is the threshold where a value for a specific measure below that mark will trigger some action or management decision from the plan.
Let’s use the following scenario as an example. You have a 20-mare breeding operation near Roswell. You have irrigated Bermuda grass pasture as the predominant forage resource on the farm. The normal growing season is May to September. In this case, your critical date may be June 30 with the target point being 75% of normal precipitation. On June 30, you go to the Western U.S. Climate Historical Summaries webpage10 to find the historical precipitation data for Roswell (Figure 5). You realize that precipitation for January to May is below 75% of this historical norm. Therefore, you take appropriate action based upon your management plan (see potential action steps below).
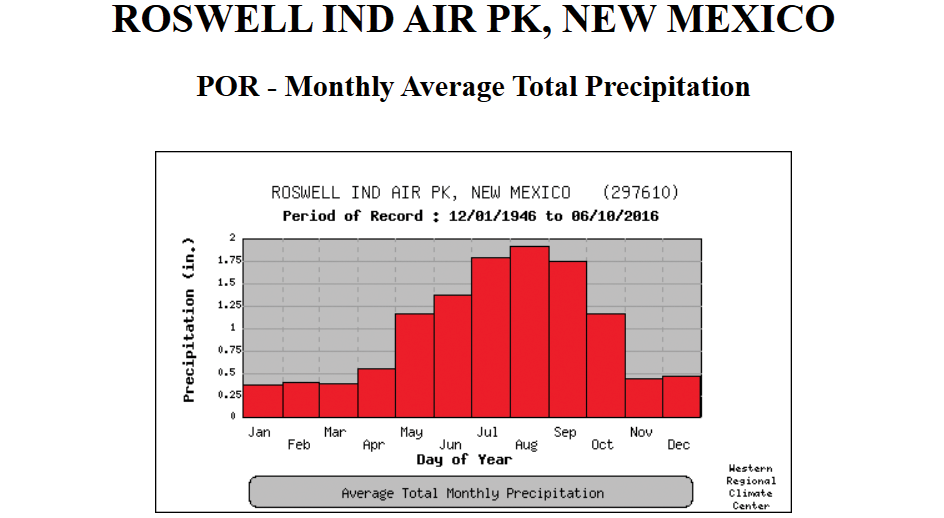
Figure 5. Monthly Average Total Precipitation for Roswell Industrial Air Park. Source: https://wrcc.dri.edu/cgi-bin/cliMAIN.pl?nm7610
Another example of a critical date and target point could be related to purchase of annual hay stores for the operation. Let’s say that you normally purchase your annual amount of hay on June 30. At this time, you find it difficult to find suitable hay or the spot market price has spiked to over 150% of normal. This may be cause to trigger implementation of the drought management plan and potential action steps. Still, another example may be that you are notified by your irrigation district on May 1 that this year’s allotment of irrigation water is less than 50% of normal.
As illustrated in the above examples, the critical date—target point—action step concept is at the heart of an effective drought management plan. Considerable time should be given to identifying how you will find and monitor this information as well as the specific action steps you will take in response to the defined target points.
Potential Action Steps for your Plan
Good management practices that minimize costs on the equine operation become increasingly important when drought conditions prevail as feed and forage prices increase. These include buying good quality forage in bulk quantities that can be moved with the equipment available and purchasing supplemental feed and/or grain in bulk quantities that can be used before the item spoils. Also, it is recommended to have a nutrient analysis11 conducted on feedstuffs to make the most efficient use of the hay purchased. This small investment (e.g., $20 to $40 per test) provides the best information to properly formulate the diets for your horses. This nutrient analysis can help owners accurately estimate the amount of forage needed for the horses on the farm; in turn, this can aid in decision-making when hay prices fluctuate during drought conditions. Hay price data for alfalfa hay and non-alfalfa hay was obtained from USDA and a simple comparison of average prices for “good” years and “bad” drought years was made (Table 2). A “good” year was where the yearly average for the percentage area of New Mexico in D2, D3, or D4 was below 10%. A “bad” year was where the yearly average for the percentage area of New Mexico in D3 and/or D4 was above 20%. Alfalfa hay prices in “bad” years increased about 15% over “good” years, and non-alfalfa hay prices in “bad” years increased about 8% over “good” years. Keep in mind these price data are adjusted for inflation and are averaged over all forms of hay (small squares, large squares, large rounds, etc.) for the entire year. This result may not necessarily reflect fluctuations in prices observed in the spot market when a specific hay grade (e.g., premium alfalfa), hay form (e.g., small squares), and small quantities (e.g., 1 ton of small squares) are sought for purchase. Therefore, employing some of the management practices described below may help offset the impact of increased hay costs.
|
Table 2. Comparison of annual price ($/ton) of alfalfa and non-alfalfa hay types for “good” and “bad” years with respect to drought conditions. |
|||
|---|---|---|---|
|
Hay Type |
“Good” Yeara |
“Bad” Yearb |
Percentage Increase |
|
Alfalfa |
$252.66 |
$291.16 |
15.24 |
|
Non-alfalfa |
$208.55 |
$226.30 |
8.51 |
|
aYears included: 2001, 2005, 2007-2010, 2015-2017 bYears included: 2002-2004, 2006, 2011-2013, 2018, 2020-2022 A “good” year was where the yearly average for the percentage area of New Mexico in D2, D3, or D4 was below 10%. A “bad” year was where the yearly average for the percentage area of New Mexico in D3 and/or D4 was above 20%. Source of data: US Drought Monitor4 and USDA National Agricultural Statistics Service. |
|||
Maximizing the efficient use of available forage
Matching the forage quality to the nutrient requirements of the horses being fed is a good place to start. Horses with high nutrient requirements (e.g., growing yearlings and lactating mares) can make good use of high-quality forages (e.g., premium alfalfa) to meet their overall nutrient requirements. However, horses with relatively low nutrient requirements (e.g., adult horses at maintenance) will likely gain body condition score (BCS), and perhaps become obese, when fed high-quality forage in an amount that meets their dry matter intake requirements (approximately 2% of body weight per day). Therefore, a better approach would be to feed adult horses at maintenance a good-quality grass hay, or a mixture of grass and alfalfa hay. In summary, you want to allocate the highest quality forage to the group of horses with the highest nutrient requirements.
Using a scale or weigh tape to estimate the weight of each individual horse being fed allows you to target the dry matter intake needed for that horse. Then, you can weigh the amount of feed and forage that needs to be fed to that horse so that you don’t provide more nutrients than the animal requires. Once you adopt weighing feedstuffs, this will also allow you the opportunity to use alternative feedstuffs in the diet which will be discussed later in this guide. Example methods to weigh feed and forage are shown in a couple of videos (Horse Owners Minute: Part 1 Weighing Feed and Part 2 Weighing Hay) listed on the ACES YouTube Channel (https://www.youtube.com/nmsuaces). If you have invested time in weighing forage, using hay feeding methods that minimize waste can enhance the efficient use of that forage. Guide B-721: Hay Feeding Management Strategies as Cost-control Measures on Horse Farms12 describes these different strategies.
If you have standing forage on the operation, you should employ practices that help sustain that forage for the future. Specifically, you should create a sacrifice area, where horses can be housed and fed, that prevents constant access of the horses to the pasture (or range) which can result in overgrazing and diminished health of the desirable forage. Using a sacrifice area will allow you to practice limit grazing (i.e., restrict horse grazing to only a few hours per day) and rotation of grazing between multiple pastures, moving animals when forage height drops below four to five inches. You should also monitor pastures (or range) for the presence of weeds and poisonous plants. It is important to address these conditions when found as the potential consumption of poisonous plants by horses generally increases in drought conditions; in turn, this can increase costs due to veterinary treatment and/or death loss. The publication, Managing Small Acreage Pastures During and After Drought13 provides more detailed recommendations on good pasture management practices.
Minimizing the nutrient requirements of horses on the farm
One of the simplest methods to decrease the overall amount of nutrients (and forage) required for the horse herd is to reduce the number of horses on the farm. This could be done by selling the horses with the least value to the operation, such as older, less productive broodmares, or selling young horses as weanlings rather than retaining them until they are yearlings or two-year-olds. Alternatively, seasoned competition horses (e.g., show, rodeo, etc.) that are not currently in competition could be leased or sold to others that wish to compete with them.
If selling or leasing are not viable options, then the owner can look at other possibilities. Table 3 shows the digestible energy and crude protein requirements for various classes of horses with an expected mature body weight of 1,100 pounds. The two righthand columns express these requirements as a percentage of the adult horse at maintenance requirement to illustrate the impact of metabolic processes (e.g., growth, exercise, and lactation) on nutrient needs. The following changes could be options to minimize the overall nutrient requirements on the farm during drought:
- Creep feeding foals with a high-quality diet, so that they can be weaned at 3 months of age instead of 4 or 6 months, is a more efficient use of nutrients than feeding the lactating broodmare for another 2 to 3 months.
- Choosing to leave mares “open” rather than rebreeding them will greatly reduce the nutrients required to bring them through another pregnancy and lactation period.
- Managing adult horses for maintenance rather than moderate work can reduce nutrient requirements by 40 to 50%.
- While BCS 5, the ribs cannot be seen, is often considered the optimum for non-pregnant animals, elite athletes (e.g., racehorses) in competition may be in the BCS 4 category where the last few ribs can be seen. For horses that are in a high BCS (7 to 9), they could be fed a less energy dense diet (or forage) to decrease BCS to a more desirable range over time. However, horses should not be starved to decrease energy intake as they still need to meet other nutrient requirements, and they will need to meet their dry matter intake requirement or they will develop annoying vices or other health problems. If there are several horses on the operation, it can be helpful to sort them into groups by age and BCS, so that they can be fed accordingly to maintain the desired BCS. The ACES YouTube Channel (https://www.youtube.com/nmsuaces) video, Horse Owners Minute: How to Body Condition Score Horses, provides more details on how to measure BCS in horses.
|
Table 3. Digestible Energy (DE) and Crude Protein (CP) Requirements for Different Classes of Horses with an Expected Mature Weight of 1100 pounds expressed in absolute values and as a percentage of the Requirement for an Adult Horse Under Maintenance Conditions. |
||||
|---|---|---|---|---|
|
Class of Horse |
DE (Mcal/d) |
CP (g/d) |
DE |
CP |
|
Weanling, |
13.3 |
669 |
87.5 |
123.9 |
|
Weanling, |
15.5 |
676 |
102.0 |
125.2 |
|
Yearling, |
18.8 |
846 |
123.7 |
156.7 |
|
Two-year-old, ~950 lbs. |
18.7 |
770 |
123.0 |
142.6 |
|
Adult, |
15.2 |
540 |
100.0 |
100.0 |
|
Pregnant mare, |
19.2 |
797 |
126.3 |
147.6 |
|
Lactating mare, 2nd month |
31.7 |
1530 |
208.6 |
283.3 |
|
Working adult horse, |
23.3 |
768 |
153.3 |
142.2 |
|
Source: Nutrient requirements of horses.19 |
||||
Using alternative roughage sources for horses
Generally, a mature 1100 lb. horse will be expected to voluntarily consume about 2% of its body weight (i.e., 22 lbs.) in dry matter feed intake per day. For growing horses, working horses, and late gestation or lactating broodmares with higher nutrient requirements, this intake might be 2.5 or 3%. The common recommendation is that a horse should receive a minimum of 0.75% to 1% of their body weight (8.25 to 11 lbs. of dry matter for 1100 lb. horse) per day in long-stem forage to minimize digestive upset and unwanted vices, such as cribbing and wood chewing. This range in intake provides the opportunity to consider using alternative roughage sources to substitute for some of the forage in the horse’s diet.
Forage is defined as plant matter (that is 18% or more crude fiber) consumed by animals by grazing or fed to them by harvesting as hay, silage, green chop, or straw. This also includes hay cubes, wafers, and pellets. Roughage is a non-forage feed (that is 18% or more crude fiber) that is low in digestible energy, such as cereal grain hulls, corn cobs and stalks, beet pulp, and fruit pulp. Many of the roughage sources available to livestock are by-products of food processed for human consumption. While there is a large variety of by-product feeds14 that may be available in certain regions of the country, Table 4 lists a few options that may be used to replace forage, such as alfalfa and grass hay, in the Southwest.
|
Table 4. Nutrient content and recommended maximum inclusion rate in the diet for alternative roughage sources. |
|||||
|---|---|---|---|---|---|
|
Feedstuff |
Digestible |
Crude Protein (%) |
Crude Fiber (%)* |
Calcium: Phosphorus |
Inclusion rate |
|
Alfalfa (legume) hay |
1.0 |
17.8 |
26.0 |
4.4:1 |
|
|
Bermuda grass hay |
0.85 |
10.4 |
29.9 |
1.8:1 |
|
|
Beet pulp |
1.27 |
10.0 |
19.2 |
10.1:1 |
50%; up to 10 lbs. dry weight |
|
Cottonseed hulls |
0.77 |
6.2 |
46.9 |
1.5:1 |
10% |
|
Soybean hulls, pelleted |
1.02 |
13.9 |
34.7 |
3.7:1 |
50% |
|
Sources: *Crude fiber values obtained from Dairy One: https://dairyone.com/services/forage-laboratory-services/feed-composition-library/. All other nutrient values obtained from Nutrient requirements of horses.19 |
|||||
Beet pulp. Beet pulp is commonly available as “shreds” or in pelleted form for feeding to livestock. It is recommended to soak (2 parts water to 1 part beet pulp) either form for about 15 minutes and then drain the excess water prior to feeding as this will reduce the incidence of choking on the dry feedstuff. This is a highly digestible fiber that can replace up to 10 lbs. (on a dry matter basis) of the forage required in the horse’s diet.15 However, since beet pulp is much higher in calcium than phosphorus, it is important to ensure that the final diet of the horse meets nutrient requirements for calcium and phosphorus and that the calcium-to-phosphorus (Ca:P) ratio is close to the ideal range of 2 parts calcium to 1 part phosphorus.
Cottonseed hulls. Cottonseed hulls are the outer covering of cottonseeds, which are removed during the processing of cottonseed meal and/or oil. The hulls are a highly fibrous, bulky roughage commonly used in cattle rations. Feeding whole cottonseed can be associated with gossypol toxicity in livestock, and feeding large amounts of cottonseed products to horses is not common. However, the hulls are typically very low in free gossypol content, and inclusion of cottonseed hulls at 10% of the total diet of young, growing horses did not negatively impact feed intake or growth.16
Soybean hulls. Soybean hulls result from the processing of soybeans into soybean meal. Since the hulls are light and dusty, they are often pelleted prior to transportation to animal feeding centers. This highly digestible fiber source has been used to replace as much as 50% of the hay in a horse’s diet.17
If you are considering using alternative roughage sources to replace some of the forage in the horse’s diet, you should first determine which roughage sources are available to you and at what cost. The Agricultural Electronic Bulletin Board18 at the University of Missouri can give you a general idea of by-product feed prices, and an agricultural commodity broker in your area can give more details on the availability and final costs of by-products delivered to your location. Furthermore, readers are cautioned to avoid wet by-products that don’t store well. Like forages, by-product feedstuffs can vary in their nutrient content, so it is recommended to obtain a nutrient analysis on each lot of by-products purchased. This is very important to ensure that the final diet formulated meets the nutrient requirements, at the correct amounts and ratios, for the horses being fed.
Remember that any changes to the horse’s diet should be made gradually over a 10-to-14-day period to minimize upsetting the digestive system. Furthermore, an equine nutritionist should be consulted to help you use the nutrient analysis of your hay, roughage alternatives, and grain or commercially bagged feed to make sure the final diet selected is safe, balanced, and meets the requirements of the horses you are feeding. Many by-products have nutrient imbalances (e.g., calcium to phosphorus ratio) that will need to be adjusted in the final diet, and a nutritionist can also advise you if a toxin analysis, such as mycotoxin or gossypol, might be wise to conduct on certain by-products.
Conclusion
It is important to remember to evaluate the expenses of the entire operation when making changes through cost saving practices. For example, individually weighing forage for each horse can reduce the amount and costs of forage being fed, but this is accompanied by an increase in labor costs to do so. Also, if you choose to feed poor quality hay and experience an increase in the occurrence of colic, the money saved on hay may be lost due to an increase in veterinary expenses. There is no “magic” solution for animal management during drought conditions. It is a challenge that requires prior planning, critical analysis and decision-making skills, and potential changes in management to come out of it successfully. The ideas and resources mentioned in this guide can help owners prepare for and make timely management decisions. While online tools are helpful guides and sources of data, readers are encouraged to seek expert advice for drought planning and management on their operation.
References
- Spackman, C. (2022). Defining Drought on New Mexico Rangelands [Guide B-825]. New Mexico State University Cooperative Extension Service. https://pubs.nmsu.edu/_b/B825/index.html
- Merriam-Webster. (n.d.). Drought. In Merriam-Webster.com dictionary. Retrieved March 6, 2026, from https://www.merriam-webster.com/dictionary/drought
- Climate in New Mexico. Retrieved September 2, 2025, from https://weather.nmsu.edu/climate/about
- U.S. Drought Monitor. Drought Classification. Retrieved September 2, 2025, from https://droughtmonitor.unl.edu
- Climate Prediction Center. 90 Day Outlook. Retrieved August 25, 2025, from https://www.cpc.ncep.noaa.gov/products/predictions/long_range/interactive/index.php
- National Drought Mitigation Center. Grassland Productivity Forecast. Retrieved August 11, 2025, from https://grasscast.unl.edu/Outlook.aspx
- National Drought Mitigation Center. U.S. Agricultural Commodities in Drought. Retrieved August 11, 2025, from https://agindrought.unl.edu/Home.aspx
- U.S. Department of Agriculture. Agricultural Marketing Service. Hay Reports. Retrieved August 11, 2025, from https://www.ams.usda.gov/market-news/hay-reports
- National Drought Mitigation Center. Managing Drought Risk on the Ranch. Retrieved August 11, 2025, from https://ranchdrought.unl.edu/
- Western Regional Climate Center. Western U.S. Climate Historical Summaries. Retrieved August 11, 2025, from https://wrcc.dri.edu/Climsum.html
- Marsalis, M.A., Hagevoort, G.R., Turner, J.L., & Lauriault, L.M. (2024). Hay Nutritive Value, Quality, and Testing [Circular 711]. New Mexico State University Cooperative Extension Service. https://pubs.nmsu.edu/_circulars/CR711/index.html
- Turner, J.L., Martinez, D., & Waggoner, J. (2023). Hay Feeding Management Strategies as Cost-control Measures on Horse Farms [Guide B-721]. New Mexico State University Cooperative Extension Service. https://pubs.nmsu.edu/_b/B721/index.html
- Cook, J., Warren, L.K., & Aravis, P. (2025). Managing Small Acreage Pastures During and After Drought. Colorado State University Cooperative Extension Service. https://extension.colostate.edu/resource/managing-small-acreage-pastures-during-and-after-drought
- Hiney, K. (2016). Use of by-product and nontraditional feeds for horses. Oklahoma State University Cooperative Extension Service. https://extension.okstate.edu/fact-sheets/use-of-by-product-and-nontraditional-feed-for-horse.html
- Warren, L.K., & Siciliano, P.D. (2010). Stretching your horse’s hay supply during drought [Publication 1.625]. Colorado State University Cooperative Extension Service. Retrieved August 14, 2025, from https://archives.mountainscholar.org/digital/collection/p17393coll94/id/16196
- Lyle, W.H. (1983). Utilization of cottonseed hulls for horses. [Master’s Thesis, University of Arizona]. UA Campus Repository. https://repository.arizona.edu/handle/10150/274912
- Coverdale, J.A., Moore, J.A., Tyler, H.D., & Miller-Auwerda, P.A. (2004). Soybean hulls as an alternative feed for horses. Journal of Animal Science, 82, 1663-1668. https://doi.org/10.2527/2004.8261663x
- University of Missouri. Agricultural Electronic Bulletin Board. Retrieved August 25, 2025, from http://agebb.missouri.edu/dairy/byprod/listing.php
- National Research Council. (2007). Nutrient requirements of horses, 6th ed. The National Academies Press.

Jason L. Turner was a Professor and Extension Horse Specialist at NMSU. He was active in 4-H and FFA while growing up in Northeastern Oklahoma. His M.S. and Ph.D. studies concentrated on equine reproduction, health, and management. His Extension programs focus on proper care and management of the horse for youth and adults.
To find more resources for your business, home, or family, visit the College of Agricultural, Consumer and Environmental Sciences on the World Wide Web at pubs.nmsu.edu
Contents of publications may be freely reproduced for educational purposes. All other rights reserved. For permission to use publications for other purposes, contact pubs@nmsu.edu or the authors listed on the publication.
New Mexico State University is an equal opportunity/affirmative action employer and educator. NMSU and the U.S. Department of Agriculture cooperating.
April 2026 Las Cruces, NM