Market-Based Management of Water Scarcity in the Elephant Butte Irrigation District
Water Task Force: Report 7
Ereney Hadjigeorgalis and Dustin Vendrely
College of Agricultural, Consumer and Environmental Sciences, New Mexico State University
Authors: Respectively, Assistant professor and graduate assistant, Agricultural Economics and Agricultural Business, New Mexico State University.
Introduction
During the past hundred years, the United States has been the witness and victim of severe and prolonged droughts in several states. The 1930s Dust Bowl lasted seven years and spread over 70% of the continental United States. The drought of the 1950s spanned a five year period and at its peak extended over ten states and three regions. Massive drought across the United States occurred again in 1987 and 1996.
Drought is a natural hazard that has affected more people in North America than any other natural hazard (Riebsame, Chagnon & Karl, 1991). Every year at least one region of the United States experiences drought. Losses due to drought in the United States average $6–8 billion every year; the 1987–89 drought cost the United States $39 billion (National Climate Data Center, 2006). Continuing uncertainty in drought prediction contributes to crop insurance payouts of over $175 million per year in western Canada (National Climate Data Center, 2006).
The inevitability and recurrence of drought spurs the need to develop innovative approaches to water management (Pirie, de Loe & Kreutzwiser, 2004; Ross, Cancelliere & Guiliano 2005; Wilhite, 1997). Proactive water management strategies may focus on physical and technological solutions to drought, institutional changes, or the use of economic instruments. Approaches that focus on control over the physical environment and a reliance on technology include, among others, warning systems or drought forecasting (Ahn, 2000; Huang & Yuan, 2004; Lohani & Laganathan, 1997), optimal reservoir operations under drought (Chang, Kleopa & Teoh, 1995), or decision support systems to support drought management (Merabtene, Kawamura, Jinno & Olsson, 2002; Jain & Ormsbee, 2001; Karavitis, 1999). Institutional mechanisms include such examples as Colorado's Law of the River (Henderson & Lord, 1995) and intrastate drought management (Lord, Booker, Getches, Harding, Kenney & Young, 1995). These are top-down, centralized approaches that rely on an administrative authority or entity to act for the good of a larger set of water consumers.
An alternative to these approaches is decentralized mechanisms, which empower individual water users and take advantage of information that is not available at a centralized level. Crucial to this is the shift to defining drought less as an unpredictable natural disaster and more as a manageable risk that users are able to predict and control through formal business planning techniques (Higgins, 2001). In other words, there has been increasing interest in user-driven or demand-side approaches to water management. These approaches focus on economic instruments in the form of water pricing schemes, water transfer mechanisms, and water marketing.
Examples of the use of economic instruments to manage water scarcity abound in the literature. Campos and Studart (2006) explain that after years of supply-side water resource management, Ceara State in Brazil began to emphasize the demand side in water policy, including legal water rights and user participation in river basin committees. They credit this new demand management model with improved outcomes in the 1993 and 1998 droughts. Keplinger, McCarl, Chowdhury & Lacewell (1998) examine the use of economic instruments in the Edwards Aquifer of Texas, where farmers were paid to suspend irrigation in times of peak water demand in order to satisfy demands for spring flow and non-agricultural pumping. Lund and Reed (1995) describe a system of transferable drought rations where farmers with more flexible irrigation needs can trade their drought rations to those whose needs are more rigid. Gomez, Tirado & Rey-Maquieira (2004) analyze the welfare gains associated with an improvement in the allocation of water rights through voluntary exchanges. Their main conclusion is that the increased efficiency provided by "water markets" makes this option more advantageous than the popular alternative of building new desalination plants. Iglesias, Garrido & Gomez-Ramos (2003) show that a voluntary banking system could result in welfare gains of 32 to 82% for farmers depending on the supply system. The economic potential of water management instruments in the Rio Grande Basin was most recently documented by Booker, Michelson, and Ward (2005) who found that drought damages in the basin as a whole could be reduced by 20 to 33 percent per year by intracompact and interstate water markets, respectively.
The use of economic instruments at the individual level of water users, however, can only work if those users embrace the new institutional mechanisms of the market and if that market caters to their particular needs (Easter, Rosegrant & Dinar, 1998). There is evidence in the literature that this is not always the case and that there is pronounced resistance to water marketing in several areas. Tregarthen (1983) first laid out a treatise for the lack of trust in water markets in his essay, "Water in Colorado: Fear and Loathing of the Marketplace." Tisdell and Ward (2003) point out that how well the market will achieve government expectations depends in part on farmers' perceptions and attitudes to water trading in general and their perceptions of the structure and conduct of the market.
This research incorporates the importance of farmers' perceptions and attitudes to water trading through a survey of farmer interest in water transfer mechanisms in the Elephant Butte Irrigation District of Southern New Mexico. During the summer of 2005, 166 farmers were surveyed as to their water trading behavior and the suitability of different water transfer mechanisms to their particular circumstances. The research aims to ascertain farmers' interest and willingness to participate in alternative market-based water transfer mechanisms as a means to manage their variable water supplies.
In the first part of this paper, we document the persistence of drought over time in New Mexico and provide a detailed description of the study area—the Elephant Butte Irrigation District of the Lower Rio Grande Basin of New Mexico. This is followed by a description of the methodology used in the study and a discussion of the survey results.
Drought and Water Scarcity in New Mexico
New Mexico is one of the driest states in the Western U.S. Of the twelve western states, New Mexico ranks eighth in terms of acreage-weighted annual precipitation (Figure 1). Only Arizona, Nevada, Utah and Wyoming have lower levels of precipitation. Historically, precipitation averages 14 inches per year. Below average precipitation years, however, are common (Figure 2). The driest year on record was 1956, when annual precipitation reached only 6.55 inches (Western Regional Climate Center, 2006). Conditions in 2003 rivaled that event. Annual precipitation in that year reached only 9 inches, and farmers in the EBID irrigation district received only 8 inches of irrigation water, compared to the allotment of 3 acre-feet in a full supply year.
Droughts have occurred on average every 10 years in New Mexico (Sammis, 2006) (Table 1). In fact, each climate division in the state is in severe to extreme drought 8–15% of the time, and some part of the state is always in a drought (Sammis, 2006). Drought conditions are measured by the Palmer Drought Severity Index (PDSI). The PDSI is a more accurate measurement of drought conditions compared to precipitation levels only as it also takes into account temperature. Figure 3 shows Palmer Drought Severity Indices for New Mexico's climate division 8, where the Elephant Butte Irrigation District resides. Indices less than or equal to -2.0 indicate drought, whereas indices between 0 and -2 indicate dry years with less than normal precipitation. Indices equal to -3.0 or less than or equal to -4.0 are indicative of severe and extreme drought, respectively. As can be seen from the graph, New Mexico has undergone long and sustained periods of drought, most recently over the 2003–2004 growing seasons.
Agriculture depends on irrigation and stored water in the lower Rio Grande Basin. As such, reservoir storage levels as a percent of total capacity are reasonable indicators of water scarcity and drought conditions over growing seasons. The severity and significance of drought conditions in the basin come to light when we focus on reservoir levels over the 2001–2006 period (Figure 4). Reservoir levels in the 2003–2004 drought dropped to less than 15% of capacity at its lowest level, and they had failed to recover substantially even at the beginning of the 2006 growing season. Given that farmer water allocations are directly related to reservoir storage levels, the need for a mechanism to reallocate among farmers what scarce water is available is paramount.
Table 1. Periods of Drought in New Mexico: 1900-1999
| 1900-1904 | 1950-1957 |
| 1909-1911 | 1963-1964 |
| 1917-1918 | 1976-1978 |
| 1922 | 1989 |
| 1934-1935 | 1996 |
| 1945-1948 | |
| Source: Sammis, 2006 | |
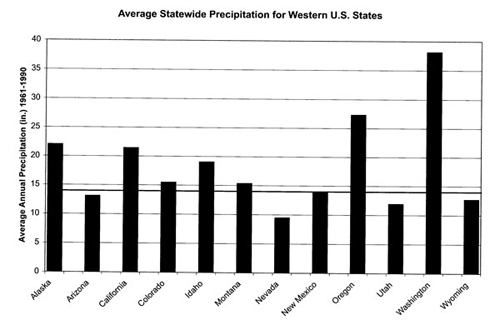
Figure 1. Average Annual Precipitation for Western States, 1961–1990. Source: Western Regional Climate Center, 2006.
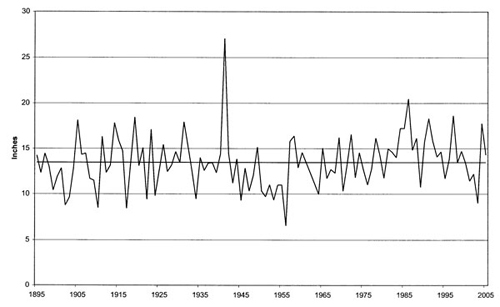
Figure 2. New Mexico Precipitation 1895–2005. Source: Western Regional Climate Center, 2006
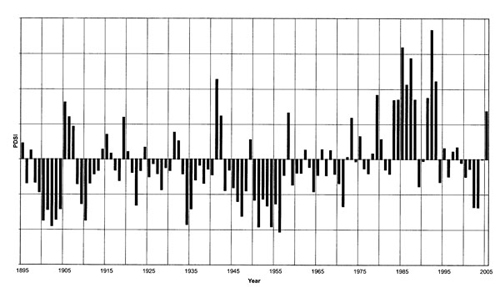
Figure 3. Palmer Drought Severity Indices for New Mexico Climate Division 8, 1895–2005.
Source: New Mexico Climate Center, 2006.
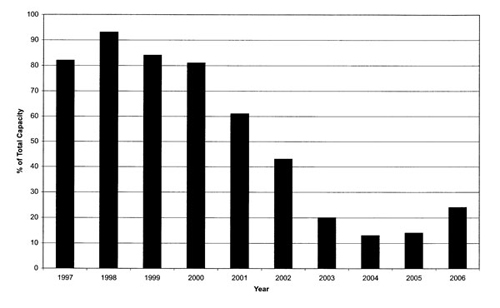
Figure 4. Elephant Butte Reservoir Levels as a Percent of Total Capacity: 1997–2006. Source: Natural Resources Conservation Service, 2006.
The Elephant Butte Irrigation District
The Elephant Butte Irrigation District (EBID) is the surface irrigation water provider for farmland in the valleys of Doña Ana County and the Rincon Valley in Sierra County. There are approximately 90,640 water-righted acres of farmland within the district downstream of the Caballo Dam (Figure 5). Elephant Butte and Caballo Reservoirs, with a total capacity of 2,564,600 acre-feet, store water for the district (Figure 6). There are currently more than 8,000 water users in the district, of which 3,600 are classified as farm tracts with at least 2 acres of irrigated land. The remaining users are classified as small tracts and receive surface water to irrigate mostly urban landscapes under 2 acres.
Although New Mexico is a prior appropriation state, the priority date is the same for all users within the Elephant Butte Irrigation District, so essentially it operates as a proportional water distribution system. Under a proportional system, all water users share equally in shortages and receive the same water allocation per acre.
When water is plentiful, an EBID farmer will receive the full allotment, which is two acre-feet per acre with the option to purchase a third acre-foot. The assessment for this water is $50 per water-righted acre for the first two acres and $18–20 per water-righted acre for the optional third acre-foot. As in most of the western United States, water allocation is not guaranteed from year to year.
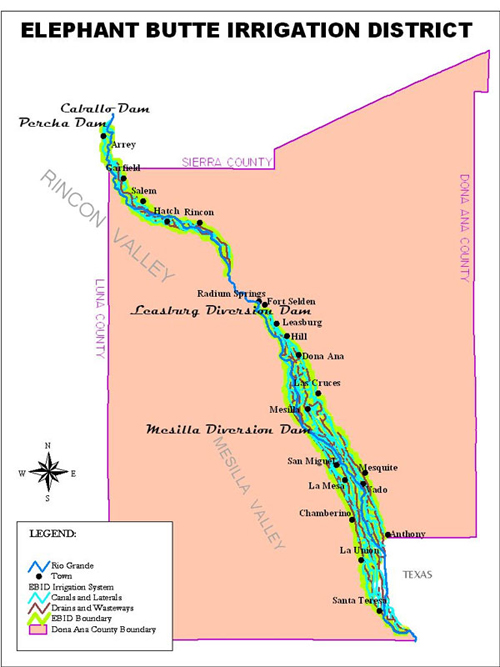
Figure 5. Map of the Elephant Butte Irrigation District. Source: EBID, 2006.
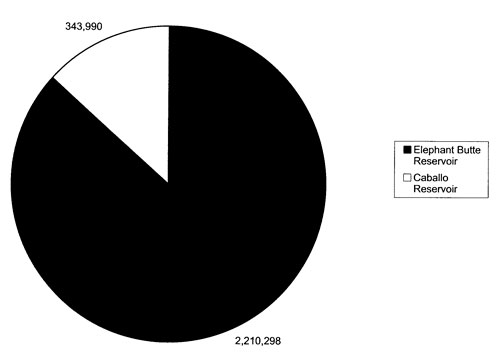
Figure 6. EBID Reservoirs Storage Capacity in Acre-Feet. Source: Bureau of Reclamation, 2006
Conservation Pool
Water trading is currently allowed by district guidelines, but prices are generally fixed and only farm tract users are allowed to participate in transfers. Unused water is stored in a conservation pool in the reservoirs. The conserved water can either be sold directly by the farmer, or EBID can act as a broker for a water seller. The cost of purchasing water from the conservation pool changes on a yearly basis in order to cover increasing costs and expenses that EBID might incur. For the 2005 growing season, conserved water was available for $18 per acre-foot (L. DeMouche, personal communication, June 15, 2006)
Although there are more small tract than farm tract users, the volume of water consumed by farm tract users is far greater (Figure 7). Farm tract users account for over 96% of all water-righted acreage. Also, farm tract users have greater flexibility in water deliveries and hence water transfers. Given these characteristics, this research focuses only on water transfer interests among farm tract users.
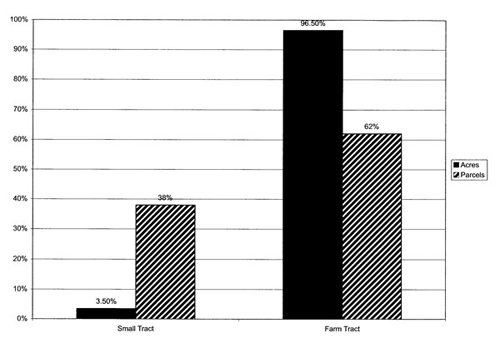
Figure 7. Distribution of Water-Righted Acres in EBID between Farm Tract and Small Tract Users. Source: King, 2004.
Agriculture in the Elephant Butte Irrigation District
Over 95% of the farmland that EBID irrigates lies within Doña Ana County (V. Beversdorf, personal communication, July 31, 2006). The county is a highly productive agricultural region within the state. Most farmland is dedicated to the production of crops, with a very large percentage dedicated to pecan production (Table 2). In fact, Doña Ana County produces more pecans than any other county in New Mexico and is the top pecan producing county in the United States (U.S. Census Bureau, 2002). Other important crops include cotton, particularly the Pima variety, vegetables and melons, and forage for animals. The market value of agricultural production in Doña Ana County in 2002 was over $251 million, of which approximately half was attributable to crop production. A large portion of this is high-value nursery and greenhouse production, which while covering only 965 acres generated $24,752,000 in market value in 2002 (U.S. Census Bureau, 2002).
Farms in Doña Ana County tend to be much smaller than the median farm size in New Mexico. In 2002, median farm size was 8 acres for Doña Ana County. This is the smallest farm size of any other county in New Mexico. Median farm size for New Mexico as a whole was 160 acres in 2002 and some counties have median farm sizes of over 2,000 acres (U.S. Census Bureau, 2002). According to the 2002 Census, more than 60% of the farms in Doña Ana County fall in the 1–9 acre size category whereas more than 80% are smaller than 50 acres (Figure 8).
In addition to small farm sizes, Doña Ana County also has a high concentration of part-time farmers. Of the 1,721 principal operators surveyed by the 2002 Census, 54% reported occupations other than farming as their primary occupation. This is a phenomenon that is typical of farmland that lies near large urban centers in the state. The Albuquerque area has a similar concentration of part-time farmers, whereas in the more rural counties of Union, Luna, Colfax, and Catron, full-time farmers outnumber part-time farmers 2 to 1.
Table 2. Major Crops in Doña Ana.
| Crop | Acreage |
| Pecans | 25,981 |
| All Cotton | 15,020 |
| of which Pima Cotton | 6,535 |
| Vegetables, Melons, Potatoes, Sweet Potatoes | 10,282 |
| Nursery, Green House, Floriculture | 963 |
| Forage | 18,180 |
| Source: Census of Agriculture, 2002. | |
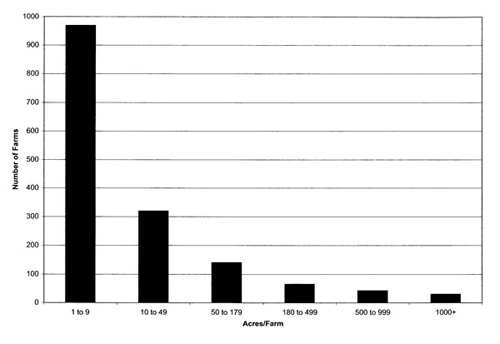
Figure 8. Distribution of Farm Sizes in Doña Ana County, New Mexico. Source: U.S. Census Bureau, 2002.
Methodology and Data
The Survey Instrument
A survey was administered to 166 farmers in the Elephant Butte Irrigation District between June and August of 2005. Data was collected on land use, water rights and irrigation practices, previous water transfers within the EBID administrative structure, risk management practices, and socioeconomic characteristics. The survey also evaluated farmer interest in a variety of water transfer mechanisms. Each farmer was given a sheet that detailed the characteristics of each water transfer mechanism (Box 1). They were then asked if they would participate in each mechanism if it were made available to them.
Box 1: Water Transfer Mechanisms Descriptions from Farmer Survey
|
Water Bank
Spot Water Market
Water Options Market
Water Rights Market
Land and Water Rights Market
|
Sample Selection
The sample was taken from a population of approximately 3,600 farmers in the irrigation district. The sample size represented 4.6% of the total population of farmers in the Elephant Butte Irrigation District. These farmers managed 217 farms for a total acreage of 7,875 acres, which represents 13.8 percent of the total number of farms in Doña Ana County and 8.7 percent of total acreage. No farmers were surveyed in Sierra County.
The sample was geographically-stratified across the irrigation district. Slightly less than half the sample (45.2%) was concentrated in the area from central Las Cruces to Radium Springs, NM, consistent with the distribution of farm operators in the county (Figure 5). Although most farms in this area (55%) ranged from 2 to 5 acres, some farms were as large as 1,000 acres.
Surveys were conducted in person at the farmer's parcel. We chose this method of data collection because it allowed us to outline geographic areas for surveying. Geographically delineated surveying was not possible under either mail or telephone survey approaches since many of the addresses available were off-farm urban addresses. We also believed that in-person interviewing would yield higher response rates than other methods such as mail surveys. Farms to be surveyed were identified through hydrographic maps provided by the Office of the State Engineer in Las Cruces.
Surveyors made 993 farm contacts over the survey period. Non-response was principally a result of absent farm owners. Farmer absenteeism on the parcels is attributed to the high concentration in the county of part-time farmers who may only visit their farms sporadically. Two hundred and six farmers were found on-farm during the survey period and 166 completed the survey for a response rate of 80.5% percent. Non-responders included non-English speakers (8.3%) and those unwilling to participate in the survey (11.2%).
Sample to Population Comparison
The median farm size for the sample is 6 acres whereas the median farm size for the population is 5.16 acres. The sample's mean farm size is 36.2 acres, but the distribution of farm sizes is skewed, with many farms just at the 2 acre limit and two farms of over 1,000 acres each. The dispersion of farm size is reflected by a standard deviation of 112.26 acres. This gives a coefficient of variation of 310%. The distribution of farm sizes in the sample was similar to that of the population as illustrated in Figures 9 and 10.
The crop distributions between the sample and the population are different (Figures 11 and 12). Most of this difference is attributable to the inclusion in the sample of a 3,000-acre pecan farm, which represented almost half of the total acres surveyed. The crop distributions may also differ due to differences in crop rotation, as the population crop distribution represents 2004 data and the sample crop distribution represents 2005 data.
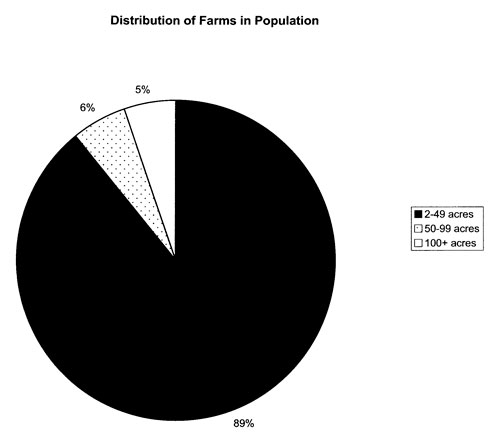
Figure 9. Distribution of Farm Sizes among Sampled Farmers. Source: Survey of EBID Farmers, 2005.
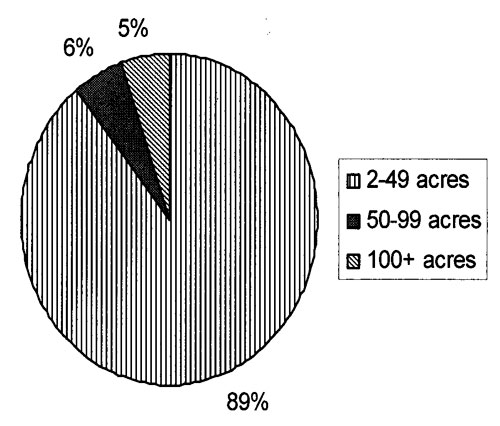
Figure 10. Distribution of Farm Sizes among Population of EBID Farmers. Source: EBID Farm Accounts Database, 2005.
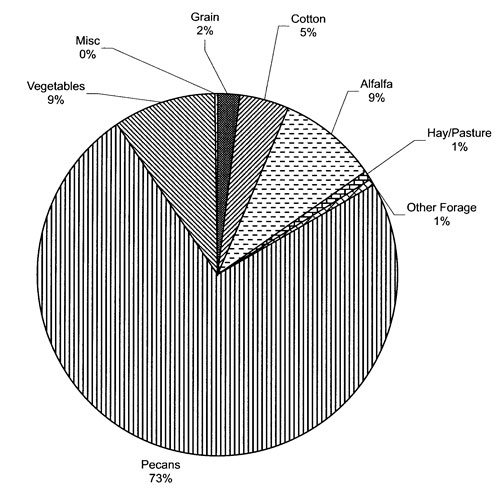
Figure 11. Distribution of Crops Planted Among Sampled Farmers, Summer 2005. Source: Survey of EBID Farmers, 2005.
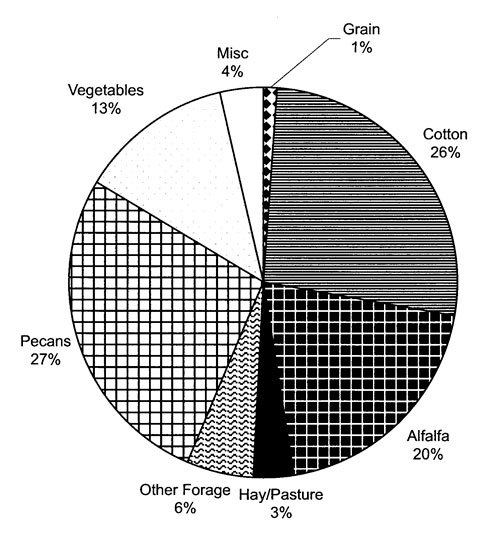
Figure 12: Distribution of Crops Planted Among All Farmers, Summer 2004. Source: Elephant Butte Irrigation District.
Summary Survey Statistics
Ninety-five percent of those surveyed own their land, while 5% both own and rent parcels. However, only 9% of the respondents were full-time farmers who depended on agriculture as their main source of income. This is an important finding since we might expect the decisions of part-time farmers to differ from those who derive most if not all of their income from agriculture. Approximately 30% of the respondents were retired.
Water Transfer Preferences
Water transfer mechanisms were separated into two groups, short-term mechanisms and long-term mechanisms. Short-term mechanisms allow for the transfer of water only on a seasonal basis and include water banks, spot water markets, and water options markets. Long-term or permanent transfer mechanisms involve the transfer of the water rights title with or without the accompanying land (See Box 1).
Farmers were not asked to choose the mechanism they preferred or to rank the mechanisms, but rather to indicate whether they would participate in any of the mechanisms. If they indicated interest in the mechanisms, they were asked whether they would use it to buy or sell water or water rights. As a result, their responses were not mutually exclusive and farmers often identified more than one mechanism as relevant to their needs.
Findings
Current Water Transfer Preferences
Farmers have the option of purchasing additional water either from EBID's conservation pool or privately from a third party. Over half of the survey respondents had purchased additional water from EBID at some point (Figure 13). These purchases include the purchase of the third acre-foot of water and the purchase of conserved water from the conservation pool held in the Elephant Butte Reservoir. Of the respondents who did not purchase additional water from the district, 49% had access to additional water supplies through on-farm wells. Few individuals chose to sell their unused or conserved water through the district. A farmer can also sell his/her water to another farmer without obtaining permission from the district, but this type of transfer is less frequent (Figure 14.)
Sixty-nine percent of the respondents preferred that the current administration of EBID handle all water transfers. However, 83% of the farmers believed that water-right owners should be able to buy, sell, and/or rent their water at individually negotiated prices. This implies that although most farmers are willing to confer authority on EBID to effect transfers, they do not believe that this authority should extend to setting the prices for the water transfers.
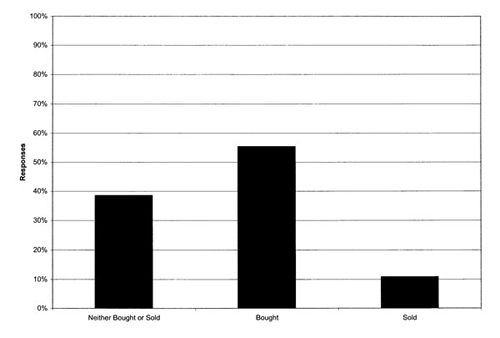
Figure 13. Water Transfers Through EBID. Source: Survey of EBID Farmers, 2005.
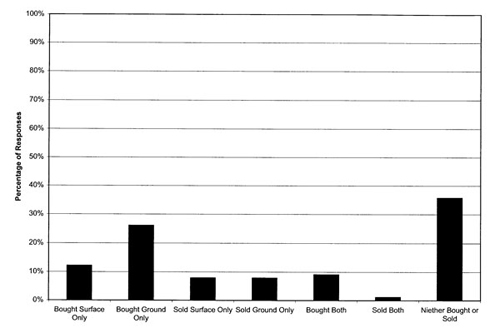
Figure 14. Non-EBID Brokered Water Transfers Between Farmers. Source: Survey of EBID Farmers, 2005.
Interest in Water Transfer Mechanisms
Farmers in EBID expressed greater interest in short-term transfer mechanisms such as spot water markets and water banks than in a water options market. Survey results also indicated that many people did not want to trade permanent water rights without land being attached in the transaction.
Eighty percent of farmers were interested in at least one short-term water transfer mechanism (Figure 15). Sixty-three percent of respondents stated that they would participate in a spot water market in some fashion, if the option was available to them; whereas a lower percentage (54%) was willing to participate in a water bank. The higher interest in spot markets, where prices are individually negotiated between transacting parties, is an interesting result given that EBID's current transfer regime resembles a water bank with a fixed price structure. It is a counterintuitive result, however, given that most survey respondents stated that they were interested in purchasing rather than selling water. Given that current prices for conserved water are $18–20 per acre foot, one would expect that a fixed price regime would be preferable to individually negotiated prices.
The least favorable option for short-term transfers was a water options market; only 30% said they would be interested in participating in this mechanism. Many of the farmers stated that a water options market was too complicated for their operations. This may be reflective of the high concentration of small farms and part-time farmers. Alternatively, farmers may not have had experience with unavailability of conserved water through EBID's current transfer regime and as such would view an options market as a mechanism not tailored to their more simple needs.
A lower percentage of farmers were interested in long-term transfer mechanisms. Sixty-seven percent of farmers were interested in some sort of permanent transfer mechanism, whereas 80% were interested in short-term mechanisms. When asked about mechanisms that only dealt with the permanent transfer of water rights, only 36% were interested in a water rights market where water rights could be transferred separate from land, whereas 54% said they would be willing to use this system only if land and water rights were tied together (Figure 16). Twenty-five percent were indifferent to whether land accompanied water-rights transfers. These statistics seem to reflect a reluctance among farmers in the district to part with their water rights on a permanent basis, particularly if they intend to continue farming. The results may be influenced by the current adjudication process, which has attributed a certain amount of uncertainty to water rights ownership in the district.
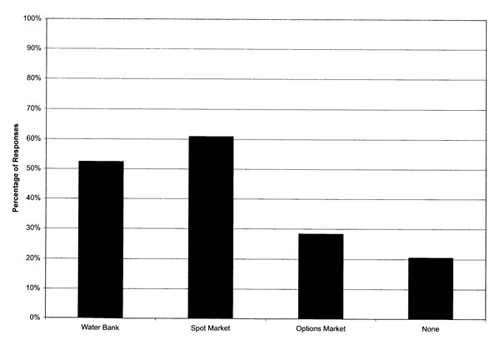
Figure 15. Interest in Short-Term Water Transfer Mechanisms. Source: Survey of EBID Farmers, 2005.
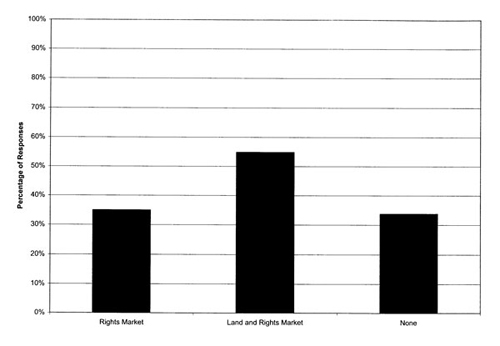
Figure 16. Interest in Long-term Water Transfer Mechanism. Source: Survey of EBID Farmers, 2005.
Conclusion
Water markets are a viable alternative to drought management at the level of the individual user, and they have been implemented under a variety of scenarios and mechanisms throughout the western United States. The attractiveness of the use of economic instruments, such as markets, to manage drought lies in the empowerment of individual users and the use of decentralized information. This proactive approach to drought management takes on a variety of forms and can only be fully successful if it is tailored to the particular circumstances and needs of water users in the area concerned.
In the Lower Rio Grande Basin, there is evidence of substantial interest in alternative water transfer mechanisms. Farmers prefer short-term or temporary transfer mechanisms over more permanent transfer regimes, which may be reflective of their desire for greater flexibility in transfers. Where interest in permanent transfer mechanisms was manifested, farmers showed greater interest in joint movements of land and water rather than transfers of water rights separate from land.
More than anything, farmers want control over their resource management. They want control over when they buy and sell water and at what price. The most popular mechanism among surveyed farmers was a simple spot water market, where water sales are negotiated on a case-by-case basis between private parties. Water options markets, which lock farmers into decisions early in the season, were the least popular alternative in the survey—even less so than the permanent transfer of water rights with or without land.
Recurrent drought is expected. While it may be unpredictable, we can better prepare for it in the future by empowering individual users to better manage their scarce water supplies. Future research into the use of economic instruments for drought management should incorporate farmer perceptions, attitudes, and needs into the design of drought-management mechanisms and institutions.
References
Ahn, H. (2000). Ground water drought management by a feedforward control method. Journal of the American Water Resources Association, 36, 501-510.
Booker, J.F., Michelsen, A.M. & Ward, F.A. (2005). Economic impact of alternative policy responses to prolonged and severe drought in the Rio Grande Basin. Water Resources Research, 41, W02026.
Campos, J.N.B. & Studart, T.M.C. (2006). Water management and allocation in semiarid areas of Brazil: Practices in Ceara State. Water International, 31, 31-36.
Chang, T.J., Kleopa, X.A. & Teoh, C.B. (1995). Use of flood-control reservoirs for drought management. Journal of Irrigation and Drainage Engineering—ASCE, 121, 34-42.
DeMouche, L. (2004) Interpreting the Elephant Butte Irrigation District for water users (Circular No. 590). New Mexico State University, Cooperative Extension Services.
Easter, K.W., Rosegrant, M.W. & Dinar, A. (1998). Markets for Water: Potential and Performance. Boston: Kluwer Academic Publishers.
Elephant Butte Irrigation District (2005). Farm Accounts Database.
Gomez, C., Tirado, D. & Rey-Maquieira, J. (2004). Water exchanges versus water works: Insights from a computable general equilibrium model for the Balearic Islands. Water Resources Research, 40, W10502.
Henderson, J.L. & Lord, W.B. (1995). A gaming evaluation of Colorado-River drought management institutional options. Water Resources Bulletin, 31, 907-924.
Higgins, V. (2001). Calculating climate: 'advanced liberalism' and the governing of risk in Australian drought policy. Journal of Sociology, 37, 299-316.
Iglesias, E., Garrido, A. & Gomez-Ramos, A. (2003). Evaluation of drought management in irrigated areas. Agricultural Economics, 29, 211-229.
Jain, A. & Ormsbee, L.E. (2001). A decision support system for drought characterization and management. Civil Engineering and Environmental Systems, 18, 105-140.
Karavitis, C. A. (1999). Decision support systems for drought management strategies in metropolitan Athens. Water International, 24, 10-21.
Keplinger, K.O., McCarl, B.A., Chowdhury, M.E. & Lacewell, R.D. (1998). Economic and hydrologic implications of suspending irrigation in dry years. Journal of Agricultural and Resource Economics, 23, 191-205.
King, J.P. EBID Regional Growers Meeting. Spring 2004
Lohani, V. K. & Loganathan, G.V. (1997). An early warning system for drought management using the Palmer drought index. Journal of the American Water Resources Association, 33, 1375-1386.
Lord, W. B., Booker, J.F., Getches, D.M., Harding, B.L., Kenney, D.S. & Young, R.A. (1995). Managing the Colorado River in a severe sustained drought—an evaluation of institutional options." Water Resources Bulletin, 31, 939-944.
Lund, J. R. & Reed, R.U. (1995). Drought water rationing and transferable rations. Journal of Water Resources Planning and Management—ASCE, 121, 429-437.
Merabtene, T., Kawamura, A., Jinno, K. & Olsson, J. (2002). Risk assessment for optimal drought management of an integrated water resources system using a genetic algorithm. Hydrological Processes, 16, 2189-2208.
National Agricultural Statistics Services (2002), Census of Agriculture.
National Climate Data Center, U.S. Department of Commerce, Why are we concerned about drought? North American drought: A paleo perspective, Retrieved July 26, 2006 from http://www.ncdc.noaa.gov/paleo/drought/drght_alleve.html
National Climate Data Center, U.S. Department of Commerce, 20th Century Drought: The Dust Bowl Drought "North American drought: A paleo perspective," Retrieved July 26, 2006 from http://www.ncdc.noaa.gov/paleo/drought/drght_history.html
Natural Resources Conservation Service. Monthly Reservoir Reports. Retrieved July 6, 2006, from http://www.wcc.nrcs.usda.gov/cgibin/resv_rpt.pl?state=new_mexico
New Mexico Climate Center. Palmer Drought Severity Indices. Retrieved July 24, 2006.
Pirie, R.L., de Loe, R.C. & Kreutzwiser, R. (2004). Drought planning and water allocation: an assessment of local capacity in Minnesota. Journal of Environmental Management, 73, 23-58
Riebsame, W.E., Changnon, S.A. and Karl, T.R. (1991). Drought and natural resources management in the United States: impacts and implications of the 1987-89 drought. Boulder: Westview Press.
Ross, G, Cancilliere, A. & Guiliano, G. (2005), Case Study: Multicriteria Assessment of Drought Mitigation Measures. Journal of Water Resources Planning and Management, 131, 449-457
Tisdell, J.G. & Ward, J.R. (2003). Attitudes Towards Water Markets: An Australian Case Study. Society and Natural Resources 16, 61-75.
Tregarthen, T. (1983). Water in Colorado: Fear and Loathing of the Marketplace. In Anderson T.L. (ed.) Water Rights: Scarce Resource Allocation, Bureaucracy, and the Environment (pp.119-136). San Francisco: Pacific Institute for Public Policy Research.
U.S. Census Bureau. Census Data (2000) for Las Cruces, New Mexico. Retrieved February, 15th 2006, from http://factfinder.census.gov/
Western Regional Climate Center. Average Statewide Precipitation for Western U.S. States. Retrieved June 28, 2006, from http://www.wrcc.dri.edu/htmlfiles/avgstate.ppt.html
Wilhite, D.A. (1997). State actions to mitigate drought: Lessons learned. Journal of the American Water Resources Association, 33, 961-968.
To find more resources for your business, home, or family, visit the College of Agricultural, Consumer and Environmental Sciences on the World Wide Web at aces.nmsu.edu
Contents of publications may be freely reproduced for educational purposes. All other rights reserved. For permission to use publications for other purposes, contact pubs@nmsu.edu or the authors listed on the publication.
New Mexico State University is an equal opportunity/affirmative action employer and educator. NMSU and the U.S. Department of Agriculture cooperating.
April 2007