Landscape Attitudes and Choices: A Survey of New Mexico Homeowners
Water Task Force: Report 5
Brian H. Hurd and Joshua Smith
College of Agricultural, Consumer and Environmental Sciences, New Mexico State University
Authors: Respectively, Assistant Professor and Graduate Research Assistant, Department of Agricultural Economics and Agricultural Business, New Mexico State University.
Table of Contents
Acknowledgments
This research was made possible through funding and support from the Rio Grande Basin Initiative—a joint effort between New Mexico State University (NMSU) and Texas A&M University to assist agricultural producers, urban, turf and landscape managers, and irrigation districts achieve measurable water conservation for the benefit of all current and future regional water users.
The researchers are grateful to the New Mexico State University's Agricultural Experiment Station for the continuing support of my research and, in particular, the support for my time in conducting this project. The researchers are indebted to the survey participants and water conservation staff from the cities of Albuquerque, Santa Fe and Las Cruces, New Mexico, without whom this effort would not have been possible. Appreciation is especially warranted for support assistant, Sylvia Beuhler, for her help in coordinating the survey process and to the several individuals who assisted during the mailing process. Appreciation is also extended to County Extension Agent, John White, for his contribution and efforts, particularly in the design of the survey instrument, and to my colleague, Dr. Rolston St. Hilaire, whose previous work and consultations contributed significantly to the success of this project. We appreciate the careful review and suggestions of my colleague, Rhonda Skaggs, whose experience and insights are valuably taken into account. Thanks go also to Dr. Bernd Leinauer for his helpful suggestions. Lastly and most importantly, the encouragement and support of both Craig Runyan and Leeann DeMouche made this project an enjoyable process and whose efforts in directing NMSU's part of the Rio Grande Basin Initiative underlies not only my effort but the research and efforts of so many others.
Abstract
Water is a cornerstone for building New Mexico's future. Swelling populations will require a growing share of the state's water resources, and water managers need better information to balance water supplies and demands. Significant water savings of 35% to 70% are possible from changes in residential landscaping and improved management of outside watering, which often accounts for more than 50% of total residential water use. This report summarizes the findings from a survey of New Mexico homeowners, examining their attitudes and preferences for residential landscapes and the factors that determine or limit their choices. As this report shows, New Mexico's residents are, for the most part, mindful of these challenges and prepared to shoulder responsibility for stewarding the state's water resources. The findings further suggest that New Mexico residents are increasingly aware of the role of water in their communities and state. How households manage and use water to create desired landscapes and outdoor living spaces can be significant. For example, if residential outdoor water use could be cut by one-fourth in just the three communities profiled in this study, annual water savings could approach 6 billion gallons of treated, potable water (approximately 17,000 acre-feet). Conservatively valuing this saved water at a rate of $1 per thousand gallons yields nearly $6 million to the residents of these communities.
In summary, the study findings support the following key points describing the sample of New Mexico urban households in Albuquerque, Las Cruces and Santa Fe living in single-family homes with municipal water service:
- More than 70% consider water issues as 'among the most important' facing the state and their communities.
- By more than 75%, these homeowners believe that they bear significant responsibility for water conservation.
- The use of water-saving devices is quite widespread, with more than 90% of these households reporting at least one device such as a low-flow toilet, faucet or showerhead.
- Santa Fe residents tend to identify strongly with relatively more natural and native landscapes. With less than 10% of landscape in lawn, 61% of Santa Fe residents report being content with their existing landscape, more than either Albuquerque (55%) or Las Cruces (56%). This suggests that there is a significant share of households, particularly in Albuquerque and Las Cruces that might consider landscape changes with improved outdoor water-use efficiency.
- There is considerable interest by 15% of these homeowners in learning more about and seeking advice on landscaping. Perhaps this is a potential area for increased Extension and outreach.
- More than 80% of these homeowners indicated that water price is an important consideration in landscape decisions, even more than the 55% indicating the importance of community water-conservation programs.
- There is broad support by nearly 95% of these households to use water-efficient landscapes around public buildings.
New Mexico residents value the aesthetic characteristics of their homes and desire living spaces, landscapes and environments that are attractive and which enhance their quality of life. In some communities, such as Santa Fe, residents attach significance to the natural environment and to the native feel of their landscapes; whereas in others, the aesthetic balance is met with a blend of landscapes that include lawns. Mindful and deliberate use of water can meet a variety of desired landscapes without waste. The key is to approach landscape decisions with an awareness of the fundamental nature and role of water, to understand the differences in irrigation needs of various types of vegetation and landscape, and to plan for and use water wisely and effectively in meeting the needs of the desired landscape with balance and consideration of the importance of this unique resource.
Introduction
Fundamental to sustaining the economy, character and cultural traditions of New Mexico, water is used in a variety of ways to meet social, economic and environmental needs. It is a cornerstone for building the state's future. Swelling populations will require a growing share of the state's water resources; and, in planning for this growing demand, water managers need better information on the types and patterns of use, effectiveness of conservation programs, users' sensitivity to changes in rate structures, acceptability of water re-use programs, and technologies and approaches to realize greater efficiencies in water deliveries.
To better understand the characteristics of residential water demand, this project focuses on household water use: in particular, the large share of domestic water that is used in enhancing the outdoor environments that surround homes and contribute to the quality of residential living spaces. Often accounting for more than 50% of residential water use, outdoor uses are typically dominated by landscape irrigation needs. These needs vary considerably depending on landscape types and composition (Ferguson, 1987; Knopf, 2003).
By altering outdoor water use patterns, significant water-savings may be possible as shown in table 1, with estimates ranging from 35% to 75% of current per capita water use based on a typical home with a traditional bluegrass type landscape (Sovocool, et al., 2004).
Table 1. Estimated Water-Savings From Water-Efficient Landscapes (Xeriscape) in Southern Nevada
| Landscape Type | Annual Water Needs |
| Newly planted Xeriscape | 17 gallons of water per square foot |
| Mature Xeriscape with 50 percent coverage | 22 gallons of water per square foot |
| Densely planted with 100 percent coverage | 25 gallons of water per square foot |
| Lawn | 79 gallons of water per square foot |
| Potential Water-Savings | 54 gallons per square foot ~68% over traditional lawn |
| Source: (Sovocool et al., 2004) | |
Achieved rates of water-savings, however, will depend on factors beyond simply exchanging one type of vegetation for another. Arguably more important than vegetation type is the system of irrigation used and the capability of the homeowner to effectively manage the system for water efficiency. Researchers at the University of California, Riverside, Turfgrass Research Facility, for example, have estimated that two-thirds of the water savings from municipal turf rebate programs is the result of upgraded and more efficient irrigation systems, while
the remaining one-third is attributable to the switch from turfgrass to Xeriscape™ — a term coined by Denver
Water in the 1980s (Addink, 2005). In some cases, researchers have found higher water use – by as much as 10% — for Xeriscape compared to traditional landscapes. The researchers attribute this to several factors including pruning management and high planting densities, and water management regimes to encourage rapid growth. "Drought tolerant species can tolerate drought—but they grow slowly under droughty conditions and often are less aesthetically pleasing. What this means in terms of water management is that xeriphytic landscapes can induce residents to use more water that they would with traditional landscapes" (Addink, 2005, p. 4). Landscape choice is important, but achieving successful water savings requires efficient irrigation systems, properly installed and managed.
Landscape choices and changes are prompted by many factors including water price, awareness of water scarcity and drought concerns, perceived aesthetic attributes, landscapes of neighbors, municipal codes, and the time, effort and cost of making changes. A central concern and question is whether and to what extent can a household's quality of life – for example, its outdoor environment around the house — be enhanced while at the same time use less water? The policy issue that derives from this question is to what degree can the water-savings potential of water-efficient landscaping be realized?
Along the Rio Grande, throughout the arid West, and even in increasingly water-scarce areas in the East, water-intensive lawn landscapes are beginning to give way to more water efficient and climate appropriate landscapes. For example, Spinti et al. (2004) describe the acceptability of desert-type landscapes for homeowners in Las Cruces, New Mexico. They found an increasing acceptance of the aesthetics of desert-type landscapes – e.g., > 80% for use in front yards and > 56% in back yards; however, they found that actual adoption rates were lower by 25% to 30% (Spinti et al., 2004).
This study examines differences between New Mexico communities regarding attitudes toward water issues, toward their home's landscape, and their preferences for both their own landscape and the landscape around public buildings. In addition, the study identifies some of the barriers that may hinder adoption of water-efficient landscapes.
The findings are based on a survey of New Mexican households during summer 2004. The principal objective is to identify and describe attitudes and perspectives for the residential landscape and, as a corollary, the extent and acceptance of water-efficient landscaping such as the concepts of Xeriscape (Knopf, 2003) – see figure 1, and to identify key barriers to further adoption. The survey outcomes present some very interesting findings that are relevant to the problem of urban water conservation and program design.
|
"Xeriscape" simply means water-efficient or waterwise landscaping. ... The slogan was, "Xeriscape: water conservation through creative landscaping." Even though the syllables technically refer to dry (xeric) and vista (scape), the original intent was to promote wise water use through water-efficient landscaping, not necessarily to eliminate irrigation. Exerpted from (Knopf, 2003) (p. vii). |
Figure 1. The Term Xeriscape
Survey Methods and Procedures
Conducting a mail survey involving a sample of the general public involves several challenges in design and implementation. A key objective in the design and implementation is receiving a representative and credible response. The survey design, sampling methods and response characteristics are described below.
Survey Design
The survey instrument leads the respondent through a series of questions about their landscape attitudes and choices, moving from general aspects to more specific. The survey contains four sections:
- Water use at your home
- Your home's landscape
- Landscape types, water use and upkeep costs
- About you and your family
Following the central protocols of Dillman's Tailored Design Method (TDM) for mail surveys (Dillman, 2000), the survey design is accessible, inviting and engaging. The survey cover letter describes the role of the study in addressing key community issues and stresses the importance of each and every response. Reminder postcards were sent one week following the initial mailing, and two weeks after that, non-respondents were sent a second survey and cover letter as shown in Appendix A, which contains examples of each mailed item, including English and Spanish versions of the survey, and highlights differences across the four survey versions used in the study (purpose of which will be discussed later).
Sampling Methodology
Over 400 residential homeowners in each of three New Mexico cities — Albuquerque, Santa Fe and Las Cruces — were randomly sampled using records from the municipal utility of each city. These records generally contain a representative cross-section of households within the respective communities and were filtered to identify only single-family dwellings.
Survey Returns and Responses
In May 2004, 1,216 surveys were mailed to approximately 400 residents in each of the three cities. The final survey returns were received and recorded in late August 2004. In total, 423 surveys were returned, which after adjusting for undeliverable addresses, resulted in a response rate of 36.7% as shown in table 2.
Table 2. Survey Response Rate By City
| City | Las Cruces | Albuquerque | Santa Fe | NA# | Total |
| Mailed | 410 | 400 | 406 | 1216 | |
| Responses | 157 | 109 | 155 | 2 | 423 |
| Undeliverable | 22 | 25 | 16 | 63 | |
| Response Rate | 40.5% | 29.1% | 39.7% | 36.7% | |
| Notes: # – Respondents intentionally removed survey identification number. | |||||
Survey Results and Findings
Survey responses were received and coded into a database using Microsoft Access™ and were checked and analyzed for quality assurance. Then the dataset was input into SAS™ for statistical analysis. Appendix B provides a complete record of the response frequencies. Key results and findings from this analysis are given below.
Water Use Attitudes
The survey begins with four general questions concerning water resources in the community and household water use. These questions are intended to introduce and engage the participant in the topic of residential water use, to gauge attitudes about community importance, household responsibility for water conservation, knowledge of the source of their water, and specific actions taken to conserve water by the household.
The first question leads respondents into the general topic of water resources by asking them to rate their belief about the relative importance of water resource issues to their community on a scale from 1- Not Very Important to 5- One of the Most Important. Water issues are rated as one of the most important facing the state and its communities by over 72% of all respondents as shown in figure 2 and table B-1. This general concern varies across communities, with the highest observed in Santa Fe where more than 85% of residents report water issues as 'Among the Most Important' compared to 70% and 59% in Las Cruces and Albuquerque, respectively. These community differences are statistically significant at the 1% probability level using the χ2 test to examine the frequency of responses between communities.1
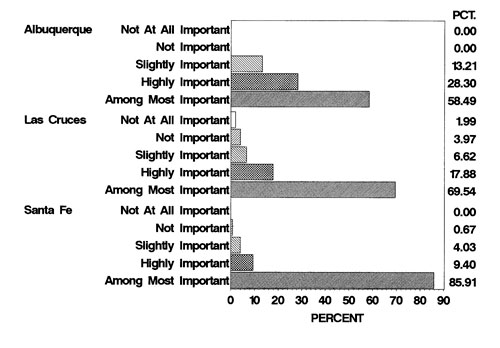
Figure 2. General perception of water issues: importance of water issues to the community
Perceived responsibility of households for conserving water also varies across the three communities. As indicated by responses to Question 2, the greatest perception of household responsibility is held by Santa Fe residents, where the average response was 4.3 (on a scale from 1-Not Very Responsible to 5-Very Responsible) compared with 3.8 and 4.0 in Albuquerque and Las Cruces, respectively. The relative frequencies of responses across the cities to these two questions are shown in figure 3 and in table B-2. These community differences are also significant at the 1% probability level. It is, perhaps, encouraging to note that fewer than 5% of respondents indicated either responsibility level 1 or 2, suggesting that there is widespread awareness that households bear some responsibility for water conservation.
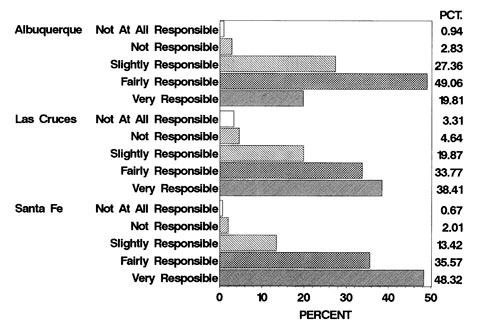
Figure 3. General perception of water issues: degree of household responsibility for conserving water.
General awareness of where the household's water supply comes from is indicated by responses to Question 3. This question prompts the respondent to consider water sources and supplies – at least one step prior to its use in the house. Given that the sample was drawn from municipal water records, the expectation is that municipal agencies should be indicated as the 'primary source' for most households. This is indeed the case; 70% indicated this source. Wells were more frequently indicated for water users in Santa Fe – with 27% reporting use of a well.
Question 4 indicates actual household efforts to conserve water. A significant majority of households, over 90%, report having installed at least one water-saving device. Differences in overall use of water-saving devices across communities were not significant at the 1%. As shown in table B-4, most common are low-flow toilets, installed in 64% of homes, followed by low-flow faucets and showerheads, installed in nearly 57%. Adoption of drip and automatic sprinklers is greater than 40%, indicating that there is a relatively high degree of sensitivity toward managing and conserving outdoor water uses. Interestingly, Santa Fe households have a greater adoption rate of indoor water-conserving devices whereas Albuquerque has the highest reported adoption of outdoor water-saving practices.
Table 3. Average Share of Homeowner Reported Landscape by Type and by Community (percent of landscape)*
| Landscape Type | Albuquerque | Las Cruces | Santa Fe | Overall |
| Traditional Type Lawn | 22.9 | 9.68 | 2.85 | 10.8 |
| Water-conserving Type Lawn | 5.1 | 19.6 | 5.6 | 10.6 |
| Traditional Type Trees and Shrubs | 9.0 | 11.8 | 9.3 | 10.1 |
| Water-conserving Type Trees and Shrubs | 8.3 | 9.9 | 13.3 | 10.7 |
| Flowers and Vegetable Gardens | 6.1 | 6.5 | 8.6 | 7.1 |
| Native/Natural Desert Landscape | 15.5 | 8.0 | 30.8 | 18.2 |
| Rocks, Gravel, and Bare Soil | 33.5 | 37.6 | 29.5 | 33.6 |
| Other | 1.5 | 2.2 | 2.1 | 2.0 |
| * Notes: Columns do not sum exactly to 100 due to rounding errors. | ||||
Landscape Attitudes
Questions 5, 6 and 7 direct the respondent's attention toward their home's landscape, raising the following questions: what types of landscapes currently exist? What are the attitudes toward this landscape? And, which factors are important in influencing attitudes and choices concerning landscapes?
Judging by responses to Question 5, which asks the homeowner to estimate the relative share of their landscape under various landscape types, there are some interesting differences between the three communities as shown in tables 3 and B-5. Notable is the contrast in the amount of 'traditional lawn' between Albuquerque and Santa Fe. With nearly 23%, Albuquerque has the greatest share of landscapable area in 'traditional type' water-intensive type lawns compared to fewer than 3% in Santa Fe. Las Cruces, on the other hand, leads in terms of 'water-conserving' type lawns with nearly 20% in this type of landscape. Climatic differences between the northern and southern regions of the state explain some of these differences, with the southern range better suited to warm season, drought-tolerant grasses such as bermudagrass. Combining both types of lawns, Las Cruces has the highest percentage of grass landscape, close to 30%, followed by Albuquerque with 28%, and Santa Fe with 8.5%. Santa Fe appears to make up for the difference in the amount of lawn with a much higher share of native or natural desert landscape, 31% compared to 16% and 8% in Albuquerque and Las Cruces, respectively.
Question 6 gauges the homeowner's attitude toward their existing landscape, for example, level of satisfaction, desirability of change, and perception of barriers to change. More than half of NM homeowners indicate that they are content with their current landscape. To illustrate, figure 4 shows the extent to which homeowners report being relatively content with their current landscape and not considering any changes. The most content households are in Santa Fe with 61%. This seems to reflect the greater share of natural landscape and its inherent desirability by Santa Fe residents. Albuquerque and Las Cruces are strikingly similar in the extent that they may consider landscape changes. In both communities more than 40% appear to indicate that they may consider changes. Of those who may not be content, very few indicated the desire to have more lawn, ranging from 6.6% in Albuquerque to 1.3% in Santa Fe. The desire to reduce the extent of lawn is relatively significant in both Albuquerque and Las Cruces, with at least 15% of homeowners indicating such a desire. As might be expected, given the much lower extent of lawn in Santa Fe, less than 3% of homeowners expressed a desire to reduce lawns. These results are illustrated in figure 5.
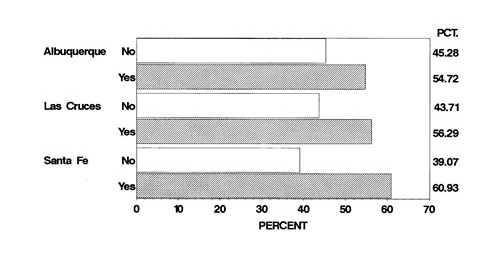
Figure 4. Is the household content with their current landscape?
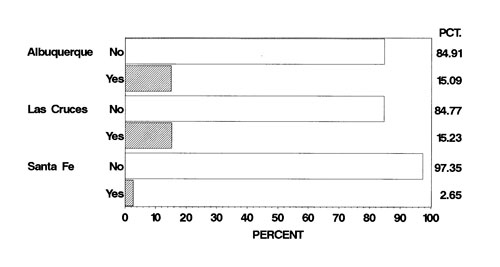
Figure 5. Household would prefer much less lawn.
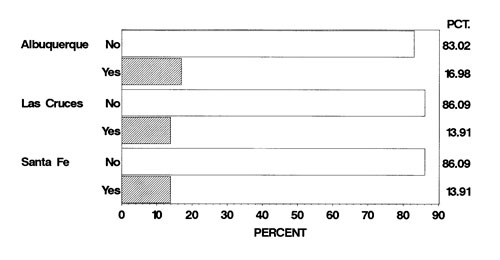
Figure 6. Household would prefer to learn more about landscape alternatives.
Nearly 15% of homeowners – across all three communities — indicated a desire to learn more about landscape possibilities and changes as shown in figure 6. This is quite a positive finding that suggests there is broad interest in seeking advice on landscape choices, and perhaps indicates a sizable interest for extension programs that support landscape education. It is also a positive finding that only one respondent indicated that a choice to reduce the amount of lawn would not be accepted by their neighbors. This suggests that community covenants, codes and restrictions are not likely to be a significant barrier to adopting water-efficient landscapes. It is also interesting to note that the gap observed by Spinti et al. (2004) between potential and actual adopters is also approximately 25%.
Time and money, however, may be significant barriers to adoption for a sizable share of the population. Lack of money to make changes was indicated by 25% of respondents and lack of time by 12% as illustrated in figures 7 and 8. These answers suggest that the gap between the landscapes that currently exist and the landscapes that are desired may be surmountable over time, perhaps with some targeted assistance and education.
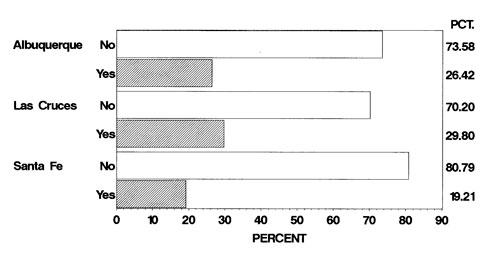
Figure 7. Does income constrain household landscape change?
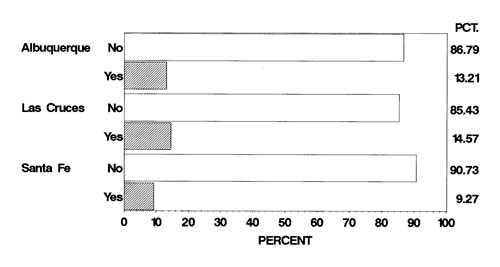
Figure 8. Does time constrain household landscape change?
What are the important factors affecting landscape choices? Question 7 asks the homeowner to rate several potential factors on a scale from 1-Not Very Important to 5- Very Important.
Aesthetic concerns, water cost, and news reports regarding water scarcity were most highly rated with average scores of 3.8 or 3.9. Enhancing neighborhood character averaged 3.2 and community programs averaged 2.7. Table B-7 shows the response frequencies for this question by community.
There were no strong trends in the responses from the different communities regarding the importance of factors. It is interesting to note that homeowners clearly elevate water cost above community programs in their consideration of landscape choice. This suggests that residents are more aware of their water rates than community conservation efforts. However, it remains questionable the extent to which water rates actually influence landscape decisions. This finding may lend support to the use of conservation type, water-rate schedules that include, for example, variable block rates that are increasing with the quantity used and conditioned upon existing supply conditions, i.e., the marginal rates (especially the higher ones) could be raised during drought emergencies.
It is also interesting to note that about 15% of respondents noted the importance of 'other factors.' Examples of these factors include:
- Ease of maintenance
- Cost of landscaping, labor and materials
- Effect on property value
- Efficacy in conserving water
- Creation of habitat for wildlife
The factors affecting landscape choices and preferences are the subject of the next section in the survey.
Landscape Choices and Preferences
Homeowners are motivated by many factors when determining the type of landscape for their homes. In this section, homeowners were presented with a set of four landscape types and are asked a series of questions about these landscapes to gain greater insight into the determining factors of landscape choice. The various landscape types correspond to the approximate amount of 'traditional' grass in the landscape composition. The available choices are:
- Type A. 100% Traditional Turfgrass
- Type B. 1/2 Turfgrass and 1/2 Water Conserving
- Type C. 1/4 Traditional Turfgrass and 3/4 Water Conserving
- Type D. No Turfgrass, 100% Water Conserving
The structure and format for this section of the survey is based on a 'market research' model of consumer choice (Hartman et al., 1991; Louviere et al., 2000; McFadden, 1986). In this framework, consumers – or in this case, homeowners – are presented with a range of alternatives that differ in the level of specific attributes and are asked to indicate which alternative is their most preferred.
An important aspect of the survey design is the variation in the attribute levels of the landscape types that are presented to respondents. Through survey pre-testing, available literature, and expert judgment by county Extension, four attributes were identified with respect to landscape decisions: water use, water cost, maintenance cost and maintenance effort. A range of values for each of these attributes was estimated for an average landscapable area of 2,500 sq. ft. These values and their supporting assumptions are shown in figure 9. To facilitate the use of the 'market research' model, further variation in the range of presented landscape attributes is necessary and requires slightly varying survey instruments. Four variants of the survey instrument were designed, varying only in the values presented for each of the four landscape attributes (see figures A-8, A-13, A-14, and A-15 for the detailed differences across the survey versions). Each of the four variants were used uniformly across each community sample. Response rates were approximately equal for each variant.
In essence, by varying the attribute levels (by using multiple variants of the survey) and sampling the preferred choices of the homeowners, an analysis of consumer choice can be performed that examines the effects and relative importance of each attribute and household characteristic in determining residential landscape choices. This 'choice analysis' is the subject of on-going research, and results will be reported separately.
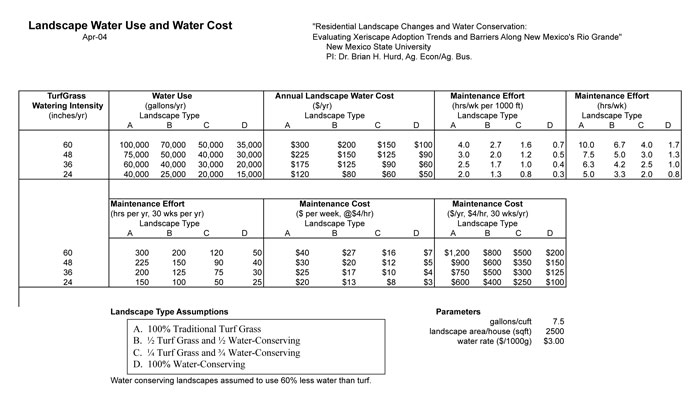
Figure 9. Estimated Landscape Water Use, Costs, Maintenance.
Matching the Landscape Alternatives with Current Landscape
The survey presents the homeowner with a detailed description of each of the four landscape types and specific levels for each of the four attributes. Question 8 asks the homeowner to identify the landscape type that most closely approximates the style and composition (in percentage terms) of their existing landscape. Responses are shown in figure 10 and table B-8, where over 70% of homeowners report having no more than 25% of their landscapable area planted in grass.
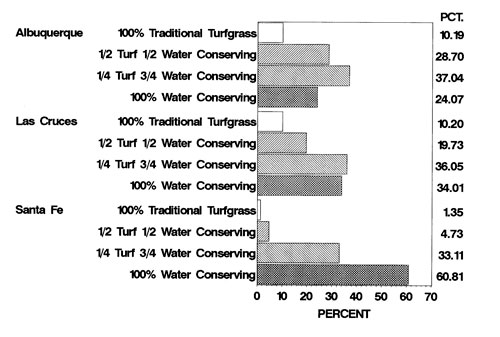
Figure 10. Which landscape type most closely resembles current landscape?
The landscapes of Santa Fe residents are clearly distinguished from both Albuquerque and Las Cruces by the much smaller share in grass. Over 93% report less than one-quarter of their landscape is in grass, compared to 70% in Las Cruces and 61% in Albuquerque. Only 1.3% of Santa Fe homeowners report having only grass, whereas, 10% do in each of the other two communities. This observation is clearly consistent with the earlier responses indicating that Santa Fe residents do not desire further reductions in 'grassy' areas.
How accurate — or conforming — are the indicated associations between the actual landscape and the 'rough' approximations of landscape types in the survey? To gauge how well the attributes represented the actual experience and perceptions of the homeowners, Question 9 asks homeowners to rate the 'closeness' on a scale of 1 – Not Close to 5 – Very Close for three of the attributes: water use, water cost, and maintenance cost. Given that the four survey versions are equally represented in the sample returns (25% for each version) and that the versions varied significantly in the range of values given for each attribute, it is somewhat surprising the degree of 'closeness' reported by homeowners. With respect to water use, 51% reported either a '4' or '5' with an average of 3.4 indicated. Water cost and maintenance cost were not as close, with 44% and 40% with a '4' or '5', respectively, and both averaging 3.1. These results validate to some degree the values given in figure 9 and confirm that they are not too extreme in characterizing the key attributes.
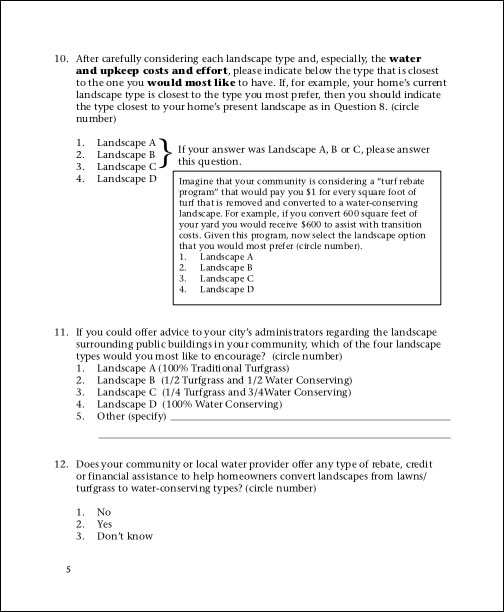
After fully describing the landscape alternatives and asking the homeowners to consider carefully the attributes of each presented landscape type, Question 10 asked them to select their 'most' preferred type. Nearly 85% indicated a landscape of no more than one-fourth in grass, as shown in figure 11 and table B-10. In Santa Fe, almost 70% selected 'no grass' at all and 99% choose no more than one-fourth grass. Consistent with their earlier answers, Santa Fe residents appear to hold a strong identity with relatively more natural landscapes – i.e., those with very little traditional grass. Homeowners in Albuquerque and Las Cruces, however, desire a higher percentage of grass around their homes, with 24% and 22% indicating a preference for at least 50% grass, respectively. Hotter summer temperatures in Albuquerque and Las Cruces and the mitigating effects of lawn on house temperatures may explain some of these differences. The differences in preferences between the communities is clearly indicated and further confirmed by the _2 test at the 0.01% probability level.
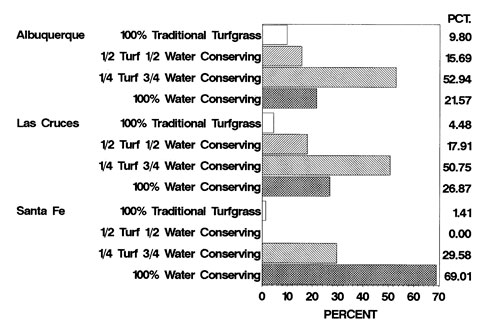
Figure 11. Household's most preferred landscape type.
A follow-up question is asked of homeowners who indicate a preference for landscapes less than 100% water conserving. This question is designed to test the responsiveness of their indicated preference to financial incentives. In this case, the homeowners are asked to consider a 'turf rebate' program that would pay them $1 for every square foot removed from grass and converted to a water-efficient landscape, and then indicate their 'most' preferred landscape under such a program.2
It is clear that some respondents had difficulty with the structure of the question, in that there were more completed responses for this question than the previous question – when just the opposite would be expected after those who chose 100% water-conserving should select out of this part of the question. Nonetheless, it is instructive to examine the results shown in figure 12 and table B-10, which further confirm a clear preference for limiting grass to no more than one-fourth of the landscape. However, the shift in preference is barely observable as the percentage of Albuquerque homeowners indicating a preference for no more than one-fourth of the landscape in grass rises from 74% to 75%, and those in Las Cruces rises from 78% to 79%. Santa Fe still reports above 90% for these types but the share preferring one-fourth grass rises from 30% to nearly 55%.
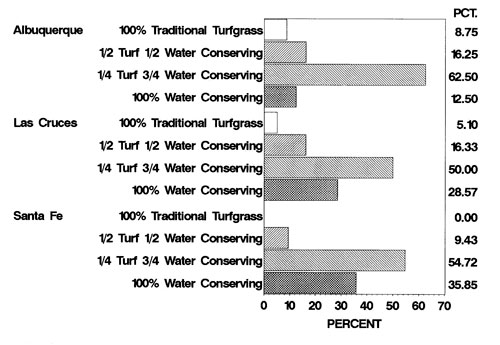
Figure 12. Household's most preferred landscape type when turf rebate is available.
These results suggest that the wording and structure of the questions is confusing, as homeowners may be reflecting a desire to actually have more grass so that they can better take advantage of and receive the cash benefits of the rebate program. These results, perhaps, highlight the conflicting attitudes toward turf rebate programs. On one hand, it is perceived desirable to create incentives to conserve water, however, on the other hand, there may be resentment by some toward such programs by those who have already converted their landscapes (at some expense) and believe that they are penalized as their taxes (or utility payments) are diverted to fund the program.
The context for landscape preference is broadened in Question 11 to include areas surrounding public buildings. Asked in the form of 'advice to city administrators', there is a clear indication of preferences for limiting grass to no more than one-fourth of the area by 93% of respondents as shown in figure 13 and table B-10. For this question there is no discernable community pattern. There is broad community support to limit grass and increase the areas planted to native, natural, and water-conserving landscapes.
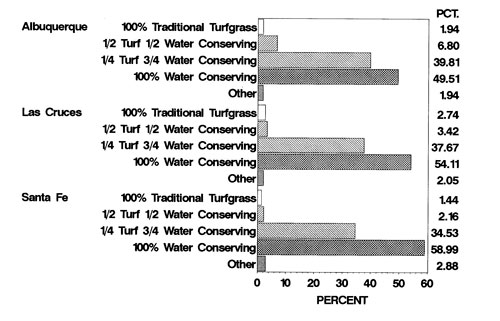
Figure 13. Household's preferred landscape for the public buildings.
In Question 12 the survey asks about homeowner awareness of any local rebate or assistance programs addressing landscape issues. In 1996 the city of Albuquerque, the only city in the study area, began a 'turf to Xeriscape' conversion program that (in 2004) paid qualified homeowners $0.40 per sq. ft .of bluegrass removed and replaced by Xeriscape up to 2,000 sq. ft. ($800), and requires recipients to replace sprinkler irrigation with an efficient system such as drip, soaker or bubbler. Table B-11 shows awareness of the program by 40% of Albuquerque respondents, and shows that 60% either were not aware or did not know if their community offered a program. Neither Las Cruces nor Santa Fe currently offer a turf conversion program; however, Santa Fe has a rebate program for water-efficient appliances that could explain the small percentage (<3%) who indicated program awareness there.
The final section of the survey gathers socio-economic and demographic data on the respondent and their household. These questions provide a snapshot of the household characteristics that underlie the sample. They also provide data that will be helpful in subsequent analyses of landscape choices to identify, for example, if landscape preferences are strongly influenced by characteristics such as age, education, income or residency in the state. These characteristics are shown in tables B-12 through B-18.
One immediate use for these statistics is to evaluate how 'representative' the survey sample is of the households living in single-family dwellings in the three New Mexican cities. To examine this, sample characteristics are compared to those from the 2000 Census as shown in table 4 for each of the three cities across educational attainment, reported income and household composition. Compared to census estimates, the educational levels of the sampled homeowners are significantly higher, with high school graduates exceeding by more than 10 percentage points in each case, and college graduates by more than 20 percentage points. Income shows a consistent and similar skew toward higher relative incomes. Finally, the composition of households shows a consistently higher response from households with retirement-age individuals but no consistent pattern across the cities for children. The most significant anomaly is found in the Las Cruces sample, with the percentage of retirement age households being nearly double the census rate, 45% compared to 23%. From these comparisons it is clear that the survey sample is from an older, more educated and higher income segment of the population than is generally found. Perhaps part of this is explained by confining the sample to single-family homes which in itself may skew toward the older, educated, and higher income-earning share of the population. This may not explain, however, all the variation from the census levels, and perhaps indicates also that the response rates are higher among the more elderly population, which has more time available to complete voluntary surveys and, perhaps, also among the more educated, who may be more inclined to recognize the potential value and usefulness behind such surveys. The findings presented in this report should, therefore, be interpreted with these potential biases in mind.
Finally, table B-19 shows some of the general comments received on the back of the survey. For example, the greatest concentration of comments, numbering eight, reflected negativity toward golf courses and, presumably, their perceived water use excess.
Table 4. Comparison of Selected Sample Characteristics to Those from the 2000 Census
| Characteristic | Albuquerque | Las Cruces | Santa Fe | |||
| Sample | Census | Sample | Census | Sample | Census | |
| Educational Attainment | ||||||
| Percent high school graduate | 97.2 | 85.9 | 94.4 | 80.3 | 96.7 | 84.6 |
| Percent bachelor's degree | 61.5 | 31.8 | 52.4 | 28.4 | 59.8 | 40.0 |
| Income | ||||||
| Percent < $10,000 | 2.1 | 9.9 | 2.9 | 16.0 | 1.3 | 9.5 |
| Percent $10,000-$50,000 | 23.6 | 53.0 | 48.6 | 56.7 | 32.5 | 49.9 |
| Percent $50,000-$100,000 | 42.0 | 27.5 | 38.2 | 22.6 | 44.3 | 28.9 |
| Percent > $100,000 | 32.0 | 9.6 | 9.6 | 4.6 | 21.5 | 11.8 |
| Households with Individuals <18 | 40.6 | 33.3 | 19.1 | 33.8 | 30.1 | 26.8 |
| Households with Individuals >65 | 24.3 | 20.7 | 45.4 | 23.4 | 27.5 | 23.1 |
| Source: U.S. Census Bureau. 2000. Notes: Columns do not sum exactly to 100 due to rounding errors. |
||||||
Conclusions and Next Steps
With continued population growth, New Mexico communities will be increasingly challenged to meet their growing water needs. These challenges are likely to be met with efforts not only to secure additional supplies but balance these supplies with programs and policies that encourage conservation and increase water use efficiency. Based on the limited sample of this study, there are strong indications that New Mexico's residents are increasingly mindful of these challenges and may be growing in their preparedness to shoulder responsibility for stewarding the state's water resources.
The findings further suggest that New Mexico residents are increasingly aware of the role of water in their communities and in their state. Such awareness is very important because it is fundamental to behavior and to behavioral changes and actions that can lead, for example, to less wasteful practices and to the adoption of more water-efficient landscapes. Awareness, therefore, is best viewed as a key community asset that properly should be nourished and enhanced through education, extension and conservation programs. By enhancing community outreach and promoting appropriate landscapes – perhaps through community landscape demonstration projects and landscape guidebooks – the ultimate result may lie in raising the quantity and value of services that limited water supplies can provide and in raising everyone's quality of life.
How households manage and use water to create desired landscapes and outdoor living spaces can be significant — not only in terms of the capacity for residents to shape the look and quality of life of their communities but in the state's overall water-use efficiency. For example, if residential outdoor water use could be cut by one-fourth in just the three communities profiled in this study, annual water savings could approach 6 billion gallons of treated, potable water (approximately 17,000 acre-feet). Conservatively valuing this water-saved at a rate of $1 per thousand gallons yields nearly $6 million to the residents of these communities.
In summary, the study findings support the following key points describing the sample of New Mexico urban households in Albuquerque, Las Cruces and Santa Fe living in single-family homes with municipal water service:
- More than 70% consider water issues as 'among the most important' facing the state and their communities.
- By more than 75%, these homeowners believe that they bear significant responsibility for water conservation.
- The use of water-saving devices is quite widespread, with more than 90% of these households reporting at lease one device such as a low-flow toilet, faucet or showerhead.
- Santa Fe residents tend to identify strongly with relatively more natural and native landscapes. With less than 10% of landscape in lawn, 61% of Santa Fe residents report being content with their existing landscape, more than either Albuquerque (55%) or Las Cruces (56%). This suggests that there is a significant share of households, particularly in Albuquerque and Las Cruces that might consider landscape changes with improved outdoor water-use efficiency.
- There is considerable interest by 15% of these homeowners in learning more about and seeking advice on landscaping. Perhaps this is a potential area for increased extension and outreach.
- More than 80% of these homeowners indicated that water price is an important consideration in landscape decisions, even more than the 55% indicating the importance of community water-conservation programs.
- There is broad support by nearly 95% of these households to use water-efficient landscapes around public buildings.
Next Steps
This report summarizes only the initial findings; additional analyses of these responses are likely to yield further insights concerning landscape preferences within New Mexico's Rio Grande communities. A key aspect of the on-going research is the analysis of landscape preferences using the 'market research' or 'consumer choice' methods summarized earlier. It is anticipated that these analyses will provide a more rigorous assessment of the factors that determine landscape choices.
Key factors in the demand for water-efficient landscapes are expected to include:
- Attitudes and awareness of water scarcity, e.g., perception of the importance of water issues to the community.
- Sense of household responsibility for water conservation.
- Prevalence of existing water-conserving behaviors, e.g., installed water-conserving devices and practices.
- Perceived costs and benefits of landscape types, e.g., water use, water cost, maintenance effort, and maintenance cost.
- Socio-economic characteristics, e.g., number of children, income, education, and length of residency in New Mexico and in current home.
New Mexico residents value the aesthetic characteristics of their homes and desire living spaces, landscapes and environments that are attractive and which enhance their quality of life. In some communities, such as Santa Fe, residents attach significance to the natural environment and to the native feel of their landscapes; whereas in others, the aesthetic balance is met with a blend of landscapes that include lawns. Mindful and deliberate use of water can meet a variety of desired landscapes without waste. The key is to approach landscape decisions with an awareness of the fundamental nature and role of water, to understand the differences in irrigation needs of various types of vegetation and landscape, and to plan for and use water wisely and effectively in meeting the needs of the desired landscape with balance and consideration of the importance of this unique resource.
Footnotes
1The estimated χ2 test statistic tests the hypothesis that there is NO significant difference in the relative frequency of responses across the communities. The estimated value of the test statistic, 38.9 with 8 degrees of freedom, is significant at the 0.01% probability level, thus indicating that the hypothesis is confidently rejected. (back to top)
2This statement is based on observations and comments heard by the author during several public meetings in Las Cruces and Albuquerque in 2004. Some communities have had successful turf-rebate programs including Las Vegas, Nevada and El Paso, Texas. More research is needed to test the significance of any resentment in particular communities. (back to top)
References
Addink, Sylvan. 2005. "Cash for Grass - A Cost Effective Method to Conserve Landscape Water?" University of California, Riverside, Turfgrass Research Facility, http://agops.ucr.edu/turf/, accessed February 23, 2005.
Dillman, D. A. (2000). Mail and Internet Surveys: The Tailored Design Method (2nd Edition). New York: John Wiley & Sons.
Ferguson, B. K. (1987). Water Conservation Methods in Urban Landscape Irrigation: An Exploratory Overview. Water Resources Bulletin, 23, 147-152.
Hartman, R. S., Doane, M. J., & Woo, C.-K. (1991). Consumer Rationality and the Status Quo. Quarterly Journal of Economics, 106, 141-162.
Knopf, J. (2003). Water Wise Landscaping with Trees, Shrubs and Vines: A Xeriscape Guide for the Rocky Mountain Region. Chamisa Books, Boulder, Colo.
Louviere, J. J., Hensher, D. A., & Swait, J. D. (2000). Stated Choice Methods: Analysis and Application. Cambridge: Cambridge University Press.
McFadden, D. (1986). The Choice Theory Approach to Marketing Research. Marketing Science, 5, 275-297.
Sovocool, K. A., Rosales, J. L., & Southern Nevada Water Authority (2004). A Five-Year Investigation Into the Potential Water and Monetary Savings of Residential Xeriscape in the Mojave Desert.
Spinti, J. E., St. Hilaire, R., & VanLeeuwen, D. (2004). Balancing landscape preferences and water conservation in a desert community. HortTechnology, 14, 72-77.
U.S. Census Bureau, Census. 2000. Profile of Selected Social Characteristics: 2000. Albuquerque City, Las Cruces City, and Santa Fe City.
Appendix A: Participant Letters and Survey Instruments
Figure A-1. Cover Letter: English Version
Figure A-2. Cover Letter: Spanish Version
Figure A-3. Reminder Post Card
Figure A-4. Second-mailing cover letter.
Figure A-5. Complete Survey in English: Version 1, Page 1.
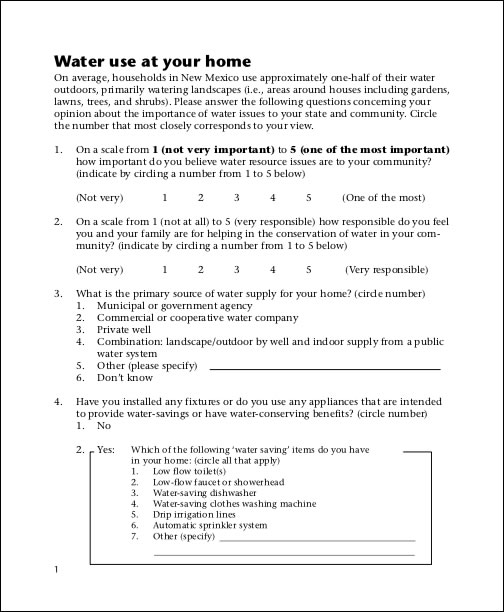
Figure A-6. Complete Survey in English: Version 1, Page 2.
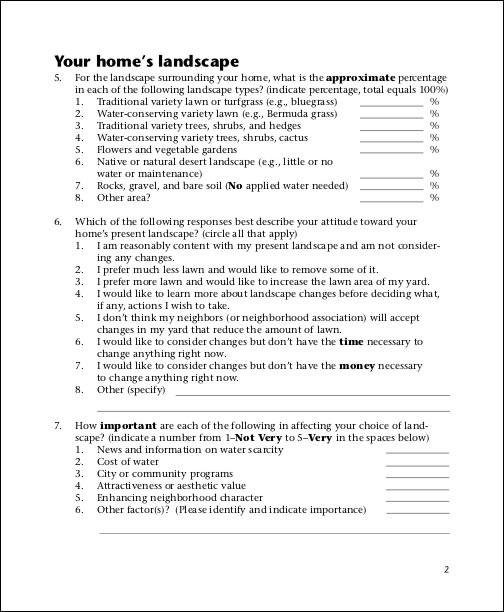
Figure A-7. Complete Survey in English: Version 1, Page 3.

Figure A-8. Complete Survey in English: Version 1, Page 4.
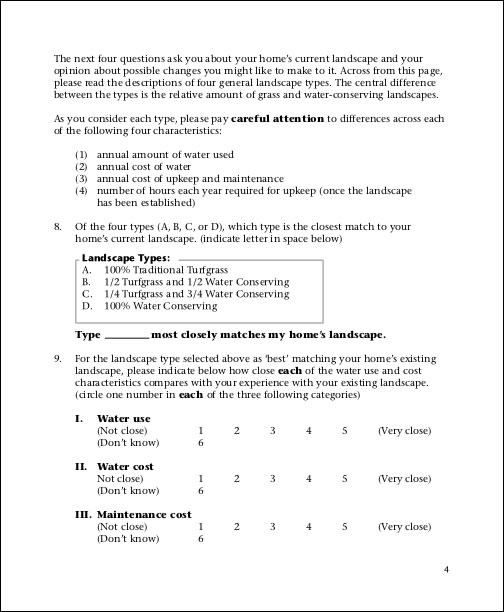
Figure A-9. Complete Survey in English: Version 1, Page 5
 .
.
Figure A-10. Complete Survey in English: Version 1, Page 6.
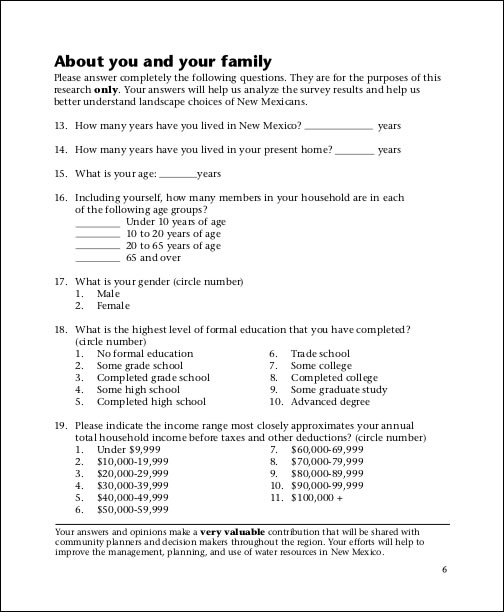
Figure A-11. Complete Survey in English: Version 1, Page 7.
Figure A-12. Complete Survey in English: Version 1, Page 8.

Figure A-13. Partial Survey Version 2, Page 4.

Figure A-14. Partial Survey Version 3, Page 4.
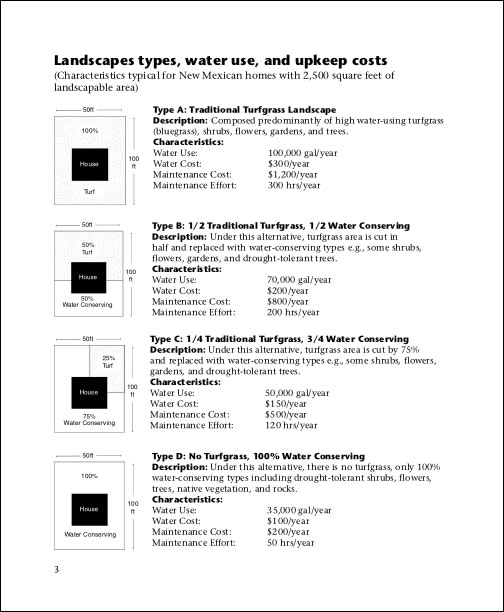
Figure A-15. Partial Survey Version 4, Page 4.
Figure A-16. Complete Survey in Spanish: Version 1, Page 1.
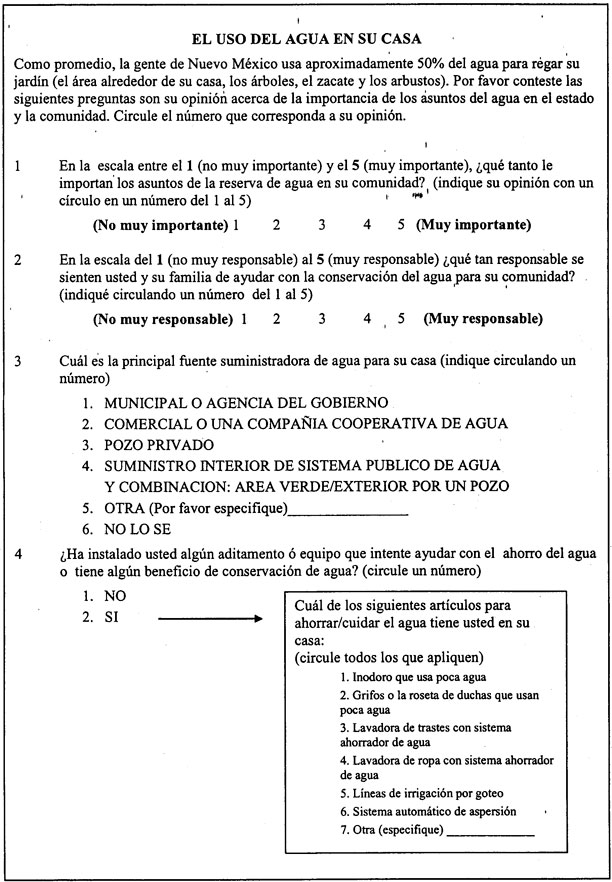
Figure A-17. Complete Survey in Spanish: Version 1, Page 2.
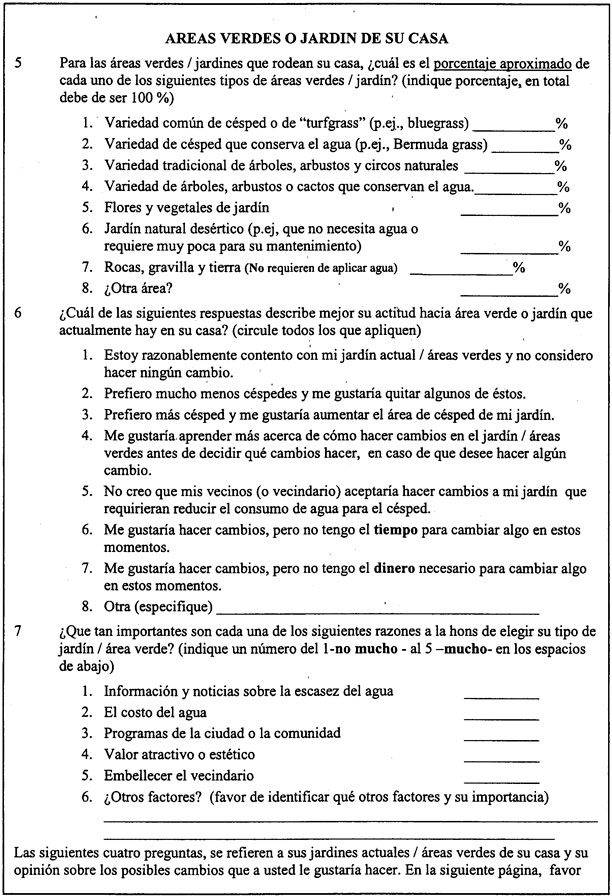
Figure A-18. Complete Survey in Spanish: Version 1, Page 3.
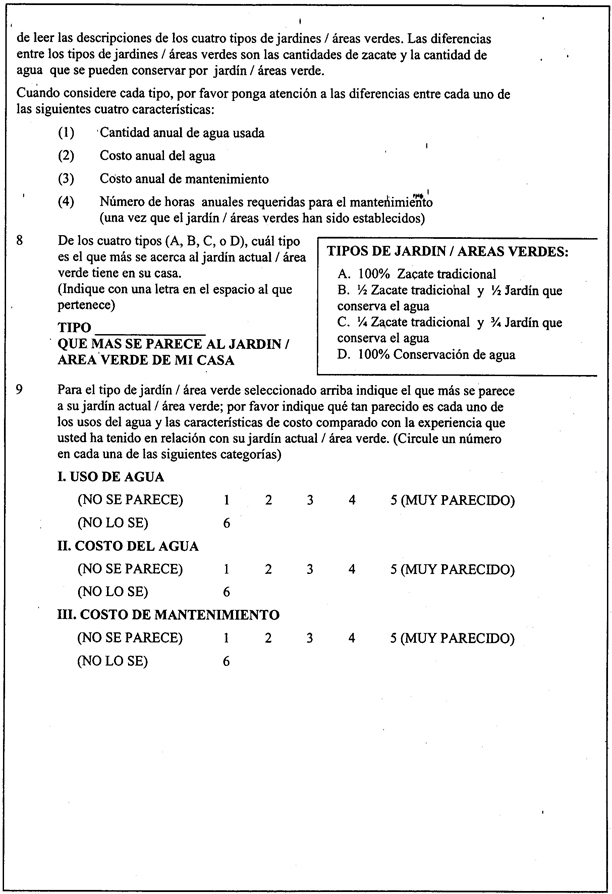
Figure A-19. Complete Survey in Spanish: Version 1, Page 4.
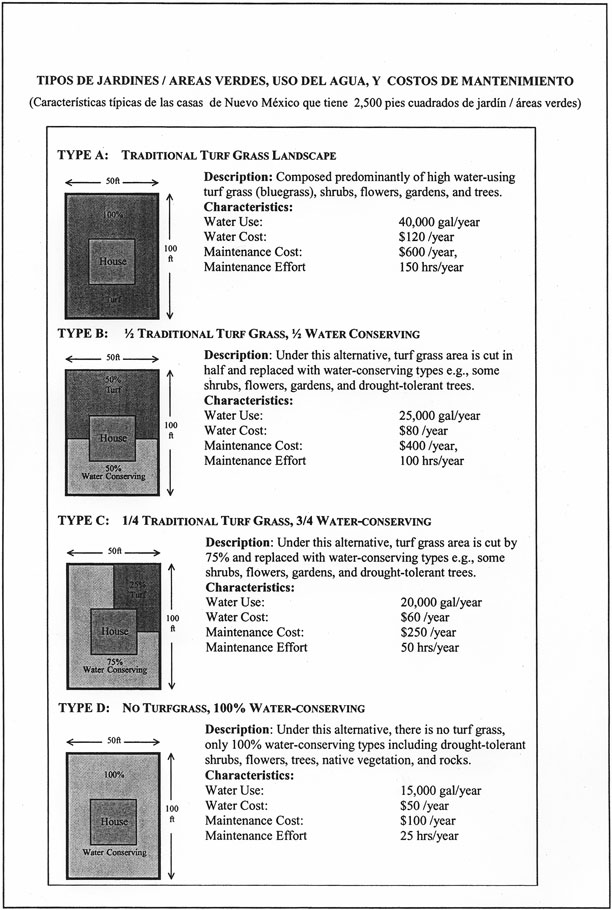
Figure A-20. Complete Survey in Spanish: Version 1, Page 5.
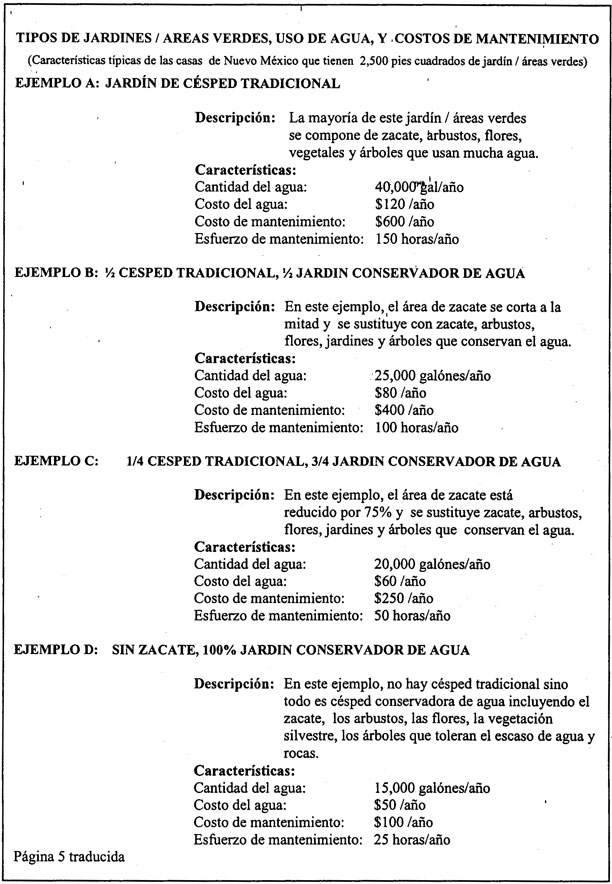
Figure A-21. Complete Survey in Spanish: Version 1, Page 6.
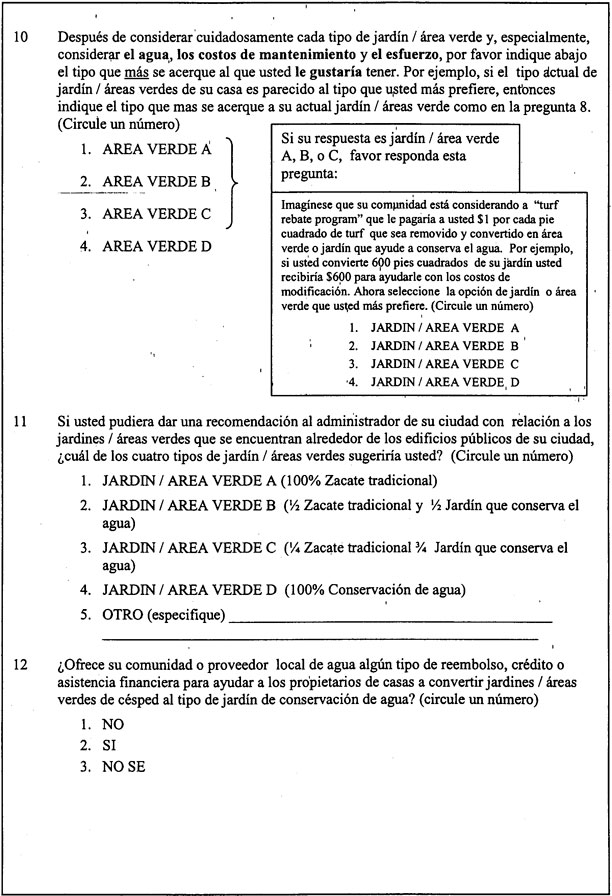
Figure A-22. Complete Survey in Spanish: Version 1, Page 7.
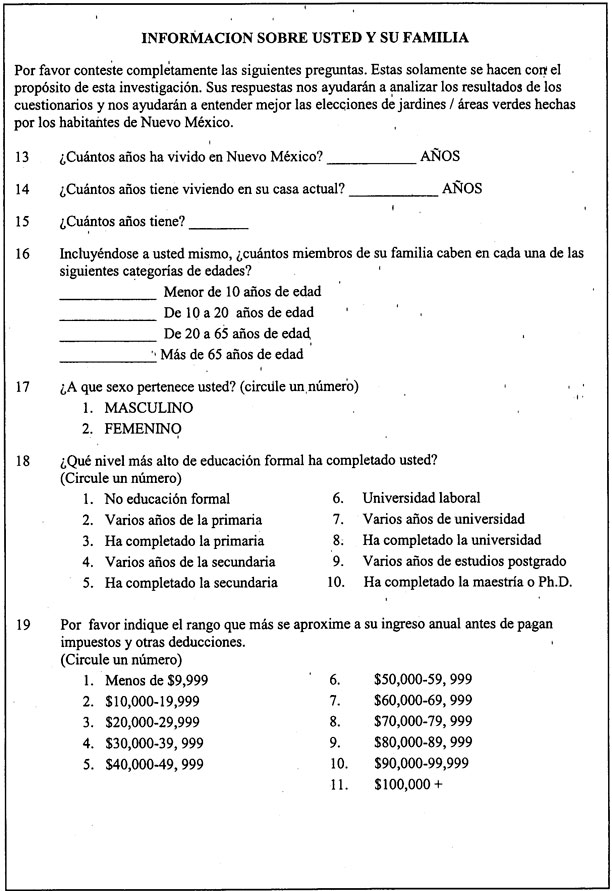
Figure A-23. Complete Survey in Spanish: Version 1, Page 8.
Figure A-24. Complete Survey in Spanish: Version 1, Page 9.
Appendix B: Survey Response Frequency Tables
Table B-1. Response Frequency By City: Perceived Importance of Water Issues
| City | |||||||||
| Albuquerque | Las Cruces | Santa Fe | Total |
Total | |||||
| N | % | N | % | N | % | N | % | ||
| Importance of Water Issues to Community | |||||||||
| Not At All Important | . | . | 3 | 1.9% | . | . | 3 | 0.7% | |
| Not Important | . | . | 6 | 3.9% | 1 | 0.6% | 7 | 1.7% | |
| Slightly Important | 14 | 13.2% | 10 | 6.6% | 6 | 4.0% | 30 | 7.3% | |
| Highly Important | 30 | 28.3% | 27 | 17.8% | 14 | 9.3% | 71 | 17.4% | |
| Among Most Important | 62 | 58.4% | 105 | 69.5% | 128 | 85.9% | 295 | 72.6% | |
| Mean Response (std. dev.) |
106 | 4.45 (0.72) |
151 | 4.49 (0.93) |
149 | 4.81 (0.53) |
407 | 4.60 (0.76) |
|
| Notes: Based on responses to Q1, 'Landscapes, Water Conservation, and Your Home' | |||||||||
Table B-2. Response Frequency By City: Degree of Perceived Household Responsibility
| City | |||||||||
| Albuquerque | Las Cruces | Santa Fe | Total |
Total | |||||
| N | % | N | % | N | % | N | % | ||
| Degree of Responsibility for Conserving Water | |||||||||
| Not At All Important | 1 | 0.9% | 5 | 3.3% | 1 | 0.6% | 7 | 1.7% | |
| Not Important | 3 | 2.8% | 7 | 4.6% | 3 | 2.0% | 13 | 3.2% | |
| Slightly Important | 29 | 27.3% | 30 | 19.8% | 20 | 13.4% | 79 | 19.4% | |
| Highly Important | 52 | 49.0% | 51 | 33.7% | 53 | 35.5% | 156 | 38.4% | |
| Among Most Important | 21 | 19.8% | 58 | 38.4% | 72 | 48.3% | 151 | 37.1% | |
| Mean Response (std. dev.) |
106 | 3.84 (0.81) |
151 | 3.99 (1.04 |
149 | 4.29 (0.82) |
407 | 4.06 (0.92) |
|
| Notes: Based on responses to Q2, 'Landscapes, Water Conservation, and Your Home' | |||||||||
Table B-3. Response Frequency By City: Primary Source of Household Water
| City | |||||||||
| Albuquerque | Las Cruces | Santa Fe | Total |
Total | |||||
| N | % | N | % | N | % | N | % | ||
| Primary Source of Household Water | |||||||||
| Municipal or Government Agency | 74 | 71.1% | 124 | 83.2% | 81 | 54.0% | 279 | 69.2% | |
| Commercial or Cooperative Water Company | 17 | 16.3% | 17 | 11.4% | 22 | 14.6% | 56 | 13.8% | |
| Private Well | 6 | 5.7% | 1 | 0.6% | 41 | 27.3% | 48 | 11.9% | |
| Combination: Well and Public Water | 4 | 3.8% | 4 | 2.6% | 1 | 0.6% | 9 | 2.2% | |
| Other | 1 | 0.9% | 3 | 2.0% | 5 | 3.3% | 9 | 2.2% | |
| Do Not Know | 2 | 1.9% | . | . | . | . | 2 | 0.4% | |
| Notes: Based on responses to Q3, 'Landscapes, Water Conservation, and Your Home' | |||||||||
Table B-4. Response Frequency By City: Household Use of Water Saving Devices
| City | |||||||||
| Albuquerque | Las Cruces | Santa Fe | Total | Total | |||||
| N | % | N | % | N | % | N | % | ||
| Installed Water-saving Fixtures | |||||||||
| No | 8 | 7.5% | 22 | 14.4% | 10 | 6.5% | 40 | 9.7% | |
| Yes | 98 | 92.4% | 130 | 85.5% | 142 | 93.4% | 370 | 90.2% | |
| Mean Response (yes=2, no=1) (std. dev.) |
106 | 1.92 (0.27) |
152 | 1.86 (0.35) |
152 | 1.93 (0.25) |
410 | 1.90 (0.30) |
|
| Low Flow Toilet | |||||||||
| No | 39 | 36.7% | 73 | 48.0% | 35 | 23.1% | 147 | 35.9% | |
| Yes | 67 | 63.2% | 79 | 51.9% | 116 | 76.8% | 262 | 64.0% | |
| Mean Response (yes=2, no=1) (std. dev.) |
106 | 1.63 (0.48) |
152 | 1.51 (0.50) |
151 | 1.68 (0.47) |
409 | 1.57 (0.50) |
|
| Low Flow Faucet or Showerhead | |||||||||
| No | 53 | 50.0% | 74 | 48.6% | 49 | 32.4% | 176 | 43.0% | |
| Yes | 53 | 50.0% | 78 | 51.3% | 102 | 67.5% | 233 | 56.9% | |
| Mean Response (yes=2, no=1) (std. dev.) |
106 | 1.50 (0.50) |
152 | 1.51 (0.50) |
151 | 1.68 (0.47) |
409 | 1.57 (0.50) |
|
| Water-saving Dishwasher | |||||||||
| No | 75 | 70.7% | 103 | 67.7% | 96 | 63.5% | 274 | 66.9% | |
| Yes | 31 | 29.2% | 49 | 32.2% | 55 | 36.4% | 135 | 33.0% | |
| Mean Response (yes=2, no=1) (std. dev.) |
106 | 1.29 (0.46) |
152 | 1.32 (0.47) |
151 | 1.36 (0.48) |
409 | 1.33 (0.47) |
|
| Water-saving Clothes Washing Machine | |||||||||
| No | 87 | 82.0% | 104 | 68.4% | 93 | 61.5% | 284 | 69.4% | |
| Yes | 19 | 17.9% | 48 | 31.5% | 58 | 38.4% | 125 | 30.5% | |
| Mean Response (yes=2, no=1) (std. dev.) |
106 | 1.18 (0.39) |
152 | 1.32 (0.47) |
151 | 1.38 (0.49) |
409 | 1.30 (0.46) |
|
| Drip Irrigation | |||||||||
| No | 45 | 42.4% | 94 | 61.8% | 85 | 56.2% | 224 | 54.7% | |
| Yes | 61 | 57.5% | 58 | 38.1% | 66 | 43.7% | 185 | 45.2% | |
| Mean Response (yes=2, no=1) (std. dev.) |
106 | 1.58 (0.50) |
152 | 1.38 (0.49) |
151 | 1.44 (0.50) |
409 | 1.45 (0.50) |
|
| Automatic Sprinkler System | |||||||||
| No | 37 | 34.9% | 82 | 53.9% | 114 | 75.4% | 233 | 56.9% | |
| Yes | 69 | 65.0% | 70 | 46.0% | 37 | 24.5% | 176 | 43.0% | |
| Mean Response (yes=2, no=1) (std. dev.) |
106 | 1.65 (0.48) |
152 | 1.46 (0.50) |
151 | 1.25 (0.43) |
409 | 1.43 (0.50) |
|
| Other | |||||||||
| No | 101 | 95.2% | 148 | 98.6% | 130 | 86.6% | 379 | 93.3% | |
| Yes | 5 | 4.7% | 2 | 1.3% | 20 | 13.3% | 27 | 6.6% | |
| Mean Response (yes=2, no=1) (std. dev.) |
106 | 1.05 (0.21) |
150 | 1.01 (0.12) |
150 | 1.13 (0.34) |
406 | 1.07 (0.25) |
|
| Notes: Based on responses to Q4, 'Landscapes, Water Conservation, and Your Home' | |||||||||
Table B-5. Response Frequency By City: Current Landscape Composition By Type
| City | |||||||||
| Albuquerque | Las Cruces | Santa Fe | Total | Total | |||||
| N | % | N | % | N | % | N | % | ||
| Traditional Type Lawn (% of yard) | |||||||||
| 0 | 43 | 41.7% | 111 | 77.6% | 113 | 80.7% | 267 | 69.1% | |
| 1%-25% | 20 | 19.4% | 13 | 9.0% | 22 | 15.7% | 55 | 14.2% | |
| 25%-50% | 26 | 25.2% | 10 | 6.9% | 5 | 3.5% | 41 | 10.6% | |
| 51%-75% | 10 | 9.7% | 3 | 2.0% | . | . | 13 | 3.3% | |
| > 75% | 4 | 3.58% | 6 | 4.1% | . | . | 10 | 2.5% | |
| Mean Response (std. dev.) |
103 | 22.9 (26.5) |
143 | 9.68 (22.9) |
140 | 2.85 (8.1) |
386 | 10.8 (21.5 |
|
| Water-conserving Type Lawn (%) | |||||||||
| 0 | 81 | 78.6% | 75 | 52.4% | 106 | 75.7% | 262 | 67.8% | |
| 1%-25% | 14 | 13.5% | 31 | 21.6% | 27 | 19.2% | 72 | 18.6% | |
| 25%-50% | 5 | 4.8% | 17 | 11.8% | 4 | 2.8% | 26 | 6.7% | |
| 51%-75% | 3 | 2.9% | 7 | 4.8% | 2 | 1.4% | 12 | 3.1% | |
| > 75% | . | . | 13 | 9.0% | 1 | 0.7% | 14 | 3.6% | |
| Mean Response (std. dev.) |
103 | 5.1 (13.0) |
143 | 19.6 (28.5) |
140 | 5.56 (14.8) |
386 | 10.6 (21.7) |
|
| Traditional Type Trees and Shrubs (%) | |||||||||
| 0 | 40 | 38.8% | 55 | 38.4% | 61 | 43.5% | 156 | 40.4% | |
| 1%-25% | 55 | 53.3% | 71 | 49.6% | 67 | 47.8% | 193 | 50.0% | |
| 25%-50% | 7 | 6.7% | 11 | 7.6% | 11 | 7.8% | 29 | 7.5% | |
| 51%-75% | . | . | 5 | 3.4% | . | . | 5 | 1.2% | |
| > 75% | 1 | 0.9% | 1 | 0.6% | 1 | 0.7% | 3 | 0.7% | |
| Mean Response (std. dev.) |
103 | 8.97 (13.1) |
143 | 11.75 (16.4) |
140 | 9.29 (13.5) |
386 | 10.1 (14.5) |
|
| Water-conserving Trees and Shrubs (%) | |||||||||
| 0 | 53 | 51.4% | 71 | 49.6% | 59 | 42.1% | 183 | 47.4% | |
| 1%-25% | 42 | 40.7% | 57 | 39.8% | 62 | 44.2% | 161 | 41.7% | |
| 25%-50% | 8 | 7.7% | 11 | 7.6% | 12 | 8.5% | 31 | 8.0% | |
| 51%-75% | . | . | 3 | 2.0% | 4 | 2.8% | 7 | 1.8% | |
| > 75% | . | . | 1 | 0.6% | 3 | 2.1% | 4 | 1.0% | |
| Mean Response (std. dev.) |
103 | 8.27 (12.2) |
143 | 9.9 (16.9) |
140 | 13.34 (16.7) |
386 | 10.7 (17.0) |
|
| Flowers and Vegetable Gardens (%) | |||||||||
| 0 | 37 | 35.9% | 79 | 55.2% | 49 | 35.0% | 165 | 42.7% | |
| 1%-25% | 65 | 63.1% | 58 | 40.5% | 82 | 58.5% | 205 | 53.1% | |
| 25%-50% | 1 | 0.9% | 4 | 2.7% | 7 | 5.0% | 12 | 3.1% | |
| 51%-75% | . | . | . | . | . | . | . | . | |
| > 75% | . | . | 2 | 1.3% | 2 | 1.4% | 4 | 1.0% | |
| Mean Response (std. dev.) |
103 | 6.11 (7.2) |
143 | 6.52 (14.3) |
140 | 8.60 (13.3) |
386 | 7.14% (12.4) |
|
| Native/Natural Desert Landscape (%) | |||||||||
| 0 | 52 | 50.4% | 95 | 66.4% | 45 | 32.1% | 192 | 49.7% | |
| 1%-25% | 29 | 28.1% | 36 | 25.1% | 37 | 26.4% | 102 | 26.4% | |
| 25%-50% | 13 | 12.6% | 7 | 4.8% | 27 | 19.2% | 47 | 12.1% | |
| 51%-75% | 4 | 3.8% | 1 | 0.6% | 9 | 6.4% | 14 | 3.6% | |
| > 75% | 5 | 4.8% | 4 | 2.7% | 22 | 15.7% | 31 | 8.0% | |
| Mean Response (std. dev.) |
103 | 15.51 (24.0) |
143 | 7.96 (17.96) |
140 | 30.77 (32.4) |
386 | 18.2 (27.3) |
|
| Rocks, Gravel, and Bare Soil (%) | |||||||||
| 0 | 20 | 19.4% | 35 | 24.4% | 39 | 27.8% | 94 | 24.3% | |
| 1%-25% | 29 | 28.1% | 29 | 20.2% | 45 | 32.1% | 103 | 26.6% | |
| 25%-50% | 30 | 29.1% | 34 | 23.7% | 26 | 18.5% | 90 | 23.3% | |
| 51%-75% | 15 | 14.5% | 22 | 15.3% | 16 | 11.4% | 53 | 13.7% | |
| > 75% | 9 | 8.7% | 23 | 16.0% | 14 | 10.0% | 46 | 11.9% | |
| Mean Response (std. dev.) |
103 | 33.45 (28.9) |
143 | 37.56 (32.6) |
140 | 29.46 (30.4) |
386 | 33.6 (31.0) |
|
| Other (%) | |||||||||
| 0 | 97 | 94.1% | 125 | 87.4% | 128 | 91.4% | 350 | 90.6% | |
| 1%-25% | 4 | 3.8% | 15 | 10.4% | 8 | 5.7% | 27 | 6.9% | |
| 25%-50% | 1 | 0.9% | 2 | 1.3% | 2 | 1.4% | 5 | 1.2% | |
| 51%-75% | 1 | 0.9% | . | . | 1 | 0.7% | 2 | 0.5% | |
| > 75% | . | . | 1 | 0.6% | 1 | 0.7% | 2 | 0.5% | |
| Mean Response (std. dev.) |
103 | 1.53 (8.5) |
143 | 2.18 (10.7) |
140 | 2.05 (10.6) |
386 | 1.96 (9.9) |
|
| Notes: Based on responses to Q5, 'Landscapes, Water Conservation, and Your Home' Original responses were reported on an open-ended basis, i.e., a continuous range of percentages. | |||||||||
Table B-6. Response Frequency By City: Attitude Towards Current Landscape
| City | |||||||||
| Albuquerque | Las Cruces | Santa Fe | Total | Total | |||||
| N | % | N | % | N | % | N | % | ||
| Content With My Present Landscape | |||||||||
| No | 48 | 45.2% | 66 | 43.7% | 59 | 39.0% | 173 | 42.4% | |
| Yes | 58 | 54.7% | 85 | 56.2% | 92 | 60.9% | 235 | 57.5% | |
| Mean Response (yes=2, no=1) (std. dev.) |
106 | 1.55 (0.50) |
151 | 1.56 (0.50) |
151 | 1.61 (0.49) |
408 | 1.57 (0.50) |
|
| Prefer Much Less Lawn | |||||||||
| No | 90 | 84.9% | 128 | 84.7% | 147 | 97.3% | 365 | 89.4% | |
| Yes | 16 | 15.0% | 23 | 15.2% | 4 | 2.6% | 43 | 10.5% | |
| Mean Response (yes=2, no=1) (std. dev.) |
106 | 1.15 (0.36) |
151 | 1.15 (0.36) |
151 | 1.03 (0.16) |
408 | 1.11 (0.31) |
|
| Prefer More Lawn | |||||||||
| No | 99 | 93.3% | 146 | 96.6% | 149 | 98.6% | 394 | 96.5% | |
| Yes | 7 | 6.6% | 5 | 3.3% | 2 | 1.3% | 14 | 3.4% | |
| Mean Response (yes=2, no=1) (std. dev.) |
106 | 1.07 (0.25) |
151 | 1.03 (0.18) |
151 | 1.01 (0.11) |
408 | 1.03 (0.18) |
|
| Would Like to Learn More | |||||||||
| No | 88 | 83.0% | 130 | 86.0% | 130 | 86.0% | 348 | 85.2% | |
| Yes | 18 | 16.9% | 21 | 13.9% | 21 | 13.9% | 60 | 14.7% | |
| Mean Response (yes=2, no=1) (std. dev.) |
106 | 1.17 (0.38) |
151 | 1.14 (0.35) |
151 | 1.14 (0.35) |
408 | 1.15 (0.35) |
|
| Do Not Believe Neighbors Would Accept Changes That Reduce Lawn | |||||||||
| No | 106 | 100.0% | 151 | 100.0% | 150 | 99.3% | 407 | 99.7% | |
| Yes | . | . | . | . | 1 | 0.6% | 1 | 0.2% | |
| Mean Response (yes=2, no=1) (std. dev.) |
106 | 1.00 (0.00) |
151 | 1.00 (0.00) |
151 | 1.01 (0.09) |
408 | 1.00 (0.05) |
|
| Would Like to Consider Changes But Don't Have the Time | |||||||||
| No | 92 | 86.7% | 129 | 85.4% | 137 | 90.7% | 358 | 87.7% | |
| Yes | 14 | 13.2% | 22 | 14.5% | 14 | 9.2% | 50 | 12.2% | |
| Mean Response (yes=2, no=1) (std. dev.) |
106 | 1.13 (0.34) |
151 | 1.15 (0.35) |
151 | 1.09 (0.29) |
408 | 1.12 (0.33) |
|
| Would Like to Consider Changes But Don't Have the Money | |||||||||
| No | 78 | 73.5% | 106 | 70.1% | 122 | 80.7% | 306 | 75.0% | |
| Yes | 28 | 26.4% | 45 | 29.8% | 29 | 19.2% | 102 | 25.0% | |
| Mean Response (yes=2, no=1) (std. dev.) |
106 | 1.26 (0.44) |
151 | 1.30 (0.46) |
151 | 1.19 (0.40) |
408 | 1.25 (0.43) |
|
| Other | |||||||||
| No | 104 | 98.1% | 142 | 94.6% | 138 | 91.3% | 384 | 94.3% | |
| Yes | 2 | 1.8% | 8 | 5.3% | 13 | 8.6% | 23 | 5.6% | |
| Mean Response (yes=2, no=1) (std. dev.) |
106 | 1.02 (0.14) |
151 | 1.05 (0.23) |
151 | 1.09 (0.28) |
408 | 1.06 (0.23) |
|
| Notes: Based on responses to Q6, 'Landscapes, Water Conservation, and Your Home' | |||||||||
Table B-7. Response Frequency By City: Importance of Factors Influencing Landscape Choice
| City | |||||||||
| Albuquerque | Las Cruces | Santa Fe | Total | Total | |||||
| N | % | N | % | N | % | N | % | ||
| Importance of Water Scarcity News | |||||||||
| Not Very Important | 7 | 7.1% | 10 | 8.0% | 12 | 8.8% | 29 | 8.1% | |
| Slightly Important | 18 | 18.3% | 8 | 6.4% | 11 | 8.0% | 37 | 10.3% | |
| Important | 24 | 24.4% | 28 | 22.5% | 21 | 15.4% | 73 | 20.3% | |
| Strongly Important | 20 | 20.4% | 23 | 18.5% | 23 | 16.9% | 66 | 18.4% | |
| Very Strongly Important | 29 | 29.5% | 55 | 44.3% | 69 | 50.7% | 153 | 42.7% | |
| Mean Response (std. dev.) |
98 | 3.47 (1.29) |
124 | 3.85 (1.28) |
136 | 3.93 (1.34) |
358 | 3.77 (1.32) |
|
| Importance of Water Cost | |||||||||
| Not Very Important | 9 | 9.3% | 1 | 0.7% | 17 | 13.1% | 27 | 7.6% | |
| Slightly Important | 15 | 15.6% | 10 | 7.9% | 13 | 10.0% | 38 | 10.8% | |
| Important | 18 | 18.7% | 26 | 20.6% | 21 | 16.2% | 65 | 18.5% | |
| Strongly Important | 24 | 25.0% | 28 | 22.2% | 23 | 17.8% | 75 | 21.3% | |
| Very Strongly Important | 30 | 31.2% | 61 | 48.4% | 55 | 42.6% | 146 | 41.5% | |
| Mean Response (std. dev.) |
96 | 3.53 (1.33) |
126 | 4.10 (1.04) |
129 | 3.67 (1.44) |
351 | 3.79 (1.30) |
|
| Importance of Community Programs | |||||||||
| Not Very Important | 20 | 21.7% | 32 | 28.3% | 33 | 26.8% | 85 | 25.9% | |
| Slightly Important | 22 | 23.9% | 15 | 13.2% | 22 | 17.8% | 59 | 17.9% | |
| Important | 26 | 28.2% | 38 | 33.6% | 26 | 21.1% | 90 | 27.4% | |
| Strongly Important | 14 | 15.2% | 13 | 11.5% | 18 | 14.6% | 45 | 13.7% | |
| Very Strongly Important | 10 | 10.8% | 15 | 13.2% | 24 | 19.5% | 49 | 14.9% | |
| Mean Response (std. dev.) |
92 | 2.70 (1.27) |
113 | 2.68 (1.35) |
123 | 2.82 (1.47) |
328 | 2.73 (1.38) |
|
| Importance of Aesthetic Values | |||||||||
| Not Very Important | 7 | 7.1% | 10 | 8.4% | 4 | 3.0% | 21 | 6.0% | |
| Slightly Important | 3 | 3.0% | 10 | 8.4% | 11 | 8.4% | 24 | 6.9% | |
| Important | 11 | 11.2% | 26 | 22.0% | 22 | 16.9% | 59 | 17.0% | |
| Strongly Important | 40 | 40.8% | 35 | 29.6% | 39 | 30.0% | 114 | 32.9% | |
| Very Strongly Important | 37 | 37.7% | 37 | 31.3% | 54 | 41.5% | 128 | 36.9% | |
| Mean Response (std. dev.) |
98 | 3.99 (1.13) |
118 | 3.67 (1.24) |
130 | 3.98 (1.10) |
346 | 3.88 (1.16) |
|
| Importance of Enhancing Area | |||||||||
| Not Very Important | 15 | 15.9% | 15 | 13.0% | 18 | 14.7% | 48 | 14.5% | |
| Slightly Important | 15 | 15.9% | 16 | 13.9% | 20 | 16.3% | 51 | 15.4% | |
| Important | 16 | 17.0% | 30 | 26.0% | 30 | 24.45% | 76 | 22.9% | |
| Strongly Important | 26 | 27.6% | 31 | 26.9% | 27 | 22.1% | 84 | 25.3% | |
| Very Strongly Important | 22 | 23.4% | 23 | 20.0% | 27 | 22.1% | 72 | 21.7% | |
| Mean Response (std. dev.) |
94 | 3.27 (1.40) |
115 | 3.27 (1.29) |
122 | 3.20 (1.35) |
331 | 3.24 (1.35) |
|
| Importance of Other Factors | |||||||||
| Not Very Important | 1 | 5.5% | 2 | 10.5% | 5 | 21.7% | 8 | 13.3% | |
| Slightly Important | . | . | . | . | 1 | 4.3% | 1 | 1.6% | |
| Important | 1 | 5.5% | 1 | 5.2% | 3 | 13.0% | 5 | 8.3% | |
| Strongly Important | 5 | 27.7% | 5 | 26.3% | 1 | 4.3% | 11 | 18.3% | |
| Very Strongly Important | 11 | 61.1% | 11 | 57.8% | 13 | 56.5% | 35 | 58.3% | |
| Mean Response (std. dev.) |
18 | 4.39 (1.04) |
19 | 4.21 (1.27) |
23 | 3.70 (1.69) |
59 | 4.07 (1.40) |
|
| Notes: Based on responses to Q7, 'Landscapes, Water Conservation, and Your Home' | |||||||||
Table B-8. Response Frequency By City: Current Landscape Type
| City | |||||||||
| Albuquerque | Las Cruces | Santa Fe | Total | Total | |||||
| N | % | N | % | N | % | N | % | ||
| Current Landscape Type | |||||||||
| 100% Traditional Turfgrass | 11 | 10.1% | 15 | 10.2% | 2 | 1.3% | 28 | 6.9% | |
| 1/2 Turf 1/2 Water Conserving | 31 | 28.7% | 29 | 19.7% | 7 | 4.7% | 67 | 16.6% | |
| 1/4 Turf 3/4 Water Conserving | 40 | 37.0% | 53 | 36.0% | 49 | 33.1% | 142 | 35.2% | |
| 100% Water Conserving | 26 | 24.0% | 50 | 34.0% | 90 | 60.8% | 166 | 41.1% | |
| Mean Response (std. dev.) |
108 | 2.75 (0.94) |
147 | 2.94 (0.97) |
148 | 3.53 (0.65) |
403 | 3.11 (0.92) |
|
| Notes: Based on responses to Q8, 'Landscapes, Water Conservation, and Your Home' | |||||||||
Table B-9. Response Frequency By City: Comparison of Current Landscape Type to Hypothetical
| City | |||||||||
| Albuquerque | Las Cruces | Santa Fe | Total | Total | |||||
| N | % | N | % | N | % | N | % | ||
| Compare Suggested Water Use to Actual | |||||||||
| Not At All Close | 7 | 6.5% | 4 | 2.7% | 15 | 11.1% | 26 | 6.7% | |
| Not Very Close | 7 | 6.5% | 10 | 6.9% | 14 | 10.4% | 31 | 8.0% | |
| Slightly Close | 22 | 20.5% | 17 | 11.8% | 27 | 20.1% | 66 | 17.1% | |
| Reasonably Close | 28 | 26.1% | 35 | 24.4% | 23 | 17.1% | 86 | 22.3% | |
| Very Close | 13 | 12.1% | 12 | 8.3% | 18 | 13.4% | 43 | 11.1% | |
| Do Not Know | 30 | 28.0% | 65 | 45.4% | 37 | 27.6% | 132 | 34.3% | |
| Mean Response (std. dev.) |
107 | 4.15 (1.52) |
143 | 4.65 (1.46) |
134 | 3.94 (1.70) |
384 | 4.26 (1.59) |
|
| Compare Suggested Water Cost to Actual | |||||||||
| Not At All Close | 16 | 15.0% | 10 | 7.0% | 22 | 16.2% | 48 | 12.5% | |
| Not Very Close | 14 | 13.2% | 15 | 10.5% | 17 | 12.5% | 46 | 12.0% | |
| Slightly Close | 16 | 15.0% | 25 | 17.6% | 13 | 9.6% | 54 | 14.0% | |
| Reasonably Close | 27 | 25.4% | 26 | 18.3% | 23 | 17.0% | 76 | 19.8% | |
| Very Close | 8 | 7.5% | 19 | 13.3% | 14 | 10.3% | 41 | 10.7% | |
| Do Not Know | 25 | 23.5% | 47 | 33.0% | 46 | 34.0% | 118 | 30.8% | |
| Mean Response (std. dev.) |
106 | 3.68 (1.73) |
142 | 4.20 (1.63) |
135 | 3.95 (1.89) |
383 | 3.97 (1.76) |
|
| Compare Suggested Maintenance to Actual | |||||||||
| Not At All Close | 13 | 12.1% | 18 | 12.5% | 16 | 11.7% | 47 | 12.1% | |
| Not Very Close | 16 | 14.9% | 15 | 10.4% | 23 | 16.9% | 54 | 13.9% | |
| Slightly Close | 22 | 20.5% | 26 | 18.1% | 28 | 20.5% | 76 | 19.6% | |
| Reasonably Close | 22 | 20.5% | 22 | 15.3% | 21 | 15.4% | 65 | 16.8% | |
| Very Close | 12 | 11.21% | 22 | 15.3% | 18 | 13.2% | 52 | 13.4% | |
| Do Not Know | 22 | 20.5% | 40 | 27.9% | 30 | 22.0% | 92 | 23.8% | |
| Mean Response (std. dev.) |
107 | 3.65 (1.65) |
143 | 3.94 (1.74) |
136 | 3.68 (1.69) |
386 | 3.77 (1.70) |
|
| Notes: Based on responses to Q9, 'Landscapes, Water Conservation, and Your Home' | |||||||||
Table B-10. Response Frequency By City: Most Preferred Landscape Type
| City | |||||||||
| Albuquerque | Las Cruces | Santa Fe | Total | Total | |||||
| N | % | N | % | N | % | N | % | ||
| Most Preferred Landscape Type | |||||||||
| 100% Traditional Turfgrass | 5 | 9.8% | 3 | 4.4% | 1 | 1.4% | 9 | 4.7% | |
| 1/2 Turf 1/2 Water Conserving | 8 | 15.6% | 12 | 17.9% | . | . | 20 | 10.5% | |
| 1/4 Turf 3/4 Water Conserving | 27 | 52.9% | 34 | 50.7% | 21 | 29.5% | 82 | 43.3% | |
| 100% Water Conserving | 11 | 21.5% | 18 | 26.8% | 49 | 69.0% | 78 | 41.2% | |
| Mean Response (std. dev.) |
51 | 2.86 (0.87) |
67 | 3.00 (0.80) |
71 | 3.66 (0.56) |
189 | 3.21 (0.82) |
|
| Most Preferred Landscape Type w/Turf Rebate | |||||||||
| 100% Traditional Turfgrass | 7 | 8.7% | 5 | 5.1% | . | . | 12 | 5.1% | |
| 1/2 Turf 1/2 Water Conserving | 13 | 16.2% | 16 | 16.3% | 5 | 9.4% | 34 | 14.7% | |
| 1/4 Turf 3/4 Water Conserving | 50 | 62.5% | 49 | 50.0% | 29 | 54.7% | 128 | 55.4% | |
| 100% Water Conserving | 10 | 12.5% | 28 | 28.5% | 19 | 35.8% | 57 | 24.6% | |
| Mean Response (std. dev.) |
80 | 2.79 (0.77) |
98 | 3.02 (0.81) |
53 | 3.26 (0.62) |
231 | 3.00 (0.78) |
|
| Suggested Landscape for Public Buildings | |||||||||
| 100% Traditional Turfgrass | 2 | 1.9% | 4 | 2.7% | 2 | 1.4% | 8 | 2.0% | |
| 1/2 Turf 1/2 Water Conserving | 7 | 6.7% | 5 | 3.4% | 3 | 2.1% | 15 | 3.8% | |
| 1/4 Turf 3/4 Water Conserving | 41 | 39.8% | 55 | 37.6% | 48 | 34.5% | 144 | 37.1% | |
| 100% Water Conserving | 51 | 49.5% | 79 | 54.1% | 82 | 58.9% | 212 | 54.6% | |
| Other | 2 | 1.9% | 3 | 2.0% | 4 | 2.8% | 9 | 2.3% | |
| Mean Response (std. dev.) |
103 | 3.43 (0.74) |
146 | 3.49 (0.73) |
139 | 3.60 (0.66) |
388 | 3.51 (0.71) |
|
| Notes: Based on responses to Q10 and Q11, 'Landscapes, Water Conservation, and Your Home' | |||||||||
Table B-11. Response Frequency By City: Knowledge of Existence of Community Turf Reduction Programs
| City | |||||||||
| Albuquerque | Las Cruces | Santa Fe | Total | Total | |||||
| N | % | N | % | N | % | N | % | ||
| Local Turf Reduction Programs | |||||||||
| No | 27 | 25.4% | 79 | 51.9% | 89 | 59.3% | 195 | 47.7% | |
| Yes | 43 | 40.5% | . | . | 4 | 2.6% | 47 | 11.5% | |
| Do Not Know | 36 | 33.9% | 73 | 48.0% | 57 | 38.0% | 166 | 40.6% | |
| Mean Response (no=1, yes=3, DK=3) (std. dev.) |
106 | 2.08 (0.77) |
152 | 1.96 (1.00) |
150 | 1.79 (0.97) |
408 | 1.93 (0.94) |
|
| Notes: Based on responses to Q12, 'Landscapes, Water Conservation, and Your Home' | |||||||||
Table B-12. Response Frequency By City: Years Living in New Mexico
| City | |||||||||
| Albuquerque | Las Cruces | Santa Fe | Total | Total | |||||
| N | % | N | % | N | % | N | % | ||
| Years Living in New Mexico | |||||||||
| 0-3 | 4 | 3.7% | 9 | 5.8% | 6 | 3.9% | 19 | 4.6% | |
| 4-7 | 6 | 5.6% | 12 | 7.8% | 16 | 10.5% | 34 | 8.2% | |
| 8-12 | 13 | 12.1% | 12 | 7.8% | 15 | 9.8% | 40 | 9.7% | |
| > 12 | 84 | 78.5% | 120 | 78.4% | 115 | 75.6% | 319 | 77.4% | |
| Mean Response (std. dev.) |
107 | 31.64 (18.59) |
153 | 33.32 (21.59) |
152 | 31.84 ( 21.54) |
412 | 32.29 (20.80) |
|
| Notes: Based on responses to Q13, 'Landscapes, Water Conservation, and Your Home' | |||||||||
B-13. Response Frequency By City: Years in Present Home
| City | |||||||||
| Albuquerque | Las Cruces | Santa Fe | Total | Total | |||||
| N | % | N | % | N | % | N | % | ||
| Years in Present Home | |||||||||
| 0-3 | 24 | 22.4% | 27 | 17.5% | 29 | 19.2% | 80 | 19.4% | |
| 4-7 | 25 | 23.3% | 27 | 17.5% | 31 | 20.5% | 83 | 20.12% | |
| 8-12 | 14 | 13.0% | 28 | 18.1% | 30 | 19.8% | 72 | 17.4% | |
| > 12 | 44 | 41.1% | 72 | 46.7% | 61 | 40.3% | 177 | 42.9% | |
| Mean Response (std. dev.) |
107 | 13.07 (11.91) |
154 | 16.23 (13.08) |
151 | 14.74 (13.76) |
412 | 14.83 (13.07) |
|
| Notes: Based on responses to Q14, 'Landscapes, Water Conservation, and Your Home' | |||||||||
Table B-14. Response Frequency By City: Respondent Age
| City | |||||||||
| Albuquerque | Las Cruces | Santa Fe | Total | Total | |||||
| N | % | N | % | N | % | N | % | ||
| Age | |||||||||
| 0-20 | . | . | . | . | 1 | 0.6% | 1 | 0.2% | |
| 21-40 | 17 | 15.8% | 17 | 11.4% | 9 | 6.0% | 43 | 10.6% | |
| 41-60 | 59 | 55.1% | 54 | 36.4% | 80 | 53.6% | 193 | 47.7% | |
| > 60 | 31 | 28.9% | 77 | 52.0% | 59 | 39.5% | 167 | 41.3% | |
| Mean Response (std. dev.) |
107 | 54.35 (13.67) |
148 | 60.20 (15.02) |
149 | 57.25 (12.52) |
404 | 57.53 (13.94) |
|
| Notes: Based on responses to Q15, 'Landscapes, Water Conservation, and Your Home' | |||||||||
Table B-15. Response Frequency By City: Number of Members in Household
| City | |||||||||
| Albuquerque | Las Cruces | Santa Fe | Total | Total | |||||
| N | % | N | % | N | % | N | % | ||
| Number of Young Children | |||||||||
| 0 | 88 | 83.0% | 136 | 89.4% | 137 | 89.5% | 361 | 87.8% | |
| 1 | 12 | 11.3% | 6 | 3.9% | 11 | 7.1% | 29 | 7.0% | |
| 2 | 6 | 5.6% | 8 | 5.2% | 4 | 2.6% | 18 | 4.3% | |
| 3 | . | . | 1 | 0.6% | 1 | 0.6% | 2 | 0.4% | |
| 4 | . | . | 1 | 0.6% | . | . | 1 | 0.2% | |
| Mean Response (std. dev.) |
106 | 0.23 (0.54) |
152 | 0.19 (0.62) |
153 | 0.14 (0.46) |
411 | 0.18 (0.54) |
|
| Number of Older Children | |||||||||
| 0 | 73 | 68.8% | 134 | 88.1% | 117 | 76.4% | 324 | 78.8% | |
| 1 | 20 | 18.8% | 9 | 5.9% | 25 | 16.3% | 54 | 13.1% | |
| 2 | 11 | 10.3% | 5 | 3.2% | 8 | 5.2% | 24 | 5.8% | |
| 3 | 2 | 1.8% | 3 | 1.9% | 3 | 1.9% | 8 | 1.9% | |
| 5 | . | . | 1 | 0.6% | . | . | 1 | 0.2% | |
| Mean Response (std. dev.) |
106 | 0.45 (0.76) |
152 | 0.22 (0.70) |
153 | 0.33 (0.67) |
411 | 0.32 (0.71) |
|
| Number of Children | |||||||||
| 0 | 63 | 59.4% | 123 | 80.9% | 107 | 69.9% | 293 | 71.2% | |
| 1-2 | 39 | 36.7% | 22 | 14.4% | 39 | 25.4% | 100 | 24.3% | |
| 3-5 | 4 | 3.7% | 5 | 3.2% | 7 | 4.5% | 16 | 3.8% | |
| > 5 | . | . | 2 | 1.3% | . | . | 2 | 0.4% | |
| Mean Response (std. dev.) |
106 | 0.68 (0.94) |
152 | 0.41 (1.07) |
153 | 0.47 (0.83) |
411 | 0.50 (0.96) |
|
| Number of Non-Retired Adults | |||||||||
| 0 | 23 | 21.4% | 56 | 36.8% | 41 | 26.7% | 120 | 29.1% | |
| 1 | 17 | 15.8% | 35 | 23.0% | 35 | 22.8% | 87 | 21.1% | |
| 2 | 61 | 57.0% | 46 | 30.2% | 64 | 41.8% | 171 | 41.5% | |
| 3 | 3 | 2.8% | 13 | 8.5% | 6 | 3.9% | 22 | 5.3% | |
| 4 | 2 | 1.8% | 1 | 0.6% | 7 | 4.5% | 10 | 2.4% | |
| 5 | 1 | 0.9% | . | . | . | . | 1 | 0.2% | |
| 6 | . | . | 1 | 0.6% | . | . | 1 | 0.2% | |
| Mean Response (std. dev.) |
107 | 1.50 (0.98) |
152 | 1.16 (1.10) |
153 | 1.37 (1.06) |
412 | 1.33 (1.06) |
|
| Number of Retirement Age Citizens | |||||||||
| 0 | 81 | 75.7% | 83 | 54.6% | 111 | 72.5% | 275 | 66.7% | |
| 1 | 14 | 13.0% | 34 | 22.3% | 25 | 16.3% | 73 | 17.7% | |
| 2+ | 12 | 11.2% | 35 | 22.9% | 17 | 11.1% | 64 | 15.4% | |
| Mean Response (std. dev.) |
107 | 0.36 (0.68) |
152 | 0.69 (0.84) |
153 | 0.39 (0.68) |
412 | 0.49 (0.76) |
|
| Notes: Based on responses to Q16, 'Landscapes, Water Conservation, and Your Home' | |||||||||
Table B-16. Response Frequency By City: Gender of Respondent
| City | |||||||||
| Albuquerque | Las Cruces | Santa Fe | Total | Total | |||||
| N | % | N | % | N | % | N | % | ||
| Gender | |||||||||
| Male | 61 | 57.5% | 84 | 54.9% | 75 | 50.0% | 220 | 53.7% | |
| Female | 45 | 42.4% | 69 | 45.0% | 75 | 50.0% | 189 | 46.2% | |
| Mean Response (M=1, F=2) (std. dev.) |
106 | 1.42 (0.50) |
153 | 1.45 (0.50) |
150 | 1.50 (0.50) |
409 | 1.46 (0.50) |
|
| Notes: Based on responses to Q17, 'Landscapes, Water Conservation, and Your Home' | |||||||||
Table B-17. Response Frequency By City: Education Level of Respondent
| City | |||||||||
| Albuquerque | Las Cruces | Santa Fe | Total | Total | |||||
| N | % | N | % | N | % | N | % | ||
| Education | |||||||||
| No Formal Education (1) | 1 | 0.9% | 1 | 0.6% | . | . | 2 | 0.4% | |
| Some Grade School (2) | . | . | 1 | 0.6% | 1 | 0.6% | 2 | 0.4% | |
| Completed Grade School (3) | . | . | 3 | 1.9% | 1 | 0.6% | 4 | 0.9% | |
| Some High School (4) | 1 | 0.9% | 4 | 2.5% | 2 | 1.3% | 7 | 1.6% | |
| Completed High School (5) | 8 | 7.4% | 19 | 12.3% | 8 | 5.2% | 35 | 8.4% | |
| Trade School (6) | 4 | 3.7% | 8 | 5.1% | 3 | 1.9% | 15 | 3.6% | |
| Some College (7) | 27 | 25.2% | 37 | 24.0% | 37 | 24.1% | 101 | 24.3% | |
| Completed College (8) | 20 | 18.6% | 24 | 15.5% | 38 | 24.8% | 82 | 19.8% | |
| Some Graduate Study (9) | 10 | 9.3% | 14 | 9.0% | 18 | 11.7% | 42 | 10.1% | |
| Advanced Degree (10) | 36 | 33.6% | 43 | 27.9% | 45 | 29.4% | 124 | 29.9% | |
| Mean Response (std. dev.) |
107 | 8.11 (1.77) |
154 | 7.65 (2.03) |
153 | 8.14 (1.64) |
414 | 7.95 (1.84) |
|
| Notes: Based on responses to Q18, 'Landscapes, Water Conservation, and Your Home' | |||||||||
Table B-18. Response Frequency By City: Stated Household Income
| City | |||||||||
| Albuquerque | Las Cruces | Santa Fe | Total | Total | |||||
| N | % | N | % | N | % | N | % | ||
| Household Income | |||||||||
| Under $9,999 (1) | 2 | 2.0% | 4 | 2.9% | 2 | 1.3% | 8 | 2.1% | |
| $10,000-19,999 (2) | 5 | 5.1% | 11 | 8.1% | 9 | 6.2% | 25 | 6.6% | |
| $20,000-29,999 (3) | 8 | 8.2% | 24 | 17.7% | 10 | 6.9% | 42 | 11.1% | |
| $30,000-39,999 (4) | 5 | 5.1% | 19 | 14.0% | 14 | 9.7% | 38 | 10.1% | |
| $40,000-49,999 (5) | 5 | 5.1% | 12 | 8.8% | 14 | 9.7% | 31 | 8.2% | |
| $50,000-59,999 (6) | 9 | 9.2% | 17 | 12.5% | 14 | 9.7% | 40 | 10.6% | |
| $60,000-69,999 (7) | 11 | 11.3% | 14 | 10.3% | 15 | 10.4% | 40 | 10.6% | |
| $70,000-79,999 (8) | 6 | 6.1% | 13 | 9.6% | 11 | 7.6% | 30 | 7.9% | |
| $80,000-89,999 (9) | 10 | 10.3% | 4 | 2.9% | 11 | 7.6% | 25 | 6.6% | |
| $90,000-99,999 (10) | 5 | 5.1% | 4 | 2.9% | 13 | 9.0% | 22 | 5.8% | |
| $100,000 + (11) | 31 | 31.9% | 13 | 9.6% | 31 | 21.5% | 75 | 19.9% | |
| Mean Response (std. dev.) |
97 | 7.64 (3.14) |
135 | 5.61 (2.80) |
144 | 7.10 (3.04) |
376 | 6.72 (3.10) |
|
| Notes: Based on responses to Q19, 'Landscapes, Water Conservation, and Your Home' | |||||||||
Table B-19. Response Frequency By City: General Comment
| City | |||||||||
| Albuquerque | Las Cruces | Santa Fe | Total | Total | |||||
| N | % | N | % | N | % | N | % | ||
| General Comment | |||||||||
| 0 | . | . | 1 | 2.3% | . | . | 1 | 1.0% | |
| Send Results | 1 | 4.7% | 1 | 2.3% | 2 | 5.7% | 4 | 4.0% | |
| Positive for survey | . | . | 2 | 4.6% | 1 | 2.8% | 3 | 3.0% | |
| Negative for survey | 1 | 4.7% | 4 | 9.3% | 2 | 5.7% | 7 | 7.0% | |
| Positive regarding conservation | 1 | 4.7% | 10 | 23.2% | 6 | 17.1% | 17 | 17.1% | |
| Negative regarding conservation | 2 | 9.5% | 1 | 2.3% | 1 | 2.8% | 4 | 4.0% | |
| Wants to know/learn more | . | . | 3 | 6.9% | . | . | 3 | 3.0% | |
| Suggestions | 7 | 33.3% | 7 | 16.2% | 13 | 37.1% | 27 | 27.2% | |
| Negative about golf courses | 8 | 38.0% | 12 | 27.9% | 6 | 17.1% | 26 | 26.2% | |
| Unintelligible | . | . | 1 | 2.3% | 4 | 11.4% | 5 | 5.0% | |
| Garden centers should help | . | . | 1 | 2.3% | . | . | 1 | 1.0% | |
| Children need grass to play on | 1 | 4.7% | . | . | . | . | 1 | 1.0% | |
| TOTAL | 21 | 43 | 35 | 99 | |||||
| Notes: Based on responses to Q20, 'Landscapes, Water Conservation, and Your Home' | |||||||||
To find more resources for your business, home, or family, visit the College of Agricultural, Consumer and Environmental Sciences on the World Wide Web at aces.nmsu.edu
Contents of publications may be freely reproduced for educational purposes. All other rights reserved. For permission to use publications for other purposes, contact pubs@nmsu.edu or the authors listed on the publication.
New Mexico State University is an equal opportunity/affirmative action employer and educator. NMSU and the U.S. Department of Agriculture cooperating.
April 2005