LPC-5
Nicholas K. Ashcroft
College of Agricultural, Consumer and Environmental Sciences, New Mexico State University
Author: Policy Analyst, Linebery Policy Center for Natural Resource Management, New Mexico State University. (Print Friendly PDF)
Introduction
During the 2019 New Mexico State Legislative session, the House of Representatives passed a memorial (HM 81) requesting a
“…task force to resolve issues of concern with New Mexico property tax policy regarding nonagricultural lands and the management and conservation of natural resources.”
There have been previous attempts in the legislature to allow nonagricultural lands to be classified under the New Mexico special valuation for agricultural lands (NMSA 7-36-20). Part of the Memorial stated that
“Many other states have successfully implemented property tax measures to slow the loss of agricultural land, water and other natural resources…”
This paper summarizes agriculture- and conservation-related taxes used by the 11 western states in the U.S.1 to inform decision-makers and the New Mexico public about tax structures currently in place in these states. All western states have some type of special valuation for agricultural land taxation. Some also include open space, wildlife, scenic areas, and other natural resources within the agricultural special valuation, or create a different special valuation for these nonagricultural uses. Ultimately the questions regarding property tax special valuation comparisons with other states are:
- Are the tax structures and socioeconomic conditions of western states similar enough to allow for comparison of tax programs?
- Have other states changed their agricultural classification to include nonagricultural uses, or was a separate tax classification implemented under a different special assessment?
- How is success of preferential tax programs evaluated or analyzed?
Comparisons of state tax codes should consider similarities of government services, size, and sources of income. They should also recognize that each state has unique political issues, stressors, resources, and priorities that may vary widely from state to state or county to county. State and local governments typically have four main revenue sources: sales taxes on goods and services, income taxes on individuals and businesses, severance taxes on minerals and natural resources, and property taxes on real or personal property. States may include some or all of these tax types depending on the other sources of income, economics, natural resources, land ownership, population, land values, amenity values, or priorities within the state or local governments.
Table 1 compares the types of taxes and accompanying rates imposed by each western state. This table illustrates how tax sources and tax rates vary between the states. Differences shown in Table 1 may raise questions about the ability to compare tax structures across states. For example, can New Mexico (NM) and Oregon (OR) be reasonably compared when NM has all four types of taxes and OR has no sales tax, but higher tax rates on income and property? Oregon may have a greater dependence on income and property taxes, whereas New Mexico collects from more tax sources, allowing for greater flexibility.
|
Table 1. Comparison of 11 Western States’ Tax Rates and Structure, Including Sales, Income, Property, and Severance Taxes |
|||||
|
Sales Tax Rate |
Income Tax Rates |
Property Tax |
Severance Tax |
||
|
Median home value |
Property tax & percent of value |
Natural resources taxed |
|||
|
Arizona |
5.6% |
2.59–4.54% |
$167,500 |
$1,356 0.80% |
Metalliferous mining Non-metal mining |
|
California |
7.25% |
1–13.3% |
$409,300 |
$3,237 0.79% |
Oil and gas Lumber products |
|
Colorado |
2.9% |
4.63% |
$264,600 |
$1,516 0.57% |
Coal production Metallic minerals Molybdenum Oil and gas Oil shale |
|
Idaho |
6.0% |
1.125–6.925% |
$167,900 |
$1,276 0.76% |
Ores Oil and gas |
|
Montana |
0% |
1–6.9% |
$199,700 |
$1,698 0.85% |
Coal Metal mines Oil and gas Micaceous mineral mines Cement and gypsum Talc, vermiculite, limestone, and garnets Electrical energy |
|
Nevada |
6.85% |
0% |
$191,600 |
$1,478 0.77% |
Minerals Oil and gas |
|
New Mexico |
5.125% |
1.7–4.9% |
$161,600 |
$1,232 0.76% |
Potash and molybdenum Copper Timber Pumice, gypsum, sand, gravel, clay, fluorspar, and other not-metallic minerals Gold, silver, lead, zinc, thorium, and rare earth metals Carbon dioxide Oil and gas |
|
Oregon |
0% |
5–9.9% |
$247,200 |
$2,637 1.06% |
Forest products Oil and gas Small-tract forestland |
|
Utah |
5.95% |
4.95% |
$224,600 |
$1,508 0.67% |
Metals Oil and gas |
|
Washington |
6.5% |
0% |
$269,300 |
$2,860 1.06% |
Food fish Timber |
|
Wyoming |
4% |
0% |
$199,900 |
$1,223 0.61% |
Oil and gas Coal Trona Bentonite, sand, and gravel Uranium |
|
Sources: https://www.kiplinger.com/tool/taxes/T055-S001-kiplinger-tax-map/index.php |
|||||
Property Taxes
Property taxes are more important at the local (county or city) government level (Figure 1) than at the state level (Figure 2), which also complicates the ability to compare state tax codes. Figure 1 demonstrates the total revenue, total taxes, property taxes, and percent of total taxes that comes from property taxes for 10 of the 11 western states. California local governments were not included in Figure 1 because they would have made the graph unreadable. California has general revenue from its own sources of $153.4 billion, total taxes of $83.5 billion, and property taxes collected at $58.7 billion, with property taxes being 70% of the total taxes collected. Local governments in California have total general revenue totaling $53 billion greater than all of the other western states combined. California also collects $23 billion more in total taxes and $19 billion more in property taxes than all of the other 10 western states combined.
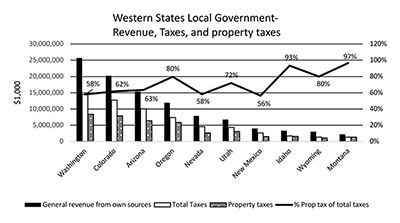
Figure 1. Western states local government general revenue, total taxes, property taxes, and percent of total taxes that are from property taxes (2016).
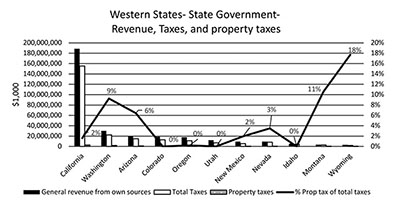
Figure 2. Western states state government general revenue, total taxes, property taxes, and percent of total taxes that are from property taxes (2016).
Differences in Property Taxes: Land Values
Figure 1 shows that local governments depend on property taxes to a greater extent (56–97% of taxes collected) than states for their income. In Montana, for example, 97% of all the taxes collected by local governments are from property taxes, whereas in New Mexico only 56% of the total taxes collected comes from property taxes. Montana also only collects about $1.3 billion in taxes, whereas Washington collects about $14.5 billion and California over $83.5 billion in total taxes. State governments (Figure 2), however, are typically less dependent on property taxes, with some having zero income from property taxes.
Real estate values (Table 2 agricultural asset values) and tax rates can vary among counties, especially rural and highly urbanized areas. Again, California has the highest agricultural land values of all the western states. The amount of open space available, and its value, can also affect local government/population priorities. The taxing powers of highly urbanized areas may feel very protective of their limited open space and support a special valuation for these lands. This will shift taxes to other property types (acceptance of a residential property tax increase or tax shift). However, in rural areas with a large amount of open space or federal lands (Table 3), these communities may not feel the need to maintain open spaces and have a tax shift to other properties.
|
Table 2. Agricultural Land Asset (and Income) Values, Including Buildings, in Dollar Value Per Acre for 11 Western States, as well as New Mexico Counties, 1997–2017 |
||||||||||
|
1997 ($/acre) |
2002 ($/acre) |
2007 ($/acre) |
2012 ($/acre) |
2017 ($/acre) |
||||||
|
State |
Asset |
Income |
Asset |
Income |
Asset |
Income |
Asset |
Income |
Asset |
Income |
|
CALIFORNIA |
2,643 |
755 |
3,526 |
869 |
6,408 |
1,257 |
6,278 |
1,584 |
9,353 |
1,728 |
|
WASHINGTON |
1,292 |
278 |
1,486 |
308 |
1,992 |
403 |
2,299 |
570 |
2,789 |
606 |
|
IDAHO |
1,035 |
256 |
1,270 |
302 |
1,972 |
461 |
2,222 |
636 |
2,866 |
621 |
|
OREGON |
1,025 |
153 |
1,202 |
163 |
1,890 |
240 |
1,882 |
275 |
2,433 |
290 |
|
COLORADO |
629 |
135 |
756 |
134 |
1,046 |
180 |
1,280 |
235 |
1,608 |
227 |
|
UTAH |
600 |
69 |
756 |
89 |
1,249 |
121 |
1,460 |
159 |
1,817 |
185 |
|
ARIZONA |
407 |
72 |
398 |
89 |
748 |
123 |
643 |
154 |
811 |
145 |
|
NEVADA |
398 |
54 |
446 |
67 |
613 |
84 |
927 |
126 |
909 |
106 |
|
MONTANA |
309 |
31 |
386 |
30 |
775 |
43 |
785 |
68 |
916 |
58 |
|
WYOMING |
224 |
25 |
290 |
24 |
513 |
37 |
680 |
54 |
779 |
49 |
|
NEW MEXICO |
208 |
34 |
234 |
36 |
337 |
47 |
432 |
56 |
521 |
60 |
|
New Mexico Counties |
||||||||||
|
BERNALILLO |
511 |
60 |
477 |
48a |
1,335 |
71 |
1,134 |
51 |
2,759 |
334a |
|
CATRON |
117 |
8 |
136 |
5 |
256 |
7 |
427 |
10 |
420 |
7 |
|
CHAVES |
204 |
79a |
212 |
112 |
307 |
136 |
360 |
157a |
473 |
174 |
|
CIBOLA |
131 |
3 |
153 |
2 |
181 |
a |
312 |
a |
317 |
a |
|
COLFAX |
201 |
17 |
224 |
9 |
334 |
21a |
396 |
17a |
505 |
9 |
|
CURRY |
426 |
191 |
526 |
238 |
656 |
383a |
579 |
508a |
695 |
515 |
|
DE BACA |
119 |
18 |
129 |
11a |
230 |
19a |
247 |
23a |
375 |
24a |
|
DOÑA ANA |
1,409 |
404 |
1,565 |
429 |
1,903 |
653 |
1,790 |
524 |
2,484 |
697 |
|
EDDY |
232 |
68 |
255 |
69 |
377 |
85 |
447 |
105 |
591 |
89 |
|
GRANT |
145 |
6 |
186 |
6a |
235 |
6 |
375 |
13 |
487 |
16 |
|
GUADALUPE |
116 |
9 |
104 |
7 |
182 |
8 |
266 |
10 |
311 |
9 |
|
HARDING |
(D) |
11 |
(D) |
11a |
233 |
14 |
283 |
13a |
366 |
14a |
|
HIDALGO |
157 |
19 |
139 |
15 |
169 |
17a |
248 |
31 |
(D) |
28a |
|
LEA |
167 |
30 |
156 |
43 |
224 |
39 |
339 |
95 |
412 |
98 |
|
LINCOLN |
157 |
7 |
184 |
7 |
279 |
7 |
354 |
10 |
498 |
11 |
|
LOS ALAMOS |
(D) |
a |
(D) |
a |
64,349 |
a |
15,268 |
a |
(D) |
a |
|
LUNA |
251 |
95a |
228 |
67a |
350 |
74 |
424 |
113a |
515 |
137 |
|
MCKINLEY |
103 |
3a |
75 |
2a |
130 |
3a |
315 |
3 |
428 |
3 |
|
MORA |
261 |
10 |
309 |
14 |
520 |
7 |
555 |
14 |
552 |
18 |
|
OTERO |
286 |
10a |
241 |
10a |
322 |
13 |
420 |
12a |
439 |
15 |
|
QUAY |
170 |
21 |
180 |
14 |
361 |
23 |
335 |
24 |
352 |
25a |
|
RIO ARRIBA |
275 |
6 |
328 |
5 |
471 |
6 |
724 |
9a |
858 |
8 |
|
ROOSEVELT |
279 |
88 |
265 |
123a |
470 |
164 |
487 |
192 |
457 |
190a |
|
SAN JUAN |
(D) |
a |
324 |
21a |
312 |
34 |
348 |
27 |
402 |
29 |
|
SAN MIGUEL |
214 |
8 |
250 |
6 |
325 |
7 |
377 |
8 |
449 |
8 |
|
SANDOVAL |
212 |
12 |
196 |
7 |
361 |
14 |
523 |
11 |
534 |
15 |
|
SANTA FE |
368 |
22 |
485 |
17 |
669 |
21 |
846 |
17 |
881 |
37a |
|
SIERRA |
222 |
13a |
175 |
14a |
217 |
18a |
286 |
31 |
361 |
31 |
|
SOCORRO |
166 |
16 |
208 |
24a |
276 |
27 |
493 |
60 |
628 |
70 |
|
TAOS |
584 |
10a |
588 |
18a |
623 |
12a |
1,173 |
21 |
1,635 |
21 |
|
TORRANCE |
188 |
19 |
193 |
21 |
331 |
22 |
364 |
30 |
477 |
29 |
|
UNION |
143 |
58 |
200 |
62 |
308 |
60 |
367 |
49 |
413 |
43 |
|
VALENCIA |
590 |
70 |
668 |
47 |
649 |
70 |
942 |
83 |
1,162 |
89 |
|
a All or part of data withheld to avoid disclosure of individual data. (D) Withheld to avoid disclosing data for individual farms. |
||||||||||
Table 2 demonstrates the variability in agricultural land values (including buildings), with California having the greatest value and New Mexico the lowest of the western states. These value differences could be related to value crops on irrigated lands with multiple buildings for sorting or storing crops, while others may be related to demand for land and urban growth. New Mexico counties also demonstrate variablity in agricultural land values, but these appear to be related to urban versus rural land values. These differences would also make tax code comparisons very difficult.
|
Table 3. Total Area (Acres), Land Ownership, Payment in Lieu of Taxes (PILT), Total Population, and Population Density by State and for New Mexico Counties |
||||||||||
|
Total Area of State |
Federal Lands |
State-owned Lands |
Misc. Lands |
Private Lands |
% Private |
PILT Payment, 2018 |
PILT Per Federal Acre, 2018 |
Population Estimate, 2010 (as of July 1) |
People Per Square Mile of Private Land |
|
|
1,000s of acres |
||||||||||
|
NEW JERSEY |
4,748 |
101 |
740 |
63 |
3,845 |
81.0% |
$117,667 |
$1.16 |
8,791,894 |
1,464 |
|
RHODE ISLAND |
669 |
2 |
60 |
3 |
604 |
90.3% |
$0 |
$0.00 |
1,052,567 |
1,115 |
|
MASSACHUSETTS |
5,016 |
46 |
232 |
40 |
4,699 |
93.7% |
$110,915 |
$2.41 |
6,547,629 |
892 |
|
CONNECTICUT |
3,101 |
7 |
173 |
11 |
2,910 |
93.9% |
$32,428 |
$4.78 |
3,574,097 |
786 |
|
NEW YORK |
30,223 |
80 |
11,095 |
262 |
18,787 |
62.2% |
$163,655 |
$2.06 |
19,378,102 |
660 |
|
MARYLAND |
6,256 |
85 |
344 |
111 |
5,717 |
91.4% |
$120,065 |
$1.42 |
5,773,552 |
646 |
|
DELAWARE |
1,251 |
27 |
61 |
4 |
1,159 |
92.6% |
$80,856 |
$2.96 |
897,934 |
496 |
|
FLORIDA |
34,558 |
4,333 |
4,737 |
891 |
24,598 |
71.2% |
$6,571,022 |
$1.52 |
18,801,310 |
489 |
|
CALIFORNIA |
99,823 |
40,045 |
2,244 |
4,136 |
53,398 |
53.5% |
$60,451,685 |
$1.51 |
37,253,956 |
447 |
|
ARIZONA |
72,731 |
29,895 |
9,084 |
21,555 |
12,197 |
16.8% |
$39,929,266 |
$1.34 |
6,392,017 |
335 |
|
PENNSYLVANIA |
28,685 |
572 |
3,657 |
147 |
24,309 |
84.7% |
$1,388,322 |
$2.43 |
12,702,379 |
334 |
|
OHIO |
26,210 |
257 |
422 |
131 |
25,400 |
96.9% |
$540,945 |
$2.11 |
11,536,504 |
291 |
|
HAWAII |
4,111 |
525 |
24 |
231 |
3,331 |
81.0% |
$368,438 |
$0.70 |
1,360,301 |
261 |
|
ILLINOIS |
35,580 |
431 |
406 |
261 |
34,482 |
96.9% |
$1,342,298 |
$3.12 |
12,830,632 |
238 |
|
VIRGINIA |
25,343 |
2,103 |
347 |
407 |
22,486 |
88.7% |
$5,643,252 |
$2.68 |
8,001,024 |
228 |
|
MICHIGAN |
36,358 |
3,680 |
4,489 |
10 |
28,179 |
77.5% |
$5,389,933 |
$1.46 |
9,883,640 |
224 |
|
NORTH CAROLINA |
31,180 |
2,044 |
136 |
473 |
28,526 |
91.5% |
$4,645,116 |
$2.27 |
9,535,483 |
214 |
|
INDIANA |
22,957 |
217 |
306 |
269 |
22,166 |
96.6% |
$806,351 |
$3.72 |
6,483,802 |
187 |
|
GEORGIA |
37,068 |
1,385 |
350 |
904 |
34,429 |
92.9% |
$3,388,005 |
$2.45 |
9,687,653 |
180 |
|
WASHINGTON |
42,613 |
11,648 |
3,865 |
2,679 |
24,420 |
57.3% |
$29,037,327 |
$2.49 |
6,724,540 |
176 |
|
NEW HAMPSHIRE |
5,740 |
744 |
164 |
25 |
4,806 |
83.7% |
$2,036,937 |
$2.74 |
1,316,470 |
175 |
|
TENNESSEE |
26,381 |
1,093 |
1,722 |
261 |
23,305 |
88.3% |
$3,266,219 |
$2.99 |
6,346,105 |
174 |
|
SOUTH CAROLINA |
19,271 |
794 |
206 |
250 |
18,020 |
93.5% |
$1,134,945 |
$1.43 |
4,625,364 |
164 |
|
NEVADA |
70,276 |
56,846 |
126 |
1,435 |
11,869 |
16.9% |
$26,987,166 |
$0.47 |
2,700,551 |
146 |
|
UTAH |
52,588 |
33,195 |
3,825 |
3,138 |
12,430 |
23.6% |
$40,715,865 |
$1.23 |
2,763,885 |
142 |
|
WISCONSIN |
34,761 |
1,988 |
3,646 |
497 |
28,631 |
82.4% |
$3,654,986 |
$1.84 |
5,686,986 |
127 |
|
KENTUCKY |
25,429 |
789 |
111 |
581 |
23,948 |
94.2% |
$3,304,066 |
$4.19 |
4,339,367 |
116 |
|
LOUISIANA |
27,882 |
1,387 |
745 |
278 |
25,473 |
91.4% |
$1,228,654 |
$0.89 |
4,533,372 |
114 |
|
TEXAS |
167,625 |
2,391 |
825 |
2,435 |
161,974 |
96.6% |
$6,512,880 |
$2.72 |
25,145,561 |
99 |
|
ALABAMA |
32,480 |
840 |
396 |
212 |
31,032 |
95.5% |
$1,592,542 |
$1.90 |
4,779,736 |
99 |
|
MISSOURI |
44,095 |
1,625 |
1,030 |
571 |
40,869 |
92.7% |
$4,885,724 |
$3.01 |
5,988,927 |
94 |
|
WEST VIRGINIA |
15,416 |
1,081 |
449 |
140 |
13,745 |
89.2% |
$3,367,942 |
$3.12 |
1,852,994 |
86 |
|
COLORADO |
66,387 |
23,541 |
2,918 |
1,310 |
38,619 |
58.2% |
$40,144,620 |
$1.71 |
5,029,196 |
83 |
|
MINNESOTA |
50,955 |
3,573 |
5,379 |
763 |
41,240 |
80.9% |
$5,156,488 |
$1.44 |
5,303,925 |
82 |
|
VERMONT |
5,919 |
391 |
95 |
6 |
5,427 |
91.7% |
$1,097,519 |
$2.81 |
625,741 |
74 |
|
MISSISSIPPI |
30,025 |
1,545 |
109 |
437 |
27,935 |
93.0% |
$3,452,551 |
$2.23 |
2,967,297 |
68 |
|
ARKANSAS |
33,328 |
3,297 |
653 |
612 |
28,766 |
86.3% |
$7,938,962 |
$2.41 |
2,915,918 |
65 |
|
OREGON |
61,442 |
16,408 |
2,996 |
796 |
41,242 |
67.1% |
$36,915,386 |
$2.25 |
3,831,074 |
59 |
|
IDAHO |
52,961 |
32,496 |
2,748 |
707 |
17,009 |
32.1% |
$36,091,206 |
$1.11 |
1,567,582 |
59 |
|
OKLAHOMA |
43,955 |
571 |
435 |
1,043 |
41,904 |
95.3% |
$3,660,913 |
$6.41 |
3,751,351 |
57 |
|
Table 3 (continued). Total Area (Acres), Land Ownership, Payment in Lieu of Taxes (PILT), Total Population, and Population Density by State and for New Mexico Counties |
||||||||||
|
Total Area of State |
Federal Lands |
State-owned Lands |
Misc. Lands |
Private Lands |
% Private |
PILT Payment, 2018 |
PILT Per Federal Acre, 2018 |
Population Estimate, 2010 (as of July 1) |
People Per Square Mile of Private Land |
|
|
1,000s of acres |
||||||||||
|
IOWA |
35,760 |
104 |
266 |
165 |
35,225 |
98.5% |
$518,365 |
$4.97 |
3,046,355 |
55 |
|
MAINE |
19,754 |
170 |
889 |
181 |
18,514 |
93.7% |
$748,353 |
$4.40 |
1,328,361 |
46 |
|
NEW MEXICO |
77,674 |
22,855 |
8,700 |
9,941 |
36,178 |
46.6% |
$42,630,492 |
$1.87 |
2,059,179 |
36 |
|
KANSAS |
52,367 |
167 |
312 |
480 |
51,407 |
98.2% |
$1,244,595 |
$7.44 |
2,853,118 |
36 |
|
NEBRASKA |
49,202 |
539 |
247 |
82 |
48,334 |
98.2% |
$1,311,052 |
$2.43 |
1,826,341 |
24 |
|
WYOMING |
62,147 |
30,099 |
3,865 |
1,915 |
26,268 |
42.3% |
$31,717,661 |
$1.05 |
563,626 |
14 |
|
SOUTH DAKOTA |
48,575 |
3,570 |
90 |
3,022 |
41,893 |
86.2% |
$7,036,593 |
$1.97 |
814,180 |
12 |
|
ALASKA |
365,039 |
219,900 |
105,800 |
2,206 |
37,134 |
10.2% |
$32,308,994 |
$0.15 |
710,231 |
12 |
|
MONTANA |
93,156 |
27,277 |
5,196 |
3,077 |
57,605 |
61.8% |
$40,073,049 |
$1.47 |
989,415 |
11 |
|
NORTH DAKOTA |
44,156 |
1,375 |
812 |
696 |
41,272 |
93.5% |
$1,788,185 |
$1.30 |
672,591 |
10 |
|
TOTALS: |
2,263,222 |
588,135 |
197,524 |
69,849 |
1,407,714 |
$522,650,456 |
$2.33 |
308,143,815 |
140 |
|
|
Table 3 (continued). Total Area (Acres), Land Ownership, Payment in Lieu of Taxes (PILT), Total Population, and Population Density by State and for New Mexico Counties |
||||||||||
|
Total Area of County |
Federal Lands |
State-owned Lands |
Misc. Lands |
Private Lands |
% Private |
PILT Payment, 2018 |
PILT Per Federal Acre, 2018 |
Population Estimate, 2010 (as of July 1) |
People Per Square Mile of Private Land |
|
|
Acres |
||||||||||
|
LOS ALAMOS |
69,945 |
60,106 |
0 |
74 |
9,764 |
14.0% |
$93,625 |
$1.56 |
17,994 |
1,179.4 |
|
BERNALILLO |
747,764 |
93,944 |
29,722 |
260,656 |
363,441 |
48.6% |
$238,335 |
$2.54 |
663,948 |
1,169.2 |
|
SAN JUAN |
3,548,008 |
889,359 |
122,585 |
2,299,819 |
236,245 |
6.7% |
$2,316,470 |
$2.60 |
130,202 |
352.7 |
|
DOÑA ANA |
2,441,246 |
1,335,834 |
228,689 |
489,934 |
386,789 |
15.8% |
$3,189,584 |
$2.39 |
210,097 |
347.6 |
|
SANDOVAL |
2,377,005 |
1,001,230 |
80,047 |
823,053 |
472,674 |
19.9% |
$2,416,206 |
$2.41 |
132,430 |
179.3 |
|
SANTA FE |
1,222,181 |
316,894 |
79,400 |
100,478 |
725,409 |
59.4% |
$812,453 |
$2.56 |
144,528 |
127.5 |
|
VALENCIA |
683,618 |
44,235 |
29,734 |
138,960 |
470,689 |
68.9% |
$91,858 |
$2.08 |
76,797 |
104.4 |
|
OTERO |
4,238,757 |
2,185,361 |
338,110 |
1,245,915 |
469,371 |
11.1% |
$3,597,259 |
$1.65 |
64,399 |
87.8 |
|
MCKINLEY |
3,494,576 |
440,751 |
187,355 |
2,177,854 |
688,615 |
19.7% |
$1,094,772 |
$2.48 |
71,672 |
66.6 |
|
EDDY |
2,684,707 |
1,579,647 |
508,406 |
0 |
596,654 |
22.2% |
$3,598,621 |
$2.28 |
53,901 |
57.8 |
|
TAOS |
1,409,874 |
768,790 |
78,452 |
116,678 |
445,955 |
31.6% |
$2,036,719 |
$2.65 |
32,896 |
47.2 |
|
CURRY |
900,685 |
0 |
60,174 |
3,466 |
837,046 |
92.9% |
48,963 |
37.4 |
||
|
RIO ARRIBA |
3,772,804 |
1,987,232 |
150,100 |
796,423 |
839,049 |
22.2% |
$3,232,674 |
$1.63 |
40,289 |
30.7 |
|
LEA |
2,811,494 |
423,142 |
951,015 |
0 |
1,437,336 |
51.1% |
$1,128,578 |
$2.67 |
64,599 |
28.8 |
|
LUNA |
1,899,450 |
759,544 |
547,024 |
2,127 |
590,755 |
31.1% |
$1,999,158 |
$2.63 |
25,082 |
27.2 |
|
CHAVES |
3,885,349 |
1,247,629 |
706,192 |
3,589 |
1,927,939 |
49.6% |
$3,225,294 |
$2.59 |
65,727 |
21.8 |
|
GRANT |
2,543,303 |
1,206,863 |
358,837 |
1,654 |
975,948 |
38.4% |
$2,558,024 |
$2.12 |
29,381 |
19.3 |
|
CIBOLA |
2,909,284 |
845,351 |
189,154 |
904,793 |
969,986 |
33.3% |
$2,110,699 |
$2.50 |
27,320 |
18.0 |
|
SIERRA |
2,711,957 |
1,152,710 |
360,920 |
516,118 |
682,209 |
25.2% |
$1,336,642 |
$1.16 |
12,042 |
11.3 |
|
ROOSEVELT |
1,570,701 |
8,391 |
211,714 |
22,181 |
1,328,415 |
84.6% |
$28,709 |
$3.42 |
20,022 |
9.6 |
|
SOCORRO |
4,255,387 |
1,820,599 |
551,421 |
592,978 |
1,290,389 |
30.3% |
$1,735,241 |
$0.95 |
17,789 |
8.8 |
|
LINCOLN |
3,089,753 |
913,677 |
298,878 |
182,156 |
1,695,042 |
54.9% |
$1,889,698 |
$2.07 |
20,453 |
7.7 |
|
SAN MIGUEL |
3,028,675 |
391,176 |
194,741 |
801 |
2,441,957 |
80.6% |
$1,040,459 |
$2.66 |
29,398 |
7.7 |
|
TORRANCE |
2,139,935 |
172,029 |
372,860 |
16,578 |
1,578,468 |
73.8% |
$425,806 |
$2.48 |
16,399 |
6.6 |
|
COLFAX |
2,409,617 |
79,920 |
274,351 |
233 |
2,055,113 |
85.3% |
$197,367 |
$2.47 |
13,733 |
4.3 |
|
QUAY |
1,843,710 |
2,016 |
219,010 |
0 |
1,622,684 |
88.0% |
$4,840 |
$2.40 |
9,066 |
3.6 |
|
HIDALGO |
2,208,951 |
930,602 |
376,968 |
0 |
901,380 |
40.8% |
$739,903 |
$0.80 |
4,864 |
3.5 |
|
MORA |
1,236,478 |
112,720 |
76,316 |
0 |
1,047,442 |
84.7% |
$306,596 |
$2.72 |
4,893 |
3.0 |
|
CATRON |
4,440,051 |
2,780,068 |
513,142 |
12,662 |
1,134,179 |
25.5% |
$639,528 |
$0.23 |
3,750 |
2.1 |
|
GUADALUPE |
1,938,669 |
51,587 |
160,399 |
11,813 |
1,714,870 |
88.5% |
$162,226 |
$3.14 |
4,693 |
1.8 |
|
UNION |
2,450,811 |
58,819 |
446,872 |
0 |
1,945,120 |
79.4% |
$155,864 |
$2.65 |
4,542 |
1.5 |
|
DE BACA |
1,492,636 |
44,500 |
242,291 |
0 |
1,205,845 |
80.8% |
$110,516 |
$2.48 |
2,029 |
1.1 |
|
HARDING |
1,359,932 |
70,588 |
357,163 |
0 |
932,181 |
68.5% |
$116,768 |
$1.65 |
690 |
0.5 |
|
TOTALS: |
77,817,312 |
23,775,316 |
9,302,042 |
10,720,995 |
34,018,959 |
$42,630,492 |
$2.17 |
2,064,588 |
38.8 |
|
|
Sources: Public Land Ownership by State: https://www.nrcm.org/documents/publiclandownership.pdf; U.S. Department of Interior, Payment in Lieu of Taxes: https://www.doi.gov/pilt; U.S. Census Bureau: https://www.census.gov/data/tables/2010/dec/density-data-text.html |
||||||||||
The potential for urban growth, i.e., use changes, typically increases land values and property tax assessments on all property except for agricultural lands, which are taxed on the potential agricultural production of the land. Development pressure often increases sale prices and conversion of the land from agriculture to other uses, especially in areas of high population and economic growth. All western states have implemented some type of special agricultural property assessment that generates lower tax obligations than traditional market value assessments. “The purposes of these ‘differential tax assessment’ laws for farmland are varied, and can be to maintain the economic viability of farming, remove incentives to develop agricultural land, protect environmental benefits of farmland, and tax agricultural land according to its cost of community services”(https://nationalaglawcenter.org/state-compilations/differentialtaxassessment/). These differential tax assessments also provide for open space, wildlife habitat, and water and air quality while supporting rural economies.
Differences in Property Taxes: Land Ownership
Table 3 contains data on the total land area, amount of federal land, state-owned land, miscellaneous land (Tribal and Department of Defense lands), and private lands of all 50 states and New Mexico counties. The amount of private land (taxable property) within each state or county is also a variable that could complicate tax structure comparisons. Montana has the second-highest amount of private land in the group and a greater land area than the entire state of Idaho, but it collects the smallest total taxes of all western states. In contrast, Nevada has the least amount of private land of the western states, but collects three times as much in total taxes as Montana. Nevada also has a population of 2.7 million, which is greater than Montana.
New Mexico has over 22 million acres of federal land, which is about the same size as the entire state of Indiana. These federal lands will not be developed unless transferred out of government ownership, which is unlikely. New Mexico therefore already has a large amount of open space, which may diminish the priority of protecting open spaces.
Differences in Property Taxes: Population/Population Density
Population is another variable that would likely help evaluate the pressure to change the use of agricultural lands. People per square mile of private land was calculated to provide a common denominator for comparison. It is assumed that high population densities would increase land values and potential pressure for development. This assumption appears to hold true for California, which has the highest population density (private lands), with 447 people per square mile, and the highest value of agricultural lands and buildings of the western states ($9,353/ac). However, the assumption does not hold true for Arizona, which has 335 people per square mile and is ranked just under California, but ranks 7th for highest agricultural land values in the western states.
The population density assumption also appears to hold true for the top two New Mexico counties, Los Alamos and Bernalillo. However, San Juan County has the 3rd highest population density, but ranks 26th for agricultural land values. This is possibly due to the large portion of this county that lies in the Navajo Nation (not private land, but occupied). These anomalies demonstrate the differences and difficulty in equitably comparing states or counties for success of a tax program.
Federal lands are not taxed and therefore limit income potential for state and local governments through taxation. Local governments receive “Payments in Lieu of Taxes” (PILT) from the federal government, which are intended to offset some of the impact to local governments that have federal lands in their jurisdiction (Table 3). However, the formula for calculating PILT also includes an adjustment for population, and counties with high amounts of federal land and low populations (e.g., Catron and Hidalgo) therefore receive lower PILT payments. However, the impacts on these counties are unclear because they may have lower costs for services to a smaller population, or their costs may be higher because of the wide dispersion of the population. These lands also provide for multiple uses, open space, and wildlife habitat that contributes to the local economy through tourism and natural resource industries that likely contribute to the tax base with sales and income taxes.
All of the western states have developed some type of agricultural special valuation for tax purposes and typically tax the land based on its production value rather than market value, which may be driven by speculation. Other similarities among agricultural land assessments among western states include the expectation of land uses that are economically productive by using terms such as monetary profit, commercial purpose, or income from agricultural products.
California is the only western state that allows nonagricultural purpose assessment within the agricultural classification; however, local governments are required to hold public meetings and zone or designate the areas for agricultural use. It is also not mandatory that the county or municipality participate in the program.
As demonstrated in Appendix A, lands qualified as agricultural for property tax purposes vary in acreages, income requirements, inclusion of farm residents, and processing products. Some states have rollback taxes and penalties for converting use or not reporting changes in use. A few states include forest or timberland under agriculture (requires forest products), while others classify forested lands under a separate classification.
Conclusion
In addition to the differences identified within this report, an analysis of the success of a tax program is inherently difficult due to the lack of information pertaining to the amount of eligible acreages, level of participation, land productivity, income per acre, landowner motivations, and noneconomic benefits to society. Additionally, states may have developed tax programs to accomplish one or more objectives that can differ from state to state, and each state differs in assessment values and tax rates. Analytically comparing impacts of “with” and “without” a special tax assessment can become difficult to quantify, especially due to unrelated social and economic changes that can complicate the results.
Literature Cited
Arizona Revised Statutes. n.d. Title 42 – Taxation. Retrieved February 5, 2019, from https://www.azleg.gov/arsDetail/?title=42
Bachelor, E., and P.K. Hall (compilers). n.d. States’ differential tax assessment of agricultural lands statute: Arizona. The National Agricultural Law Center. Retrieved April 30, 2019, from https://nationalaglawcenter.org/wp-content/uploads//assets/taxdifferential/arizona.pdf
California Code. n.d. Retrieved May 7, 2019, from https://leginfo.legislature.ca.gov/faces/codes.xhtml
Colorado Revised Statutes Annotated. n.d. Retrieved February 4, 2019, from https://advance.lexis.com/container?config=0345494EJAA5ZjE0MDIyYy1kNzZkLTRkNzktYTkxMS04YmJhNjBlNWUwYzYKAFBvZENhdGFsb2e4CaPI4cak6laXLCWyLBO9&crid=10dfc329-2fcd-4fec-a39f-c6efbaf34719&prid=76cbaaa2-3d7d-4c84-abb0-e6258e8dac0e
Idaho Statutes. n.d. Title 63 Revenue and Taxation, Chapter 6 Exemptions from Taxation. Retrieved May 20, 2019, from https://legislature.idaho.gov/statutesrules/idstat/Title63/T63CH6/
Kiplinger. 2021, November. State-by-state guide to taxes on middle-class families. Retrieved May 15, 2019, from https://www.kiplinger.com/tool/taxes/T055-S001-kiplinger-tax-map/index.php
Montana Code Annotated. 2021. Retrieved July 1, 2019, from https://leg.mt.gov/bills/mca/title_0150/chapters_index.html
Natural Resource Council of Maine. n.d. Public land ownership by state. Retrieved August 12, 2019, from https://www.nrcm.org/documents/publiclandownership.pdf
Nevada Revised Statutes. n.d. Chapter 361A – Taxes on agricultural real property and open space. Retrieved July 11, 2019, from https://www.leg.state.nv.us/NRS/NRS-361A.html
New Mexico Legislative Session. 2019. House Memorial 81 (HM 81), “RESOLVE CERTAIN PROPERTY TAX ISSUES.” Retrieved April 29, 2019, from https://www.nmlegis.gov/Legislation/Legislation?chamber=H&legType=M&legNo=81&year=19
New Mexico Statutes Annotated. 1978. Retrieved February 8, 2019, from https://nmonesource.com/nmos/nmsa/en/nav_date.do
Oregon Revised Statutes. 2021. Retrieved February 6, 2019, from https://www.oregonlegislature.gov/bills_laws/pages/ors.aspx
Revised Code of Washington. n.d. Title 84 Property taxes. Retrieved February 8, 2019, from https://apps.leg.wa.gov/rcw/default.aspx?Cite=84
Tax Policy Center. 2020, May. The state of state (and local) tax policy. Retrieved August 23, 2019, from https://www.taxpolicycenter.org/briefing-book/how-do-state-and-local-property-taxes-work
The Council of State Governments. n.d. State severance taxes, 2017. Retrieved May 14, 2019, from http://knowledgecenter.csg.org/kc/system/files/7.15.2017.pdf
U.S. Census Bureau. 2010. Historical population density data. Retrieved May 10, 2019, from https://www.census.gov/data/tables/2010/dec/density-data-text.html
U.S. Census Bureau. 2016. 2016 state & local government finance historical datasets and tables. Retrieved May 10, 2019, from https://www.census.gov/data/datasets/2016/econ/local/public-use-datasets.html
U.S. Department of Agriculture, National Agricultural Statistics Service. n.d. Quick stats tools. Retrieved May 2, 2019, from https://www.nass.usda.gov/Quick_Stats/
U.S. Department of the Interior. n.d. Payment in lieu of taxes. Retrieved May 10, 2019, from https://www.doi.gov/pilt
Utah Code. 2017. Title 59 Revenue and Taxation, Chapter 2 Property Tax Act, Part 5 Farmland Assessment Act. Retrieved February 4, 2019, from https://le.utah.gov/xcode/Title59/Chapter2/59-2-P5.html?v=C59-2-P5_1800010118000101
Wyoming Statutes Annotated. n.d. Retrieved February 7, 2019, from https://advance.lexis.com/container?config=00JAAzZmQ5YjBjOC1hNDdjLTQxNGMtYmExZi0wYzZlYWIxMmM5YzcKAFBvZENhdGFsb2cJAHazmy52H3XVa9c97KcS&crid=769d8553-edc9-4f26-af56-a7090a6ed006&prid=4c318ab6-59d1-4e42-ad23-6f026b7191c9
Appendix A
This appendix summarizes (excerpts) the agricultural property taxes for western states. The individual condensed state summaries of agricultural taxes are presented with definitions and/or requirements to qualify for the agricultural property special valuation method and any penalty or rollback taxes that might be associated with the program (explicit tax code is available through the links provided). If other special valuations for open space or wildlife habitat are available within these states, they are noted.
Arizona
“Agricultural real property” (Class 2) means real property that is one or more of the following:
- Cropland
- Permanent crops
- Grazing land
- Commercial breeding, raising, boarding, or training equines
- Devoted to high-density use for producing commodities
- Devoted to use in processing cotton necessary for marketing
- Devoted to use in processing wine grapes for marketing
- Devoted to use in processing citrus for marketing
- Devoted to use as fruit or vegetable commodity packing plants that do not cut or otherwise physically alter the produce
- Owned by a dairy cooperative devoted to high-density use in producing, transporting, receiving, processing, storing, marketing, and selling milk and manufactured milk products without the presence of any animal units on the land
- At least five acres and improvements devoted to algaculture (the controlled propagation, growth, and harvest of algae)
Ariz. Rev. Stat. §42-12151
Criteria
- Land in production at least 3 of last 5 years:
- Inactive not more than 12 months as a result of acts of God
- Inactive as a result of participation in:
- Federal farm program
- Scheduled crop rotation
- Federal farm program
- Inactive not more than 12 months as a result of acts of God
- Reasonable expectation of operating profit
Ariz. Rev. Stat. §42-12152
Recapture and penalty for false information or failure to notify of change in use:
- Immediately valued at its nonagricultural full cash value
- Owner liable for difference between the nonagricultural full cash value and the full cash value of the property for all tax years the property was classified based on the false information
- Also pay a penalty equal to 25% of the additional taxes computed
Ariz. Rev. Stat. §42-12157
Arizona has nine tax classifications; Class 2 also includes property owned by nonprofit organizations and golf courses.
https://www.azleg.gov/arsDetail/?title=42
https://nationalaglawcenter.org/state-compilations/differentialtaxassessment/
California
California does not have a statewide special valuation for assessing agricultural lands, but instead leaves it up to the county or city to determine and establish agricultural preserves within their individual jurisdictions.
“Agricultural preserve” means an area devoted to either agricultural use, recreational use, or open space use, or any combination of these uses. “Agricultural use” means use of land, including but not limited to greenhouses, for the purpose of producing an agricultural commodity for commercial purposes.
“Recreational use” is the use of land in its agricultural or natural state by the public, with or without charge, for any of the following: walking, hiking, picnicking, camping, swimming, boating, fishing, hunting, or other outdoor games or sports for which facilities are provided for public participation. Any fee charged for the recreational use of land … shall be in a reasonable amount and shall not have the effect of unduly limiting its use by the public.
“Open space use” is the use or maintenance of land in a manner that preserves its natural characteristics, beauty, or openness for the benefit and enjoyment of the public; to provide habitat for wildlife; or for the solar evaporation of seawater in the course of salt production for commercial purposes, if the land is within:
- A scenic highway corridor
- A wildlife habitat area
- A saltpond
- A managed wetland area
- A submerged area
- An area enrolled in the United States Department of Agriculture Conservation Reserve Program or Conservation Reserve Enhancement Program
California Government Code (GOV) Title 5. Division 1, Part 1, Chapter 7, Article 1
Agricultural preserves may be established by any county or city with a resolution and public hearing. Preserves are established to define the areas that the city or county are willing to enter into contracts on lands that are:
- Not less than 100 acres; two or more parcels may be combined, may also include land zoned as timberland production, or
- Preserves with less than 100 acres that are necessary due to unique characteristics of agricultural enterprise and is consistent with general plan of county or city.
Agricultural preserves may contain lands other than agricultural land but:
- Are restricted by zoning, including minimum parcel sizes,
- Compatible with the agricultural use of the land, and
- Uses are limited by contract.
California Government Code (GOV) Title 5. Division 1, Part 1, Chapter 7, Article 2.5
Contracts limit the use of agricultural lands and may provide for restrictions, terms, and conditions, including payments and fees. Contracts require:
- That the land is devoted to agricultural use,
- Located within an area designated as an agricultural preserve,
- Excludes uses other than agriculture or compatible with agricultural use, and
- Be binding.
Each contract shall be:
- For an initial term of no less than 10 years and provide that on the anniversary date each year that one year shall be added automatically, unless there is a notice of nonrenewal.
- Enforceable contracts are necessary to permit the preferential taxation.
Breach of contract:
- Monetary penalty shall be 25% of the unrestricted fair market value.
- Plus 25% of the value of the incompatible building and related improvements.
California Government Code (GOV) Title 5. Division 1, Part 1, Chapter 7, Article 3
Farmland Security Zone:
- Board-created zone
- Requested by the landowner
- Land not within city sphere of influence, unless approved by resolution of city
- Contract term no less than 20 years, with annual automatic increase of one year
- Value of assessment—65% of the capitalization of income method or full cash value, whichever is lower. Cancellation fee—25% of the cancellation valuation of the property.
California Government Code (GOV) Title 5. Division 1, Part 1, Chapter 7, Article 7
Nonrenewal:
- Contract remains in effect for the time period remaining
- Each year the assessed value is determined by adding the capitalization of income value and the discounted (number of years remaining in contract) value of the full cash value minus the capitalization of income value, until the end of the contract.
California Revised & Tax Code (RAC) Division 1, Part 2, Chapter 3, Article 1.5
https://leginfo.legislature.ca.gov/faces/codes.xhtml
Colorado
“Agriculture” means farming, ranching, animal husbandry, and horticulture.
“Agricultural land” means one of the following:
- Used previous two years and presently as a farm or ranch and eligible for classification during 10 years preceding assessment or in the process of being restored through conservation practices.
- “Farm” means a parcel of land which is used to produce agricultural products that originate from the land’s productivity for the primary purpose of obtaining a monetary profit.
- “Ranch” means a parcel of land which is used for grazing livestock for the primary purpose of obtaining a monetary profit.
- “Livestock” means domestic animals which are used for food for human or animal consumption, breeding, draft, or profit.
- “In the process of being restored through conservation practices”:
- Placed in a conservation reserve program established by the Natural Resource Conservation Service or
- A conservation plan approved by the appropriate conservation district for a ten-year period.
- Placed in a conservation reserve program established by the Natural Resource Conservation Service or
- “Farm” means a parcel of land which is used to produce agricultural products that originate from the land’s productivity for the primary purpose of obtaining a monetary profit.
- Residential improvement deemed to be “integral to an agricultural operation.”
- At least forty acres, that is forest land, that is used to produce tangible wood products that originate from the productivity of such land for the primary purpose of obtaining a monetary profit, that is subject to a forest management plan, and that is not a farm or ranch.
- At least eighty acres, or of less than eighty acres if such parcel does not contain any residential improvements, and that is subject to a perpetual conservation easement, if such land was classified by the assessor as agricultural land at the time such easement was granted.
- Used as a farm or ranch, if the owner of the land has a decreed right to appropriated water or a final permit to appropriated groundwater for purposes other than residential purposes, and water appropriated under such right or permit shall be and is used for the production of agricultural or livestock products on such land.
- Has been reclassified from agricultural land to a classification other than agricultural land and that met the definition of agricultural land during the three years before the year of assessment.
- “All other agricultural property” includes greenhouse and nursery production areas used to grow food products, agricultural products, or horticultural stock for wholesale purposes.
Cultivation of medical marijuana is not classified as agricultural land.
If a parcel of land is classified as agricultural land as defined in section 39-1-102 (1.6)(a)(III) and the perpetual conservation easement is terminated, violated, or substantially modified so that the easement is no longer granted exclusively for conservation purposes, the assessor may reassess the land retroactively for a period of seven years and the additional taxes, if any, that would have been levied on the land during the seven year period prior to the termination, violation, or modification shall become due.
C.R.S. 39-1-102 and C.R.S. 39-1-103
Idaho
Speculative portion of value of agricultural land exempt from taxation.
“Land actively devoted to agriculture” means:
- Total area, including the homesite, is more than 5 contiguous acres, and
- It is used to produce field crops; or
- It is used to produce nursery stock; or
- It is used by the owner for the grazing of livestock to be sold as part of a for-profit enterprise, or is leased by the owner to a bona fide lessee for grazing purposes; or
- It is in a cropland retirement or rotation program. Or
- It is used to produce field crops; or
- Five contiguous acres or less and has been actively devoted to agriculture during the last three growing seasons and
- Produces for sale or home consumption the equivalent of 15% or more of the owner’s or lessee’s annual gross income, or
- Produced gross revenues the preceding year of $1,000 or more. Or
- Produces for sale or home consumption the equivalent of 15% or more of the owner’s or lessee’s annual gross income, or
- Land used to protect wildlife and wildlife habitat as land actively devoted to agriculture:
- Owned and used for wildlife habitat by a private or nonprofit corporation,
- Managed pursuant to a conservation easement or a conservation agreement, and
- Qualified for three preceding consecutive years as land actively devoted to agriculture.
- Owned and used for wildlife habitat by a private or nonprofit corporation,
Idaho Code Title 63, Chapter 6 https://legislature.idaho.gov/statutesrules/idstat/Title63/T63CH6/
Montana
“Agricultural” refers to:
- The production of food, feed, and fiber commodities;
- Livestock and poultry;
- Bees;
- Biological control insects;
- Fruits and vegetables;
- Sod, ornamental, nursery, and horticultural crops that are raised, grown, or produced for commercial purposes; and
- The raising of domestic animals and wildlife in domestication or a captive environment.
Montana Code Ann. 15-1-101
Eligibility of land for valuation as agricultural:
- Contiguous parcels of land totaling 160 acres or more under one ownership, not devoted to a residential, commercial, or industrial use; or
- Contiguous parcels of land of 20 acres or more but less than 160 acres under one ownership that are actively devoted to agricultural use are eligible for valuation, assessment, and taxation as agricultural land if:
- The land is used primarily for raising and marketing agricultural products and markets not less than $1,500 in annual gross income; or
- Would have met the qualification were it not for production failure beyond the control of the producer or a marketing delay for economic advantage.
- Noncontiguous parcels of land meet the income requirement if:
- The land is an integral part of a bona fide agricultural operation meeting the income requirement and
- The land is not devoted to a residential, commercial, or industrial use.
- The land is an integral part of a bona fide agricultural operation meeting the income requirement and
- Parcels of land that are part of a family-operated farm, family corporation, family partnership, sole proprietorship, or family trust that is involved in agriculture that do not meet the income requirement may also be valued, assessed, and taxed as agricultural land if the owner:
- Applies to the department requesting classification of the parcel as agricultural,
- The parcel is located within 15 air miles of the family-operated farming operation, and
- Verifies that:
- The owner of the parcel is involved in agricultural production by submitting proof that 51% or more of the owner’s Montana annual gross income is derived from agricultural production and
- Property taxes on the property are paid by a family corporation, family partnership, sole proprietorship, or family trust that is involved in Montana agricultural production and 51% of the entity’s Montana annual gross income is derived from agricultural production; or
- The owner is a shareholder, partner, owner, or member of the family corporation, family partnership, sole proprietorship, or family trust that is involved in Montana agricultural production and 51% of the person’s or entity’s Montana annual gross income is derived from agricultural production.
- The owner of the parcel is involved in agricultural production by submitting proof that 51% or more of the owner’s Montana annual gross income is derived from agricultural production and
- Applies to the department requesting classification of the parcel as agricultural,
- The land is used primarily for raising and marketing agricultural products and markets not less than $1,500 in annual gross income; or
Montana Code Ann. 15-7-202
Montana has a separate category for forest lands that is not under agriculture (Montana Code Title 15, chapter 44).
https://leg.mt.gov/bills/mca/title_0150/chapters_index.html
Nevada
“Agricultural use” means:
- The current employment of real property as a business venture for profit, which as a business produced a minimum gross income of $5,000 from agricultural pursuits during the immediately preceding calendar year by:
- Raising, harvesting, and selling crops, fruit, flowers, timber, and other products of the soil;
- Feeding, breeding, management, and sale of livestock or poultry;
- Operating a feed lot consisting of at least 50 head of cattle or an equivalent number of animal units of sheep or hogs, for the production of food;
- Raising furbearing animals or bees;
- Dairying and the sale of dairy products; or
- Any other use determined by the Department to constitute agricultural use if such use is verified by the Department.
- Raising, harvesting, and selling crops, fruit, flowers, timber, and other products of the soil;
- Includes every process and step necessary and incident to the preparation and storage of the products raised on such property for human or animal consumption or for marketing except actual market locations.
“Agricultural real property” means:
- Land devoted exclusively for at least 3 consecutive years immediately preceding the assessment date to agricultural use.
- Land leased by the owner to another person for agricultural use and composed of any lot or
parcel which:
- Includes at least 7 acres of land devoted to accepted agricultural practices or
- Is contiguous to other agricultural real property owned by the lessee.
- Includes at least 7 acres of land devoted to accepted agricultural practices or
- Land covered by a residence or necessary to support the residence if it is part of a qualified agricultural parcel.
Nevada has a separate assessment for “open-space,” which includes golf courses, land that the owner has granted or leased surface water rights to a political subdivision for municipal use, or property designated by a city or county.
Nevada also requires that deferred taxes (difference between agricultural or open space assessment and what would have been paid if not under special assessment) for the year be converted to higher use and the preceding six fiscal years. A penalty equal to 20% of the total accumulated deferred tax must be added for each of the years in which the owner failed to provide the written notice that the land has ceased to be used exclusively for agricultural use or the approved open space use or is converted to a higher use.
Nevada Revised Statutes Chapter 361A
https://www.leg.state.nv.us/NRS/NRS-361A.html
New Mexico
“Agricultural use” means the:
- Use of land for the production of agricultural products;
- Use of land that meets the requirements for payment or other compensation pursuant to a soil conservation program under an agreement with an agency of the federal government;
- Resting of land to maintain its capacity to produce agricultural products; or
- Resting of land as the direct result of at least moderate drought conditions as designated by the United States Department of Agriculture, if the drought conditions occurred in the county within which the land is located for at least eight consecutive weeks during the previous tax year.
“Agricultural products” means plants, crops, trees, forest products, orchard crops, livestock, poultry, captive deer or elk, or fish.
New Mexico Statutes Annotated 1978, Chapter 7, Article 36-20.
https://nmonesource.com/nmos/nmsa/en/nav_date.do
Oregon
“Exclusive farm use zone” means a zoning district established by a county or a city that is consistent with the farm use zone provisions.
- Any land that is within an exclusive farm use zone and used exclusively for farm use.
Nonexclusive farm use zone farmland.
- Any land that is not within an exclusive farm use zone but that is being used, and has been used for the preceding two years, exclusively for farm use:
- Three out of the five full calendar years immediately preceding the assessment date,
- The farmland or farm parcel was operated as a part of a farm unit that has produced a gross income from farm uses in the following amount for a calendar year:
- If the farm unit consists of 6 1/2 acres or less, the gross income from farm use shall be at least $650.
- If the farm unit consists of more than 6 1/2 acres but less than 30 acres, the gross income from farm use shall be at least equal to the product of $100 times the number of acres and any fraction of an acre of land included.
- If the farm unit consists of 30 acres or more, the gross income from farm use shall be at least $3,000 and,
- Excise or income tax returns are filed with the Department of Revenue by the farmland owner or the operator of the farm unit that include a Schedule F.
- If the farm unit consists of 6 1/2 acres or less, the gross income from farm use shall be at least $650.
- Three out of the five full calendar years immediately preceding the assessment date,
“Farm use” means the current employment of land for the primary purpose of obtaining a profit in money by:
- Raising, harvesting, and selling crops;
- Feeding, breeding, managing ,or selling livestock, poultry, fur-bearing animals or honeybees or the produce thereof;
- Dairying and selling dairy products;
- Stabling or training equines, including but not limited to providing riding lessons, training clinics, and schooling shows;
- Propagating, cultivating, maintaining, or harvesting aquatic species and bird and animal species to the extent allowed by the rules adopted by the State Fish and Wildlife Commission;
- On-site constructing and maintaining equipment and facilities used for the activities described in this subsection;
- Preparing, storing, or disposing of, by marketing, donation to a local food bank or school, or otherwise, the products or by-products raised for human or animal use on land described in this section;
- Implementing a remediation plan previously presented to the assessor for the county in which the land that is the subject of the plan is located;
- Using land described in this section for any other agricultural or horticultural use or animal husbandry or any combination thereof; or
- Land used exclusively for growing cultured Christmas trees or land used to grow certain hardwood timber, including hybrid cottonwood.
Land is currently employed for farm use if the land is:
- Farmland, the operation or use of which is subject to any farm-related government program;
- Land lying fallow for one year as a normal and regular requirement of good agricultural husbandry;
- Land planted in orchards or other perennials prior to maturity;
- Land not in an exclusive farm use zone that has not been eligible for assessment at special farm use value in the year prior to planting the current crop and has been planted in orchards, cultured Christmas trees, or vineyards for at least three years;
- Wasteland, in an exclusive farm use zone, dry or covered with water, neither economically tillable nor grazeable, lying in or adjacent to and in common ownership with farm use land and that is not currently being used for any economic farm use;
- Except for land under a single-family dwelling, land under buildings supporting accepted farming practices, including the processing facilities and the processing of farm crops into biofuel as commercial activities in conjunction with farm use;
- Water impoundments lying in or adjacent to and in common ownership with farm use land;
- Any land constituting a woodlot, not to exceed 20 acres, contiguous to and owned by the owner of land specially valued for farm use even if the land constituting the woodlot is not utilized in conjunction with farm use;
- Land lying idle for no more than one year when the absence of farming activity is the result of the illness of the farmer or a member of the farmer’s immediate family, including injury or infirmity, regardless of whether the illness results in death;
- Land described under ORS 321.267 (3) or 321.824 (3) (relating to land used to grow certain hardwood timber, including hybrid cottonwood);
- Land subject to a remediation plan previously presented to the assessor for the county in which the land that is the subject of the plan is located; or
- Land used for the processing of farm crops into biofuel, as defined in ORS 315.141, if:
- Only the crops of the landowner are being processed,
- The biofuel from all of the crops purchased for processing into biofuel is used on the farm of the landowner, or
- The landowner is custom processing crops into biofuel from other landowners in the area for their use or sale.
- Only the crops of the landowner are being processed,
Potential additional tax liability: In the case of exclusive farm use zone farmland that qualifies for special assessment or nonexclusive farm use zone farmland that qualifies for special assessment, the county assessor shall enter on the assessment and tax roll the notation “potential additional tax liability” until the land is disqualified.
Oregon also has special land assessments for Farm and Forested Homesites, Open Space Lands, Riparian Habitat Exemptions, Wildlife Habitat, and Conservation Easements. Oregon Revised Statutes (ORS) 2017 Edition Volume 8, Chapter 308A
https://www.oregonlegislature.gov/bills_laws/pages/ors.aspx
Utah
“Actively devoted to agricultural use” means that the land in agricultural use produces in excess of 50% of the average agricultural production per acre for the given type of land and the given county or area.
“Land in agricultural use” means:
- Land devoted to the raising of useful plants and animals with a reasonable expectation of profit, including:
- Forages and sod crops,
- Grains and feed crops,
- Livestock,
- Trees and fruits, or
- Vegetables, nursery, floral, and ornamental stock or,
- Forages and sod crops,
- Land devoted to and meeting the requirements and qualifications for payments or other compensation under a crop-land retirement program with an agency of the state or federal government.
Rollback tax, penalty:
Owner failure to notify the county assessor that land is withdrawn from the farmland assessment is subject to a penalty equal to the greater of:
- $10 or
- 2% of the rollback tax due for the last year of the rollback period.
Land withdrawn from farmland assessment is subject to a rollback tax:
- Amount of the rollback tax is the difference between the tax paid while the land was assessed under the farmland assessment and the tax that would have been paid had the property not been assessed as farmland.
The rollback period is a time period that:
- Begins on the later of:
- The date the land is first assessed as farmland or
- Five years preceding the day on which the county assessor mails the notice; and
- The date the land is first assessed as farmland or
- Ends the day on which the county assessor mails the notice.
https://le.utah.gov/xcode/Title59/Chapter2/59-2-P5.html?v=C59-2-P5_1800010118000101
Washington
“Farm and agricultural land” means:
- Any parcel of land of less than five acres devoted primarily to agricultural uses which has produced a gross income of:
- $1,500 or more per year for three of the five calendar years preceding the date of application.
- $1,500 or more per year for three of the five calendar years preceding the date of application.
- Any parcel of land that is five acres or more, but less than 20 acres, devoted primarily to agricultural uses, which meet one of the following criteria:
- Has produced a gross income from agricultural uses equivalent to $200 or more per acre per year for three of the five calendar years preceding the date of application.
- Has standing crops with an expectation of harvest within seven years and a demonstrable investment in the production of those crops equivalent to $100 or more per acre in the current or previous calendar year.
- “Standing crop” means Christmas trees, vineyards, fruit trees, or other perennial crops that are planted using agricultural methods normally used in the commercial production of that particular crop and typically do not produce harvestable quantities in the initial years after planting.
- “Standing crop” means Christmas trees, vineyards, fruit trees, or other perennial crops that are planted using agricultural methods normally used in the commercial production of that particular crop and typically do not produce harvestable quantities in the initial years after planting.
- Has a standing crop of short rotation hardwoods with an expectation of harvest within fifteen years and a demonstrable investment in the production of those crops equivalent to $100 or more per acre in the current or previous calendar year.
- Has produced a gross income from agricultural uses equivalent to $200 or more per acre per year for three of the five calendar years preceding the date of application.
- Any parcel of land that is 20 or more acres or multiple parcels of land that are contiguous and total 20 or more acres:
- Devoted primarily to the production of livestock or agricultural commodities for commercial purposes,
- Enrolled in the federal conservation reserve program or its successor administered by the United States Department of Agriculture, or
- Other similar commercial activities as may be established by rule.
- Devoted primarily to the production of livestock or agricultural commodities for commercial purposes,
- Any lands including incidental uses as are compatible with agricultural purposes, including wetlands preservation, provided such incidental use does not exceed 20% of the classified land and the land on which appurtenances necessary to the production, preparation, or sale of the agricultural products exists in conjunction with the lands producing such products.
- Agricultural lands also include any parcel of land of one to five acres, which is not contiguous, but which otherwise constitutes an integral part of farming operations being conducted on land qualifying under this section as “farm and agricultural lands.”
- The land on which housing for employees and the principal place of residence of the farm operator or owner of land if: The housing or residence is on or contiguous to the classified parcel, and the use of the housing or the residence is integral to the use of the classified land for agricultural purposes.
- Any land that is used primarily for equestrian-related activities for which a charge is made, including, but not limited to, stabling, training, riding, clinics, schooling, shows, or grazing for feed.
- Any land primarily used for commercial horticultural purposes, including growing seedlings, trees, shrubs, vines, fruits, vegetables, flowers, herbs, and other plants in containers, whether under a structure or not, subject to the following:
- The land is not primarily used for the storage, care, or selling of plants purchased from other growers for retail sale;
- If the land is less than five acres and used primarily to grow plants in containers, such land does not qualify as “farm and agricultural land” if more than 25% of the land used primarily to grow plants in containers is open to the general public for on-site retail sales;
- If more than 20% of the land used for growing plants in containers is covered by pavement, none of the paved area is eligible for classification as “farm and agricultural land”; and
- If the land classified under this subsection, in addition to any contiguous land classified under this subsection, is less than 20 acres, it must meet the applicable income or investment requirements.
- The land is not primarily used for the storage, care, or selling of plants purchased from other growers for retail sale;
Rollback tax:
The amount of additional tax is equal to the difference between the property tax paid as “open space land,” “farm and agricultural land,” or “timberland,” and the amount of property tax otherwise due and payable for the last seven years had the land not been so classified.
Washington has special assessment classifications for “open space land,” “farm and agricultural land,” or “timberland.”
The amount of applicable interest is equal to the interest upon the amounts of the additional tax paid at the same statutory rate charged on delinquent property taxes from the dates on which the additional tax could have been paid without penalty if the land had been assessed at a value without regard to this chapter.
https://apps.leg.wa.gov/rcw/default.aspx?Cite=84
Wyoming
“Agricultural purpose” means the following land uses when conducted consistent with the land’s capability to produce or when supporting the land’s capability to produce:
- Cultivation of the soil for production of crops;
- Production of timber products or grasses for forage;
- Rearing, feeding, grazing, or management of livestock; or
- Land used for a farmstead structure.
Agricultural land:
- Contiguous or noncontiguous parcels of land under one (1) operation owned or leased shall qualify for classification as agricultural land if the land meets each of the following qualifications:
- The land is presently being used and employed for an agricultural purpose, including use as a farmstead to support an agricultural purpose.
- The land is not part of a platted subdivision, except for a parcel of thirty-five (35) acres or more which otherwise qualifies as agricultural land.
- If the land is not leased land, the owner of the land has derived annual gross revenues of not less than five hundred dollars ($500.00) from the marketing of agricultural products, or if the land is leased land the lessee has derived annual gross revenues of not less than one thousand dollars ($1,000.00) from the marketing of agricultural products.
- The land has been used or employed, consistent with the land’s size, location, and capability, to produce as defined by department rules and the mapping and agricultural manual published by the department, primarily in an agricultural operation, or the land does not meet this requirement and the requirement of subdivision (III) of this subparagraph because the producer:
- Experiences an intervening cause of production failure beyond its control;
- Causes a marketing delay for economic advantage;
- Participates in a bona fide conservation program, in which case proof by an affidavit showing qualification in a previous year shall suffice; or
- Has planted a crop that will not yield an income in the tax year.
- Experiences an intervening cause of production failure beyond its control;
- The land is presently being used and employed for an agricultural purpose, including use as a farmstead to support an agricultural purpose.
1Washington, Oregon, California, Nevada, Arizona, New Mexico, Utah, Colorado, Wyoming, Idaho, and Montana.
![]()
The Linebery Policy Center for Natural Resources Management provides policy analysis and promotes the visibility of and advocates for the beneficial use of natural resources through education.
For Further Reading
LPC-1: Economic Contribution of the Beef Cattle Industry to New Mexico
https://pubs.nmsu.edu/specialty/lpc/LPC1/index.html
LPC-4: Pinyon-juniper Regulations in New Mexico: A Policy Review
https://pubs.nmsu.edu/specialty/lpc/LPC4/index.html
CR-651: Rural New Mexico Economic Conditions and Trends
https://pubs.nmsu.edu/_circulars/CR651/index.html

Nicholas K. Ashcroft is the Natural Resource Policy Analyst, Sr., at the Linebery Policy Center for Natural Resource Management. He serves as the spokesperson for the Center and conducts objective, quantitative analysis of potential impacts of proposed policies, regulations, and laws on federal, state, and private land. He also works at developing a grassroots network throughout New Mexico and the 11 western states.
To find more resources for your business, home, or family, visit the College of Agricultural, Consumer and Environmental Sciences on the World Wide Web at pubs.nmsu.edu.
Contents of publications may be freely reproduced, with an appropriate citation, for educational purposes. All other rights reserved. For permission to use publications for other purposes, contact pubs@nmsu.edu or the authors listed on the publication.
New Mexico State University is an equal opportunity/affirmative action employer and educator. NMSU and the U.S. Department of Agriculture cooperating.
June 2022 Las Cruces, NM