Onion Production, Packing, and Storage Feasibility on the Navajo Indian Irrigation Project
RR-769
Nate Lee, Constance L. Falk and William Gorman
College of Agricultural, Consumer and Environmental Sciences, New Mexico State University
Authors: Respectively, Analyst, MetLife Agricultural Investments, Overland Park, KS; Professor, Department of Agricultural Economics and Agricultural Business, New Mexico State University (MSC 3169, Box 30003, Las Cruces, NM 88003, 575-646-4731, cfalk@nmsu.edu); and College Professor, Department of Agricultural Economics and Agricultural Business, New Mexico State University. (Print Friendly PDF)
Abstract
The purpose of this study was to assess the feasibility of a 1,200-acre onion production, packing, and storage enterprise on the Navajo Indian Irrigation Project (NIIP) in Northern New Mexico. Three approaches were used to assess the project: a deterministic financial feasibility model, discounted cash flow and ratio analyses, and a risk analysis involving stochastic prices and yields. The project appears to be financially feasible for the NIIP. Profitability ratios exceeded industry standards, the project net present value (NPV) was $3,173,286, and the internal rate of return (IRR) was 25.9% over a 25-year project life. A medium level of risk was found in the stochastic simulation model, but adequate returns to investors can be expected in the long run.
Introduction
The Navajo Indian Irrigation Project (NIIP) consists of 110,630 acres, encompassing approximately 70,000 acres of irrigated farmland located in northwestern New Mexico. In 2004, the NIIP was composed of eight blocks, each ranging in size from 7,000 to 9,000 acres of irrigated farmland. Historically, there has been interest in diversifying into onions at NIIP.
Ogaz (1971) identified fresh dry onions as an “enterprise shown to be economically feasible” for production in northwestern New Mexico. Further studies (Gorman et al., 1972; Gorman et al., 1973; Sweetser et al., 1976; Gorman et al., 1985) identified fresh dry onions as one crop with the agronomic and economic potential to be successfully grown and marketed on the NIIP. Recent studies (U.S. Department of Interior, Bureau of Indian Affairs [USDI-BIA], 2000; USDI-BIA, 2002) focused on identifying high value crops with the potential to be profitable. Onions were cited as a crop with the potential to be profitable.
The purpose of this study was to assess the feasibility of onion production, packing, and storage on the NIIP in northwestern New Mexico. This paper focuses on the results of both deterministic and stochastic financial analyses. Detailed explanations of onion price movements, supply and demand conditions, competing onion-producing regions, farming procedures and farm production costs, storage requirements, and packing house steps are discussed in Lee (2006).
The general assumptions of the project were:
- Potential markets for NIIP were east of New Mexico, and trucks were used for shipping.
- Principal competitor production regions were in California, Colorado, Idaho, Oregon, and Washington.
- Historical North and Northeast Colorado prices could be used for NIIP onions.
- NIIP would employ management capable of growing onions of commercial quality.
- The increased production would not adversely affect prices of red, white, and yellow onions over the marketing period.
- An outside broker for onion sales would be used, the marketing period would be from August to December, and both fresh and storage onions would be sold.
- Adequate packing and storage facilities would be built and would be made available in all years of commercial production.
- The onion planting would be 1,200 acres, to include 400 acres of red, 100 acres of white, and 700 acres of yellow onions.
- Grade number one onions in medium, jumbo, and colossal sizes would be sold. Medium are 2 1/4 to 3 1/4 in., jumbo are 3 in. and up, and colossal are 3 3/4 in. and up.
- Onions would be rotated with crops such as potatoes, small grains, alfalfa, corn, and beans in several of the many fields on the NIIP.
- The onion packing facility would be 40,000 square feet and located along a state highway midway between the two major NIIP production regions.
Methodology
Field Production and Packing Shed Models
Onion production costs were estimated using a revised version of the Microcomputer Crop Cost and Return Generator developed at New Mexico State University (NMSU) (Sullivan et al., 1986). Farm machinery and equipment were included in the farming cost estimates for tillage, planting, crop maintenance, and harvesting equipment (Lee, 2006).
The procedures used to prepare an onion packing facility and storage budget were (1) determining the post-harvest handling flow procedures involved; (2) determining storage provisions, capital requirements, and operating cost; (3) applying relevant cost assumptions to express per 50-lb sack inputs and yields in monetary values; (4) applying the assumed physical quantities and factors per 50-lb sack; (5) summing fixed and variable costs to obtain total costs of storage and packing per 50-lb sack; and (6) applying relevant price assumptions per 50-lb sack.
Packing and storage machinery and equipment included in the analysis were a bin piler, receiving bins, finish toppers, and onion-sorting line with boxing and bagging. Also included were design costs and transport and setup. The onion-sorting line was assumed to handle (1) all pack sizes from pre-packs to super colossal; (2) packing in 25-lb and 50-lb bags and 25-lb, 40-lb, and 50-lb cardboard boxes; and (3) a throughput of 2,500 fifty-pound bags per hour. A subset of these capacities was modeled in this analysis.
Guenthner (1999) and Patterson (2002) employed engineering-cost methods to derive potato storage operating and ownership cost estimates. Many firms that supply, design, and manufacture potato storage also serve the onion industry. An engineering-cost method was used here, and also included labor and supervision costs, energy usage factors (Hancock & Epperson, 1990; Hanney & Bishop, 2005), and shrink losses (Boyhan et al., 2001; Patterson, 2002; Wilson & Estes, 1992).
Financial outcomes of onion packing and storage were modeled using a modified version of the spreadsheet add-in The Packing Simulation Model (PACKSIM; Schatzer et al., 1990). A stochastic financial planning model was then developed that combined the Microcomputer Crop Cost and Return Generator results and PACKSIM.
Ratio and Discounted Cash Flow Analyses
Nine key business ratios for the onion production, packing, and storage project based on the first and second years of operation were estimated. Five benchmark ratios based on Standard Industrial Classification (SIC) codes for specific industries were used to make comparisons (Dun & Bradstreet, Inc., 2004). The benchmark ratios used combined SIC0161 and SIC0723, since no benchmark exists for such an integrated operation.
The net present value (NPV) and internal rate of return (IRR) were estimated assuming 100% equity capital and a 25-year project life. The residual value was assumed to be the ending book value of the initial investment at year 25. Equipment replacements were assumed to take place at three- and six-year intervals throughout the project life and were based upon estimated trade-in values and wear-out life (Lazarus & Selley, 2005). The operating cash flows for each year were taken from the annual cash flow statements produced by the PACKSIM model.
Risk Modeling
Significant risk exists in projects such as this; price and yield in particular create uncertainty. Fixed or deterministic values, such as the mean price, can be replaced with probability distributions that describe a range of possibilities. Prices and yields were selected as the stochastic input variables for the risk model. To conduct the stochastic simulations, @Risk, a Microsoft Excel add-in, was used. Both Monte Carlo and Latin Hypercube sampling techniques are possible in @Risk, and Latin Hypercube was chosen to conduct the simulation (Palisade Corporation, 2000). Latin Hypercube is more efficient than Monte Carlo because it requires fewer iterations to converge on true distributions and accurately represents low probability outcomes in simulation outputs (Palisade Corporation, 2000).
Price and Yield Assumptions
Price estimates for the PACKSIM model were based on Colorado prices, which reflect the most likely prices that the NIIP may receive for commercial production of onions, based on proximity. North Colorado and East Colorado freight on board (F.O.B.) shipping point price data for 1998 to 2003 were evaluated (U.S. Department of Agriculture, Federal-State Market News Service [FSMNS]). Deterministic prices were based on the mean across the years for the various colors and sizes of grade number one onions (Table 1).
Table 1. Monthly U.S. No. 1 Onion Prices and Distribution by Size Categories
| Month | Item | Red | White | Yellow | Red | Yellow |
| -------- Fresh market -------- | ------Storage----- | |||||
| August | Colossal | 20% | ||||
| $7.89 | ||||||
| Jumbo | 70% | 40% | 54% | |||
| $7.47 | $10.18 | $6.24 | ||||
| Medium | 30% | 6% | 26% | |||
| $5.31 | $8.74 | $6.24 | ||||
| September | Colossal | 40% | ||||
| $7.73 | ||||||
| Jumbo | 70% | 40% | 50% | |||
| $6.88 | $9.71 | $6.38 | ||||
| Medium | 30% | 60% | 10% | |||
| $4.86 | $8.57 | $5.23 | ||||
| October | Colossal | 40% | ||||
| $7.55 | ||||||
| Jumbo | 70% | 60% | ||||
| $6.31 | $6.19 | |||||
| Medium | 30% | |||||
| $4.47 | ||||||
| November | Colossal | 20% | ||||
| $7.82 | ||||||
| Jumbo | 70% | 60% | ||||
| $6.45 | $6.84 | |||||
| Medium | 30% | 20% | ||||
| $4.60 | $5.14 | |||||
| December | Colossal | 20% | ||||
| $7.31 | ||||||
| Jumbo | 70% | 54% | ||||
| $7.10 | $6.91 | |||||
| Medium | 30% | 26% | ||||
| $4.82 | $5.58 | |||||
Probability distributions of selling prices were fit for each onion type, grade, and size based on the FSMNS North Colorado and East Colorado F.O.B. prices from 1998 to 2003 (Table 2). Distributions were selected using BestFit2, which is integrated into the @Risk software. Each selection was based on three goodness of fit statistical rankings: chi-squared, Kolmogorov-Smirnov, and Anderson-Darling.
Spearman Rank Correlation Coefficients were estimated to account for price behavior similarities among onion types and sizes between months. Several distribution functions were found to be best among prices. Therefore, this method was used because it is known as a “distribution-free” approach, as any types of distributions may be correlated (Palisade Corporation, 2000).
The first year mean yield for yellow onions was determined by fitting probability distributions to historical yellow onion data and the rankings based on the three goodness-of-fit statistics. White onion yields were represented by a triangular distribution due to limited historical yield data. Historical yields for red onions were not available, so no stochastic distributions were estimated (Table 2).
Table 2. Stochastic Input Variables and Data Sources
| Data series |
Size | Color |
Fresh or storage |
Distribution | Property functions | Historical data source |
| Yield | White | F | Trian | (290, 676, 676) | * NAPI historical | |
| Yield | Yellow | F | Loglogistic | (123.4, 166.22, 1.8708) yields | NAPI historical | |
| Yield | White | S | Trian | (290, 676, 676) yields | NAPI historical | |
| Yield | White | S | Loglogistic | (123.4, 166.22, 1.8708) yields | NAPI historical | |
| Price | Colossal | Yellow | F | Invgauss | (2.1767, 2.8772, Shift(6.0733), Corrmat(NewMatrix,1)) | FSMNS weekly prices, 1997-2003 |
| Price | Jumbo | Red | F | Normal | (7.7857, 1.3569, Corrmat(NewMatrix,2)) | " |
| Price | Jumbo | White | F | Loglogistic | (8.004, 2.0805, 2.1237, Corrmat(NewMatrix,3)) | " |
| Price | Jumbo | Yellow | F | Normal | (6.5, 0.7964, Corrmat(NewMatrix,4)) | " |
| Price | Medium | Red | F | Extvalue | (5.21292, 0.56845, Corrmat(NewMatrix,5)) | " |
| Price | Medium | White | F | Loglogistic | (6.8261, 1.771, 2.1374, Corrmat,6) | " |
| Price | Medium | Yellow | F | Uniform | (4.8889, 8.1111, Corrmat(NewMatrix,7)) | " |
| Price | Colossal | Yellow | F | Loglogistic | (5.3199, 2.4497, 3.3726, Corrmat(NewMatrix,8)) | " |
| Price | Jumbo | Red | F | Normal | (7.1731, 1.1017, Corrmat(NewMatrix,9)) | " |
| Price | Jumbo | White | F | Expon | (1.6923, Shift(8.4349), Corrmat(NewMatrix,10)) | " |
| Price | Jumbo | Yellow | F | Invgauss | (4.5223, 106.5519, Shift(2.1315), Corrmat,11) | " |
| Price | Medium | Red | F | Extvalue | (4.86062, 0.35494, Corrmat(NewMatrix,12)) | " |
| Price | Medium | White | F | Expon | (1.5, Shift(7.4423), Corrmat(NewMatrix,13)) | " |
| Price | Medium | Yellow | F | Expon | (0.73077, Shift(4.72189), Corrmat(NewMatrix,14)) | " |
| Price | Colossal | Yellow | S | Logistic | (7.87268, 0.90302, Corrmat(NewMatrix,15)) | " |
| Price | Jumbo | Red | S | Invgauss | (1.6282, 5.2045, Shift(4.9487), Corrmat(NewMatrix,16)) | " |
| Price | Jumbo | Yellow | S | Logistic | (6.46798, 0.78204, Corrmat(New Matrix,17)) | " |
| Price | Medium | Red | S | Extvalue | (4.46239, 0.33704, Corrmat(NewMatrix,18)) | " |
| Price | Colossal | Yellow | S | Extvalue | (7.1011, 2.04494, Corrmat(NewMatrix,19)) | " |
| Price | Jumbo | Red | S | Invgauss | (1.7836, 4.1858, Shift(4.9472),Corrmat(NewMatrix,20)) | " |
| Price | Jumbo | Yellow | S | Uniform | (3.48, 10.77, Corrmat(NewMatrix,21)) | " |
| Price | Medium | Red | S | Normal | (4.79808, 0.54781, Corrmat(NewMatrix,22)) | " |
| Price | Medium | Yellow | S | Logistic | (5.37134, 0.6691, Corrmat(NewMatrix,23)) | " |
| Price | Colossal | Yellow | S | Invgauss | (19.861, 1567.094, Shift(-11.537), Corrmat(NewMatrix,24)) | " |
| Price | Jumbo | Red | S | Logistic | (7.49202, 0.83074, Corrmat(NewMatrix,25)) | " |
| Price | Jumbo | Yellow | S | Logistic | (0.97298, 5.9654, 4.4892, Corrmat(NewMatrix,26)) | " |
| Price | Medium | Red | S | Logistic | (5.02328, 0.40313, Corrmat(NewMatrix,27)) | " |
| Price | Medium | Yellow | S | Logistic | (5.84232, 0.80341, Corrmat(NewMatrix,28)) | " |
| *Navajo Agricultural Products Industry | ||||||
Additional PACKSIM Model Assumptions
The assumptions that follow were adjusted for latter years of the discounted cash flow analysis. For simplicity, only the assumptions for the first year are presented here.
Product Mix
The product mix assumptions included six onion crop types: three colors of fresh-packed onions and three colors of storage onions (Table 3). Yields per acre, pounds per bag, number of acres, and the percentage of each crop sold each month were specified and used to calculate total volumes, as measured in 50-lb bags, and the percentage of each crop’s share of the total. This percentage share was used to allocate overhead costs among the six onion types.
Table 3. Product Mix for 50-lb Bags
| Crop | Red | White | Yellow | Red | Yellow | Totals |
| -------- Fresh market ----- | ---- Storage ----- | |||||
|
Yield (bags per acre) |
576 | 547 | 405 | 576 | 405 | |
| Acres (#) | 200 | 100 | 350 | 200 | 350 | 1,200 |
| Total bags (#) | 115,200 | 54,733 | 141,638 | 115,200 | 141,638 | 568,409 |
| Total weight (million lb) | 5.76 | 2.74 | 7.08 | 5.76 | 7.08 | 28.420 |
| Portion of total weight (%) | 20.3 | 9.6 | 24.9 | 20.3 | 24.9 | 100.0 |
| ---------- Distribution of monthly sales (%) ------------ | ||||||
| August | 75.0 | 50.0 | 50.0 | |||
| September | 25.0 | 50.0 | 50.0 | |||
| October | 25.0 | 20.0 | ||||
| November | 25.0 | 40.0 | ||||
| December | 50.0 | 40.0 | ||||
Labor Requirements
The base wage rate of $8.50/hour together with social security, workers’ compensation taxes, and unemployment insurance resulted in a total wage rate for each employee class of $9.71/hour, except forklift operators, whose hourly rate including burden was $11.42.
Total labor costs were estimated based on percent packed, hourly pack-out, percent capacity, and the number of workers at each stage of the packing process (Table 4). The percent packed is the percent of harvested onions and storage onions that are actually packed, and accounts for onions that are culled or are rejected at the packing facility. The hourly pack-out is the number of 50-lb bags per hour that the packing line is designed to handle at peak efficiency. The percent capacity determines the level of capacity achieved. When packing capacity is less than 100%, additional labor costs for idle time would be incurred. The number of workers per labor category estimates personnel needed to achieve the hourly pack-out rate specified.
Table 4. Labor Requirements
| Crop | Red | White | Yellow | Red | White | Yellow |
| --- Fresh market --- | -------- Storage ------- | |||||
|
Percent packed (%) |
92 | 92 | 92 | 88 | 88 | 88 |
| Hourly pack-out (in bags) | 2,500 | 2,500 | 2,500 | 2,500 | 2,500 | 2,500 |
| Percent capacity (%) | 75 | 75 | 75 | 75 | 75 | 75 |
| Actual packed per hour (bags) | 1,875 | 1,875 | 1,875 | 1,875 | 1,875 | 1,875 |
| Labor category | ||||||
| Packing facility labor | ------------------- Workers (#) --------------- | |||||
| Regular | 43 | 43 | 43 | 43 | 43 | 43 |
| Forklift | 3 | 3 | 3 | 3 | 3 | 3 |
| Labor charged to rejected crates only | ||||||
| Send to waste | 2 | 2 | 2 | 2 | 2 | 2 |
| Total per hour | 48 | 48 | 48 | 48 | 48 | 48 |
Material Costs
Material costs included items such as bags, plastic wrap, pallets, raw product, and the cost of storage (Table 5). Although the model allowed farmer payments for the raw product to be estimated as a residual from packing, in this study, farmer payments were assumed to be a direct material cost. The cost of storage was a four-month average of the operating cost, which was only allocated to the three storage onions.
Table 5. Material Costs
| Material | Red | White | Yellow | Red | Yellow |
| ----------- Fresh ---------- | ---- Market Storage -- | ||||
| --------------------- $ per bag ---------------------- | |||||
|
Bags |
0.25 | 0.25 | 0.25 | 0.25 | 0.25 |
| Wrap | 0.03 | 0.03 | 0.03 | 0.03 | 0.03 |
| Pallets | 0.14 | 0.14 | 0.14 | 0.14 | 0.14 |
| Storage | 0.11 | 0.11 | |||
| Onions (production cost) | 2.85 | 2.47 | 2.37 | 2.85 | 2.37 |
| Total per bag | 3.27 | 2.89 | 2.79 | 3.37 | 2.90 |
General Operating, Fixed, and Financial Expenses and Assumptions
Monthly general expenses included utilities, insurance, rentals, marketing commission, supplies, phone, tools, rodent control, professional services, fuel, and other expenses. These expenses were allocated to each of the six onion types based on the percentage of the total volume handled.
The cost of insurance, repair, and maintenance on buildings and equipment was considered fixed overhead (Table 6). Other fixed expenses included annual salaries for non-hourly employees. Financial assumptions also included minimum monthly cash balance, interest rates on operating loan and cash balance, depreciation schedules, and income tax status.
Table 6. Fixed Overhead and Miscellaneous Financial Inputs
| Annual maintenance and repairs on buildings ($/year) | 3,000.00 |
|
Annual maintenance and repair on mach. and equipment (% of investment) |
2.00 |
| Annual administrative salaries ($) | |
| Salesperson (half time) | 27,625.00 |
| Fresh pack manager (processing) | 67,600.00 |
| Secretary (half time) | 12,168.00 |
| Miscellaneous financial data | |
| Minimum monthly cash balance ($) | 5,000.00 |
| Interest rate paid on operating loan (monthly %) | 0.17 |
| Interest rate received on cash balance (monthly %) | 0.08 |
| Depreciation schedule | Years |
| Plant equipment | 10 |
| Packing building | 25 |
| Storage building | 15 |
| Office equipment | 10 |
| Farm equipment | 10 |
| Income tax status | Exempt |
Initial minimum equity was assumed to be 60% of the total investment and the remainder borrowed. The equipment and building loans were assumed to have been obtained prior to the first year of operation. The initial startup period, year zero, was dedicated to the construction of facilities and purchase of equipment and would include some depreciation on assets and interest expense on borrowed funds. The working capital loan included payment of principal and interest on equipment and building loans, separate from the operating loan. An operating loan kicked in if the cash position dropped below the specified cash minimum of $5,000 during the operating year. When the cash position exceeded the specified cash minimum, the operating loan balance, starting with outstanding interest, was paid down.
Results
Farm Production Costs
The direct production cost of growing the raw product was estimated at $1,889,745 annually, producing 793,525 50-lb sacks on 1,200 acres. This resulted in a unit cost of $2.38 per 50-lb sack (Lee, 2006). The cost estimates included allowances for labor, capital, and land. Farm production costs in competing states indicate that NIIP costs could be one of the highest (Table 7), in part due to lower yields, a situation that, if addressed, could decrease NIIP costs relative to competitors.
Table 7. Comparison of Production Costs: NIIP and Four Other States
| --------------------------- Region, Irrigation system ------------------------ | ||||||
| NIIP, Pivot | CO-N, Gravity | CO-W, Gravity | WA, Pivot | ID, Gravity | MI, Unknown | |
| Yield (sacks) | 661.27 | 690.00 | 700.00 | 1,400.00 | 890.00 | 600.00 |
|
Production costs (per acre unless noted) |
------------------------------------------$ -------------------------------------- | |||||
| Pre-harvest | 879.40 | 563.91 | 516.10 | 1,667.55 | 1,212.57 | 988.00 |
| Harvest | 230.09 | 289.65 | 397.08 | 180.25 | 103.76 | 432.00 |
| Other | 465.27 | 248.29 | 208.48 | 792.11 | 588.86 | 457.00 |
| Total cost of production | 1,574.76 | 1,101.85 | 1,121.66 | 2,639.91 | 1,905.19 | 1,877.00 |
| Total cost of production (per bag) | 2.38 | 1.60 | 1.60 | 1.89 | 2.14 | 3.13 |
Capital Outlays
Suberizer, Inc., an engineering, manufacturing, and construction company that specializes in raw product storage, prepared a cost estimate for the proposed storage building. At 41,556 square feet, the design could accommodate the necessary system and included ventilation features to accomplish unloading/loading and long-term bulk storage. The total investment in storage facilities with a 648,720-bushel capacity in eight bays was $3,477,242 (Table 8), amounting to approximately $41.84 per square foot or $5.36 per bushel. The equipment and facilities were expected to have a 25-year life and would take approximately 120 days to construct.
Table 8. Capital Investment in Production, Packing, and Storage
| Total ($) | |
| Farm machinery and equipment | 749,866 |
| Packing and storage machinery and equipment | 780,170 |
| Packing and office building (40,000 ft²) | 1,749,545 |
| Storage facility (83,112 ft²) | 3,477,242 |
| Office | 5,924 |
| Vehicles, forklifts, and lift jacks | 135,800 |
| Total initial investment | 6,898,547 |
Storage costs include operating and ownership costs and depend on the length of storage, interest rates, conditions at harvest, onion value at harvest, and shrink. Operating costs were directly incurred from storing onions and included labor to fill and empty the storage; power for heating/cooling, lights, and electric motors to unload and pile the onions; and shrink for a six-month storage period. Ownership costs included depreciation and interest on investment. Onion storage costs ranged from $0.49 per 50-lb bag to $0.91 per 50-lb bag over a six-month storage period (Table 9).
Table 9. Estimated Onion Storage Costs per 50-lb Bag
| Months | 1 | 2 | 3 | 4 | 5 | 6 |
| ------------------------------ $ ------------------------------- | ||||||
| Operating costs | ||||||
| Labor | 0.0912 | 0.0912 | 0.0912 | 0.0912 | 0.0912 | 0.0912 |
| Supervision | 0.0028 | 0.0028 | 0.0028 | 0.0028 | 0.0028 | 0.0028 |
| Energy | 0.0015 | 0.0029 | 0.0043 | 0.0057 | 0.0072 | 0.0086 |
| Repair and maintenance | 0.0100 | 0.0100 | 0.0100 | 0.0100 | 0.0100 | 0.0100 |
| Other | 0.0016 | 0.0016 | 0.0016 | 0.0017 | 0.0017 | 0.0017 |
| Ownership costs | ||||||
| Depreciation | 0.1822 | 0.1822 | 0.1822 | 0.1822 | 0.1822 | 0.1822 |
| Interest | 0.1195 | 0.1195 | 0.1195 | 0.1195 | 0.1195 | 0.1195 |
| Other costs | ||||||
| Shrink | 0.0827 | 0.1654 | 0.2481 | 0.3308 | 0.4134 | 0.4961 |
| Total cost per bag | 0.49 | 0.57 | 0.66 | 0.74 | 0.83 | 0.91 |
Direct storage and packing costs for all six onion types were estimated at $1,089,376 annually for 793,525 50-lb sacks. This resulted in a packing shed unit cost of $2.26 per 50-lb sack and $99.35 per acre (Table 10). Unit and per acre costs were also estimated for each onion type.
Thus, the capital cost of the production, packing, and storage facilities and associated equipment was estimated to be $6.9 million (Table 10). Building construction costs were estimated at $1,749,545, or $42.00 per square foot (S.L. Cooper, personal communication, 2006). The cost of a 648,720-bushel storage facility was $3,477,242, or $41.84 per square foot. The cost of office equipment, vehicles, forklifts, and lift jacks was also included as capital costs needed to operate the packing and storage facilities.
Table 10. Storage and Packing Costs for Different Onion Types on a 1,200-Acre Farm
| Red | White | Yellow | Red | Yellow | |
| ------------ Fresh market ------------- | ------- Storage ----------- | ||||
| I. Variable costs | |||||
| Packing facility labor | 25,647.36 | 15,050.02 | 55,168.55 | 25,647.36 | 55,168.55 |
| Labor charged to rejected bags only | |||||
| Send to waste | |||||
| Materials | 44,568.01 | 26,152.76 | 95,867.65 | 53,531.03 | 115,147.47 |
| Total variable costs | 72,320.50 | 42,438.07 | 155,564.40 | 81,283.51 | 174,844.21 |
| II. Fixed costs | |||||
| Machinery | 35,733.07 | 20,968.36 | 76,863.32 | 34,179.46 | 73,521.44 |
| Building | 67,197.34 | 39,431.77 | 144,544.28 | 64,275.72 | 138,259.75 |
| Administrative | |||||
| Supervisor | 4,091.45 | 2,400.88 | 8,800.88 | 3,913.56 | 8,418.23 |
| Foreman | 10,012.02 | 5,875.11 | 21,536.26 | 9,576.71 | 20,599.90 |
| Secretary | 1,802.16 | 1,057.52 | 3,876.53 | 1,723.81 | 3,707.98 |
| General expenses | |||||
| Utilities | 2,934.94 | 1,722.24 | 6,313.19 | 2,807.34 | 6,038.70 |
| Insurance | 4,828.28 | 2,833.26 | 10,385.83 | 4,618.35 | 9,934.27 |
| Rental equipment | 450.24 | 264.21 | 968.49 | 430.67 | 926.39 |
| Marketing commission | 26,496.00 | 15,548.00 | 56,994.00 | 25,344.00 | 54,516.00 |
| Office, janitorial, postage supplies | 365.82 | 214.67 | 786.90 | 349.92 | 752.69 |
| Phone | 562.81 | 330.26 | 1,210.62 | 538.34 | 1,157.98 |
| Tools | 177.73 | 104.29 | 382.30 | 170.00 | 365.68 |
| Rodent control | 177.73 | 104.29 | 382.30 | 170.00 | 365.68 |
| Travel | 296.21 | 73.82 | 637.17 | 283.33 | 609.46 |
| Professional | 2,665.92 | 1,564.38 | 5,734.51 | 2,550.01 | 5,485.18 |
| Fuel | 288.81 | 169.47 | 621.24 | 276.25 | 594.23 |
| Interest on operating capital | 3,263.46 | 1,915.02 | 7,019.84 | 3,121.57 | 6,714.63 |
| Total fixed costs | 161,344.00 | 94,677.55 | 347,057.66 | 154,329.04 | 331,968.20 |
| Cost per acre | 101.42 | 101.42 | 101.42 | 102.26 | 102.26 |
| Variable cost (per bag) | 0.68 | 0.68 | 0.68 | 0.80 | 0.80 |
| Fixed cost (per bag) | 1.52 | 1.52 | 1.52 | 1.52 | 1.52 |
| Total cost (per bag) | 2.20 | 2.20 | 2.20 | 2.32 | 2.32 |
Income Statement, Balance Sheet, and Cash Flow Statements
In year zero, the construction year, a net loss of $680,680 was estimated (Table 11). The project was estimated to yield a positive net income of $624,618 in the first year of operation, increasing to $1,478,234 in the second year, and gradually increasing to $1,839,517 by the tenth year of operation. The large increase in net income from year one to year two was the result of assumed yield increases in white and yellow onions. In year one, direct materials were the largest contributor to overall expenses, and included the cost of onion production and packing materials ($1,701,687). Depreciation expense ($404,033) and interest expense ($276,647) were the largest expense items.
In year zero, initial invested capital and carrying costs decreased owners' equity by $680,680, the loss recorded in the income statement. Because retained earnings in year one did not offset this decrease, year one ended with negative $56,062 in retained earnings. By year ten, retained earnings accumulated to $14,251,885 (Table 11).
In year zero, $7,352,773 in total cash outflows were required for purchases and initial capital costs (Table 11). These outflows were nearly offset by the sum of cash inflows from all borrowed funds and contributed capital. A working capital loan (Table 12) was used to cover the initial capital costs, but a cash shortage remained, creating the need for an operating loan of $10,730 (Table 11). Although the operating loan in year one reached a peak of $671,620 in the seventh month, the operating loan was paid off by the end of the year. Cash availability in years two through ten were sufficient to cover all cash costs, and no additional operating loans were needed. By the end of year ten, a positive cash balance of $15.4 million was estimated to accumulate.
Table 11. Key Financial Results from PACKSIM
| Year 0 | Year 1 | Year 10 | |
| ----------------------- $ -------------------------- | |||
| Income statement | |||
| Sales | 0 | 3,497,869 | 4,945,214 |
| Direct materials | 0 | 1,701,687 | 2,225,178 |
| Gross margin | 0 | 1,518,420 | 2,388,024 |
| Depreciation | 404,033 | 404,033 | 258,105 |
| Interest expense | 276,647 | 277,246 | 22,378 |
| Profits after taxes | (680,680) | 624,618 | 1,839,517 |
| Balance sheet | |||
| Total assets | 6,494,514 | 6,782,502 | 18,706,191 |
| Total liabilities | 3,036,066 | 2,699,435 | 315,177 |
| Retained earnings | (680,680) | (56,062) | 14,251,885 |
| Total owner's equity | 3,458,448 | 4,083,066 | 18,391,013 |
| Cash flow | |||
| Beginning cash balance | 4,139,128 | 0 | 13,743,283 |
| Total inflows | 7,345,716 | 3,036,275 | 18,688,496 |
| Total outflows | 7,352,473 | 2,789,012 | 3,240,242 |
| Outstanding operating loan | 10,730 | 0 | 0 |
Table 12. Summary of Loan Schedule
| Item |
Principal ($) |
Annual rate(%) |
Payments per year |
Life in years | Total periods |
Interest per period (%) |
Payment ($) |
| Farming, packing, and storage equipment | 668,704 | 10.00 | 4 | 11 | 44 | 2.50 | 25,230 |
| Packing and storage buildings | 2,090,715 | 10.00 | 12 | 11 | 132 | 0.83 | 26,175 |
| Working capital | 447,169 | 8.00 | 12 | 1 | 12 | 0.67 | 38,899 |
Ratio and Discounted Cash Flow Analyses Results
The first year return on equity (ROE) of 15.30% was much lower than the Dun & Bradstreet benchmark of 24.80%, but in the second year, which is more representative of the projected annual ROE, it was 26.58% (Table 13). In general, an ROE above 10% is a desirable objective, capable of providing dividends to investors and funds for future growth. Therefore, first year ROE of 15.30% for this project may be adequate, despite the higher benchmark of 24.8%. Using the current ratio, it appears current assets could safely retire current liabilities at a rate of 2.81 to 1.0 in the first year and 7.83 to 1.0 in the second. The debt to equity ratio of 0.661 in year one was less than the benchmark of 0.987 and continued to decrease in year two.
Table 13. Key Financial Ratios
| Onion production, packing house, and storage | *SIC 0161 Vegetable producers | *SIC 0723 Crop prep services |
Vegetable producers and crop prep services combined |
||
| Year 1 | Year 2 | ||||
| Profitability ratios | |||||
| Net profit margin on sales (%) | 17.86 | 29.89 | 1.60 | 3.80 | 5.40 |
| Return on total assets (%) | 13.30 | 21.05 | 8.90 | 3.00 | 11.90 |
| Return on equity (%) | 15.30 | 26.58 | 18.70 | 6.10 | 24.80 |
| Credit worthiness ratios | |||||
| Current ratio (liquidity) | 2.81 | 7.83 | 1.50 | 1.30 | 2.80 |
| Debt ratio (leverage) | 0.398 | 0.318 | |||
| Debt to equity ratio | 0.661 | 0.466 | 0.594 | 1.38 | 0.987 |
| Fixed charge coverage | 3.253 | 7.218 | |||
| Activity ratios | |||||
|
Fixed assets turnover (times per year) |
0.57 | 0.87 | |||
| *Standard Industrial Classification codes | |||||
The discounted cash flow (DCF) analysis resulted in an NPV of $3,173,286, using a discount rate of 17%. The IRR was 25.9% over a 25-year project life, taking into account the initial investment, residual value, and capital replacements (Table 14). The IRR was well above the discount rate of 17%.
Table 14. Discounted Cash Flow Analysis
| Year |
Investment: initial and residual |
Net capital replacement | Annual total cash flow |
| 0 | (6,898,547) | (6,898,547) | |
| 1 | 1,089,107 | ||
| 2 | 1,993,078 | ||
| 3 | (55,631) | 2,064,639 | |
| 4 | 2,120,000 | ||
| 5 | 2,120,000 | ||
| 6 | (966,856) | 1,153,144 | |
| 7 | 2,120,000 | ||
| 8 | 2,120,000 | ||
| 9 | (55,631) | 2,064,369 | |
| 10 | 2,120,000 | ||
| 11 | 2,120,000 | ||
| 12 | (966,856) | 1,153,144 | |
| 13 | 2,120,000 | ||
| 14 | 2,120,000 | ||
| 15 | (55,631) | 2,064,369 | |
| 16 | 2,120,000 | ||
| 17 | 2,120,000 | ||
| 18 | (966,856) | 1,153,144 | |
| 19 | 2,120,000 | ||
| 20 | 2,120,000 | ||
| 21 | (55,631) | 2,064,369 | |
| 22 | 2,120,000 | ||
| 23 | 2,120,000 | ||
| 24 | (966,856) | 1,153,144 | |
| 25 | 1,001,997 | 3,121,997 | |
| Net present value | $3,173,286 | ||
| IRR | 25.9% |
Stochastic Model Results
In the first year of operation, there was a 52% probability that the project would not achieve sales of $2,181,109, the amount needed to break even (Table 15). There was a 22% probability that cash outflows would exceed inflows, and a 2% probability that profits before tax would fall below zero. If investors require that this project's return on investment exceed the cost of capital of 14%, there was a 64% probability that, in the first year of operation, this would not occur.
Table 15. Output Variable Statistics from @Risk Simulation
| Name | Breakeven sales | Net sales | Ending cash balance | Profits before tax | Return on assets |
| Minimum | 1,836,725.00 | 2,492,578.00 | 5,000.00 | (132,233.60) | 0.02 |
| Maximum | 2,989,694.00 | 6,608,775.00 | 1,641,079.00 | 2,401,997.00 | 0.31 |
| Mean | 2,212,487.00 | 3,506,545.00 | 265,929.10 | 632,664.30 | 0.13 |
| Std deviation | 203,306.90 | 729,731.80 | 318,226.70 | 426,422.30 | 0.05 |
| Skewness | 0.86 | 1.62 | 1.97 | 1.39 | 0.84 |
| Kurtosis | 4.11 | 6.32 | 7.39 | 5.95 | 4.25 |
| Mode | 2,263,765.00 | 3,660,060.00 | 5,000.00 | 223,009.40 | 0.14 |
| Target value | 2,181,109.00 | 5,001.00 | 0.14 | ||
| Target (%) | 52% | 22% | 2% | 64% |
Profits were highly responsive to yellow onion yields (Figure 1). Additionally, profits were more sensitive to yellow and red onion prices than to white onion prices. The August yellow and red onion prices, as well as the December yellow and red onion prices, affected profit more than September and October. Lastly, 90% of the distribution of profits fell between $74,019 and $1,250,098 (Figure 1).
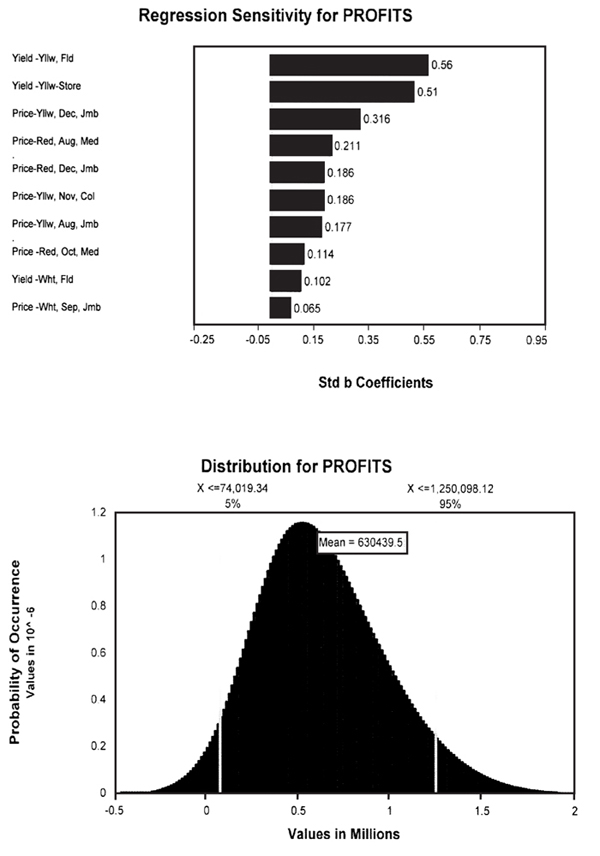
Figure 1. Regression sensitivity and distribution of pre-tax profits
Summary and Conclusion
An onion production, packing, and storage enterprise based on 1,200 cultivated acres was evaluated, and the results indicate it should be financially feasible for the NIIP. The total investment for this project was nearly $7 million. Assuming a capital structure of 60% equity and 40% debt, credit worthiness ratios, short-term solvency, and leverage of this project exceeded industry standards. Current assets could safely retire current liabilities, and creditors can be assured their risk was equivalent to the owners'. By the second year of operation, the ROE was more than adequate to provide return to investors and funds for future growth.
As the key indicator of profitability, the return on assets (ROA) in year one of 13.3% was greater than the benchmark of 11.9%, but less than cost of capital of 17%. The second year ROA increased to 21.05%, exceeding the benchmark and the cost of capital.
The DCF analysis at 100% equity capital provided a better indication of the risk and expected return. The cash flows are projected to provide sufficient cash for operational needs, and based on a cost of capital of 17%, NPV and IRR indicated a very favorable outcome for this project. While the DCF evaluation accounted for riskiness of the project, simulation results provided some helpful insight into the uncertainty of price and yield and their effects on several outcome variables. The onion production, packing, and storage enterprise should be no more than a medium risk venture in the first year of operation. For example, in the first year the probability of cash outflows exceeding cash inflows was not very likely, and the probability of profits falling below zero was highly unlikely. While the simulation indicated a 64% probability that ROA would not exceed 14% in the first year of operation, with proper capitalization, the probability of any default becomes highly unlikely in the second year and beyond. The high probability associated with ROA may be offset by the added value to the raw commodity, meaning that if prices are low in a particular year, value added through packing and storage still compensates.
Marketing trends and consumption factors indicate increasing demand for onions; consequently, the market was assumed to be able to absorb the additional supply of onions without impacts on short-term prices. While the NIIP has a transportation advantage over West Coast competitors, the biggest challenge is to establish a reputation for providing high-quality onions on a consistent basis.
Limitations
Projections of the model were highly dependent on yield. Unfortunately limited historical data were available for yellow and white onions, and none were available for red onions. While very conservative yield estimates were used for this study, the projections should be interpreted with some caution.
The cost of production did not consider potential reduction in overhead due to mixed farming (both vegetable and non-vegetable), as most of the farm equipment used in vegetable production would also be used in production of other crops. The implications of such a proposal can have a substantial impact on the overall cost structure.
The study results relied upon the assumption of 60% equity capital. It remains to be determined whether or not there is financial capacity to build and operate the production, packing, and storage facility.
Good to superior management was assumed to be hired for onion-growing under center pivot irrigation and packing shed and storage management. The projections for this enterprise can be drastically altered if less than adequate management is implemented, which has implications for yields, labor costs, and other factors. At the time of this research, NIIP was considering adding onions to their production plans. Impacts of significant increases in petroleum costs were also not considered, but as the industrial food system reacts to peak oil and global warming challenges, such concerns would be expected to impact large-scale farming and far-flung distribution systems.
References
Boyhan, G., D. Granberry, & T. Kelley. 2001. Onion production guide, vegetable team production [Bulletin 1198]. Athens: University of Georgia Cooperative Extension Service.
Dun & Bradstreet, Inc. 2004. Industry norms & key business ratios. Short Hills, NJ: Dun & Bradstreet.
Gorman, W.D., R.R. Lansford, T.S. Clevenger, J.E. Williams, W. Trego, M. Burkett, E.J. Gregory, J.M. Jordan, R.K. Bull, H.H. Ogaz, N. Bowman, & P. Barnes. 1972. Alternative farm organizational structures for the Navajo Indian Irrigation Project: Projected cropping patterns, livestock enterprise, processing activities, capital requirements, employment, income, and training needs [Special Report 17]. Las Cruces: New Mexico State University Agricultural Experiment Station.
Gorman, W.D., T.S. Clevenger, R.R. Lansford, W.H. Trego, J.E. Williams, E.J. Gregory, J.M. Jordan, & H.H. Ogaz. 1973. Costs, returns, and capital requirements of selected crops for the Navajo Indian Irrigation Project [Research Report 256]. Las Cruces: New Mexico State University Agricultural Experiment Station.
Gorman, W.D., R.E. Grassberger, G.A. Welsh, R.R. Lansford, D.G. Kraenzel, T.S. Clevenger, & G.A. Baker. 1985. Information on marketing and expected yields, prices, costs, and returns for selected crops, Navajo Indian Irrigation Project [Special Report 63]. Las Cruces: New Mexico State University Agricultural Experiment Station.
Guenthner, J.F. 1999. Economics of storing potatoes. Paper presented at Idaho Potato School, Pocatello, ID. Available at http://www.cals.uidaho.edu/potato/Research&Extension/Topic/Marketing&Economics/EconomicsOfStoringPotatoes-99.pdf
Hancock, C.T., & J.E. Epperson. 1990. Temporal cost analysis of a new development in controlled atmosphere storage: The case of Vidalia onions. Journal of Food Distribution Research, 21, 65–67.
Hanney, S.J., & C.F.H. Bishop. 2005. Energy usage in UK onion (Allium cepa L.) storage. Acta Horticulturae, 682, 1,617–1,624.
Lazarus, W., & R. Selley. 2004. Farm machinery economic cost estimates for 2005. St. Paul: University of Minnesota Extension.
Lee, N. 2006. Feasibility of onion production, packing and storage on the Navajo Indian Irrigation Project. Unpublished master's thesis, New Mexico State University, Las Cruces.
Ogaz, H.H. 1971. Evaluation of alternative organizational structures for the Navajo Indian Irrigation Project. Unpublished master's thesis, New Mexico State University, Las Cruces.
Palisade Corporation. 2000. @Risk: Risk analysis and simulation add-in for Microsoft Excel, version 4. Newfield, NY: Author.
Patterson, P.E. 2002. Estimating cost of potato production in Idaho. Paper presented at Idaho Potato School, Pocatello, ID. Available at http://www.cals.uidaho.edu/potato/Research&Extension/Topic/Marketing&Economics/ EstimatingCostOfPotatoProductionInIdaho-02.pdf
Schatzer, R.J., C.L. Falk, & D.S. Tilley. 1990. User's manual for packing simulation model: Version two. Stillwater: Department of Agricultural Economics, Oklahoma State University.
Sullivan, R.P., M.J. Schaber, J.D. Libbin, & B.E. Mayberry. 1986. Microcomputer crop cost and return generator technical documentation [Bulletin 726]. Las Cruces: New Mexico State University Agricultural Experiment Station.
Sweetser, J.S., W.D. Gorman, R.R. Lansford, W.H. Trego, E.J. Gregory, & S. Hicks. 1976. Annual expenses, returns, and capital requirements of selected crops for the Navajo Indian Irrigation Project [Research Report 313]. Las Cruces: New Mexico State University Agricultural Experiment Station.
U.S. Department of Agriculture, Federal-State Market News Service. Marketing U.S. onions, Various issues, 1997-2003.
U.S. Department of Interior, Bureau of Indian Affairs. 2000. NAPI: Navajo agricultural assessment project 2000. Farmington, NM: Mid Kansas Agri Company.
U.S. Department of Interior, Bureau of Indian Affairs. 2002. Navajo Indian Irrigation Project financial feasibility assessment. Farmington, NM: Moon Peak Development, LLC.
Wilson, L., & W. Estes. 1992. Postharvest cooling and handling of onions [AG-413-06]. Greensboro: North Carolina State University Cooperative Extension Service.
¹This project was made possible with support from the New Mexico State University Agricultural Experiment Station.
To find more resources for your business, home, or family, visit the College of Agricultural, Consumer and Environmental Sciences on the World Wide Web at aces.nmsu.edu.
Brand names appearing in publications are for product identification purposes only. No endorsement is intended, nor is criticism implied of similar products not mentioned. Persons using such products assume responsibility for their use in accordance with current label directions of the manufacturer.
Contents of publications may be freely reproduced for educational purposes. All other rights reserved. For permission to use publications for other purposes, contact pubs@nmsu.edu or the authors listed on the publication.
New Mexico State University is an equal opportunity/affirmative action employer and educator. NMSU and the U.S. Department of Agriculture cooperating.
Printed and electronically distributed November 2009, Las Cruces, NM.