Mesilla Valley Pecan Orchard Pruning Residues:
Biomass Estimates and Value-Added Opportunities
RR-764
Jeff C. Kallestad, John G. Mexal and Ted W. Sammis
College of Agricultural, Consumer and Environmental Sciences, New Mexico State University
Authors: Respectively, Agriculture Research Tech, Washington State University, Pullman; Assistant Department Head, Department of Plant & Environmental Sciences; and Professor, Department of Plant & Environmental Sciences, both of New Mexico State University.
Abstract
As pecan orchards have become a major component of agriculture in southern New Mexico and west Texas, open burning of orchard prunings has become a growing environmental concern. In addition, recent national interest in finding alternative energy sources to reduce our dependency on foreign oil has given agricultural waste new importance as a potential source of fuel for biomass energy production. Since previous estimates for total pecan pruning residue in this region have relied on limited field data and coarse extrapolations, a more comprehensive field survey of pruned biomass and pruning practices is needed to assess the potential of this resource. We have also incorporated data from satellite imagery and the Doña Ana County property assessment office to generate more accurate estimates of land area in pecans that could provide economic quantities of harvestable waste material. A scenario-based model to estimate regional biomass was developed that incorporates orchard maturity, orchard size, "on" versus "off" year pruning cycles, tree density, pruning objective (maintenance versus corrective), and the impact of a new practice to mechanically shred and leave prunings on the orchard floor as mulch. In 2006, pecan prunings were collected and weighed in seven orchards throughout the Mesilla Valley of southern New Mexico. Material from orchards that had undergone maintenance pruning averaged 3.5 green tons per acre (GT/ac),while 8.4 GT/ac were harvested from orchards that had undergone corrective structural pruning. Of the 248 orchard blocks visited throughout the Mesilla Valley, 41% were pruned that winter, going into an "off" year. Of those, 9% underwent corrective pruning. More than half of the orchards were pruned with mechanical hedging machines. The annual biomass estimated by the scenario-based model ranged from 12,791 to 41,523 bone dry tons (BDT). Given that biomass power plants currently operating in California consume approximately 18,000 BDT per MW of power produced, and that the smallest plant still operating has a capacity of 4.5 MW and consumes 35,000 BDT of lumber production waste/yr, we conclude that commercial power production based solely on pecan prunings from the Mesilla Valley would not be feasible currently. However, as fuel prices increase and interest in renewable energy changes, technical obstacles associated with procuring, stockpiling, and processing pecan biomass may be overcome to enhance the feasibility.
Introduction
Pecans orchards have become a major component of agriculture in southern New Mexico and west Texas. Nearly one-third of irrigated acreage in the Elephant Butte Irrigation District in the Mesilla Valley has been planted to pecans. As these trees mature, orchard managers prune the trees to maintain tree height and increase light penetration into the orchard. Typically, these prunings have been collected and burned in open pits on site. The smoke generated from these burnings has prompted complaints among neighbors and environmental concerns among regulators. As this region becomes more populated, alternative pecan production practices are needed to address growing environmental concerns. Finding alternatives to open burning of orchard prunings has become part of the local discourse.
Recently, southern Doña Ana County in New Mexico and El Paso County in Texas have failed to meet the national ambient air quality standards for one or more of the seven criteria pollutants, having levels of ozone and particulate matter with aerodynamic diameter ≤ 10 µm (PM10) above the national standards. Under the federal Clean Air Act, each state must develop a State Implementation Plan (SIP) describing how and when they will attain national ambient air quality standards.
New Mexico orchard owners have expressed concern that the enforcement of air quality standards and the banning of agricultural burning occurring in California will possibly be replicated in the Mesilla Valley as part of this SIP. In 2003, California reduced its allowable average annual PM10 emissions to 20 µg/m3, well below the national standard of 50 µg/m3. The 24-hour PM10 standards were also reduced to 50 µg/m3, compared to the national standard of 150 µg/m3. Consequently, California orchard owners are chipping orchard residue instead of burning. Some burning will be allowed in cases where it is required to destroy pathogens. At issue is whether an equivalent air quality problem resulting from agricultural burning exists here in southern New Mexico.
Although the Mesilla Valley is smaller than California's San Joaquin Valley (50 miles long, 3 to 3.5 miles wide), it has a greater population density. Neither the New Mexico Environment Department (NMED) nor the US Environmental Protection Agency (EPA) have sufficient stations or personnel to monitor orchard burning. Two NMED stations are located well above the valley floor, too far away from the orchards to effectively monitor smoke. The remaining Doña Ana County stations are located along its southern border to monitor air pollution entering the US airshed from Ciudad Juárez, Chihuahua, Mexico. Nevertheless, there are days during the winter months when air quality in the valley is visibly compromised by open burning.
In spite of concern for air quality standards, there is little information about the amount of material burned every year. Biomass estimates for pecan pruning residue in this region vary by a factor of three. Differences in the estimates arise from extrapolations derived by multiplying the per acre biomass by the total county acreage in pecan, or a per tree biomass value by an assumed tree density and region-wide total acreage in pecan production. Differences also arise because of the estimated effect of alternating pruning cycles, estimated proportion of orchards undergoing corrective structural pruning, and estimated average moisture content of green prunings. Mexal et al. (2003) estimated 1,000 lbs/ac/yr based on modeled tree branch prunings of about 80 lbs per tree per year, multiplied by 50 trees per acre, and corrected for pruning in alternating years and alternating rows. Their overall estimate was 40 million lbs (20,000 tons) per year for the Mesilla Valley. Cabral (2005), using data provided by Dr. William Lindemann at New Mexico State University, estimated that the amount of biomass could range from 2,400 to 9,600 lbs/ac/yr, depending on whether an orchard was undergoing a maintenance pruning or corrective structural pruning. Overall estimates were 28,000 green tons per year for the Mesilla Valley; after correcting for 50% moisture content, the final dry weight estimate was 14,000 tons per year. In a collaborative report by the Eastern Research Group, Inc. and Enviro-Tech Communications (2002), pecan pruning residue was estimated at 3,400 lbs/ac. This estimate was based on a 2001 study from Cochise County Arizona compiled by the Arizona Department of Environmental Quality.
The objective of our report is to estimate the amount of pecan branch biomass that may be produced on a recurring basis in the Mesilla Valley.
Materials and Methods
There are numerous limitations involved in the quantification of agricultural residues generated by Mesilla Valley pecan growers. Estimates are valid for only a short period of time due to the changing proportion of land converting to pecan orchards, coming into maturity, undergoing corrective pruning, or being sold for suburban development. Sampling methods need to account for different pruning practices in "off" versus "on" years, and data need to be stratified by orchard maturity and tree density. Useful information can also be deduced when the data are partitioned by farm size.
Tax Office Data
Information about land area planted to pecan trees was provided by the Doña Ana County Tax Assessor's Office in Excel files and ArcGIS shape files sorted by parcel size. The total land area planted to pecans determined by the Doña Ana County tax assessor was initially 16% lower than pecan acreages previously published by the United States Department of Agriculture National Agricultural Statistics Service (USDA NASS, 2004), which reported 23,745 acres in Doña Ana County from the 2002 national census of agriculture. The county tax assessor's data had many duplicated records with identical IDs, map codes, owners, addresses, and acreages. After duplications were filtered out of the data set, pecan acreage totaled 20,058. Sources of error in the county assessor's data may have come from parcel polygons divided by a canal or drainage ditch that were counted more than once, or total parcel acreage counted when it was only partially planted to pecans.
Using the county tax assessor's shape files of pecan acreage merged with the GPS coordinates of the pruning survey sites, additional unreported acres were identified and verified using satellite imagery with Google Earth software. These corrections put the tax assessor's data at 23,416 acres, within 2% of the NASS figure.
The county data were further partitioned by parcel acreage classes, and sorted by parcels less than 10 acres, greater than or equal to 10 acres but less than 50 acres, greater than or equal to 50 acres but less than 200 acres, and greater than or equal to 200 acres. Since some landowners hold many parcels of different sizes, the database was also sorted by owner/land manager, and the cumulative acreages were then sorted into the same size classes. The rationale behind sorting the data by owner and then by area size class was to consolidate acreage held by owners with multiple parcels. The consolidated acreage gives a better perspective of revenue potential per owner than by size-classified parcel.
The rationale behind partitioning the parcel size classes at these breakpoints was based on the following assumptions:
a) It may not be economically feasible to collect pruned material from orchards 10 acres or smaller, especially if the parcels are widely distributed. Orchards of this size are likely to be owned by "hobby" farmers who do not rely entirely on farming income for their livelihood, cannot afford mechanical pruning contractor fees ($350/hr), and may not intensively manage their orchard.
b) Orchards with 10.1 to 50 acres are likely to be more carefully managed and pruned regularly, but may not produce enough income for the owner to afford mechanical pruning contracts.
c) Orchards 50.1 to 200 acres are likely to be full-fledged commercial operations that either own their own mechanical pruning machinery or arrange for a pruning contractor service on a regular basis. These orchards may also produce enough biomass that, if burned, would require NMED burning registration.
d) Orchards greater than 200 acres are similar to the 50-200 acre orchards, except that the amount of pruned material would require NMED burn registration if burned all at once. These orchards may also generate enough revenue to afford to own or contract a branch shredder to chip the material and leave it on the orchard floor so that burning would not be required, which eliminates labor costs involved in conventional push, pile, and burn operations.
Satellite Imagery Assessment
To gain a better understanding of average pecan tree density for the Mesilla Valley in general, as well as proportional density stratified by management size class (cumulative acreage per orchard manager), satellite imagery using Google Earth was used to confirm measured tree spacing at each of the 248 survey sites and determine any skip patterns in the orchard (mortality or removals).
Field Data Collection Methods
Pruned branch weights. In February 2006, pecan prunings were weighed at seven orchards throughout the Mesilla Valley. A small, single axle trailer, approximately 6 feet wide by 8 feet long, was pulled to the orchards and set on three portable truck scales, one scale under each wheel and the other under the trailer post. The trailer was off the hitch during the weighing (Figure 1). Branches were removed from the orchard floor within an area defined as the space between three trees in a row and across two rows. The plot was measured from tree center to tree center. Because trees in every other row were pruned, the material weighed from the area represented prunings from two trees total: all of the prunings from the center tree and half of the two flanking trees. Identifying the source trees for the material was fairly obvious. Three or four measurements (replications) from equal-sized plots were taken at each orchard. Since the pruning machinery may have moved the fallen branches as it drove through the orchard, replicate weight measurements were taken from contiguous areas. Approximately 20-30 lbs of branch material were cut from each orchard and air dried for six months to obtain a wet to air-dried conversion factor. Averaged biomass per area was calculated as
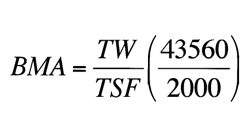
where BMA is the averaged biomass per acre (green tons), equivalent to the total cumulative branch weight (lbs) in all of the weighed plots for a particular orchard (TW) divided by the total cumulative area (ft2) of all plots measured in an orchard (TSF). Measured values are multiplied by the square foot area per acre and divided by lbs/ton to derive BMA. In the case of the one orchard where trees were pruned every third row, the measured plots were representative of only 66% of the orchard area, so the computed BMA was corrected by a factor of 0.66.
The averaged weight per tree (ATB) was calculated as
![]()
where n is the number of plots weighed in a particular orchard, mi is the weight of the prunings in a plot, and ti is the number of trees from which the prunings were sampled in a plot. Branch moisture content was estimated using a GE Protimeter.
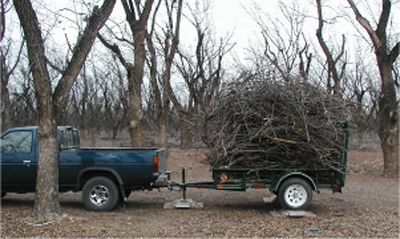
Figure 1. Collected prunings from a 60 ft × 60 ft area in a pecan orchard. Trailer wheels and post are positioned on portable truck scales. The trailer tongue is off the hitch.
Pruning survey. To estimate the percentage of orchards pruned prior to an "off" year, 241 survey sites in the Mesilla Valley were visited from late February to mid-March 2006. Information about tree maturity (Table 1), tree density, pruning method, and pruning program by tree and row were obtained by visual inspection. In many cases, row spacing affected the assignment of maturity rank based on canopy cover. Trees with trunk diameters fitting a certain stage criterion but having the canopy cover for a lower rank because of the wider row spacing were given a half-stage lower rank. Likewise, trees with diameter at breast height (DBH, breast height = 1.4 m) and canopy cover near the next highest rank threshold were given a half-stage higher rank. In 27 of the survey sites where formerly mature trees had been de-branched and transplanted, assignment of maturity rank was based solely on canopy cover.
The rationale behind the maturity rank was to establish a mechanism by which short-term BMA approximations can be weighted using estimates of acreage classified by orchard size and maturity. Acreage ranked with low maturity can be used in long-term projections of biomass availability.
Table 1. Criteria Used to Rank Tree Maturity in Orchards Surveyed in 2006
| Rank | Canopy, tree, and pruning characteristics |
| 1 | Canopy cover < 50%, DBH < 15 cm, pruning not required |
| 2 | Canopy cover 50-70%, DBH 15-29 cm, only light pruning |
| 3 | Canopy cover 70-85%, DBH 30-40 cm, variable pruning intensity |
| 4 | Canopy closed, DBH > 40 cm, trees pruned infrequently but could potentially undergo corrective pruning |
Regional Biomass Estimation Model
Given the highly variable nature of pruning practices due to tree maturity, orchard size, and economic factors, a scenario-based model for estimating regional biomass (RB, in bone dry tons) was derived using four scenario coefficients to scale possible harvestable material based on the effects of alternate bearing cycles, pruning objectives, pruning disposal methods, and feasibility of collecting material from widely distributed small orchards. Pruning biomass within the Mesilla Valley was estimated as follows:
The non-scenario-based values are: w, branch water content, to scale estimated green biomass to bone dry tonnage; a1, total land area in orchards having less than 10 acres; a10, total land area in orchards having 10 or greater acres but less than 50 acres; a50, total land area in orchards having equal to or greater than 50 but less than 200 acres; and a200, total land area in orchards having greater than 200 acres. The averaged biomass per tree was estimated from the branch weights measured at individual orchards for both maintenance (bm/tm) and corrective (bm/tc) pruning objectives. Tree density per acre (δ) was averaged within each of the orchard size classes. The orchard maturity coefficient (μ, unitless) was averaged within each orchard size class. A maturity rank of 3 or 4 was given a μ value of 1, whereas a maturity rank of 1 was given a μ value of 0. These non-scenario based values are listed in Table 2.
The four scenario-based coefficients are pᵢ, which accounts for the percentage of biomass that could be procured from widely distributed small orchards. It is assumed that biomass from acreage less than 10 acres could not be economically collected unless it is adjacent to a larger orchard. The proportion of orchards pruned in "off" versus "on" years is scaled by the coefficient bi. The percentage of orchards undergoing corrective pruning is scaled by the scenario coefficient ci. The percentage of the largest orchards that can remove available biomass by chipping the residue and leaving it on the orchard soil is scaled by scenario coefficient ri. Values for the scenario coefficients are listed in Table 3.
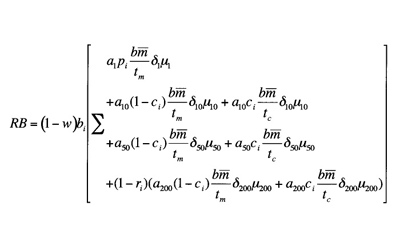
Table 2. Average Values Used for Parameters in the Biomass Estimation Model
| Symbol | Description | Units | Avg. value |
Std. deviation |
| bm/tm | Average branch weight per tree, maintenance pruned | lbs | 258.4 | 100.6 |
| bm/tc | Average branch weight per tree, corrective pruned | lbs | 695.0 | 152.7 |
| a1 | Total area in orchards < 10 acres | acres | 2,300.6 | - |
| a10 | Total area in orchards ≥ 10, < 50 acres | acres | 2,511.8 | - |
| a50 | Total area in orchards ≥ 50, < 200 acres | acres | 3,849.9 | - |
| a200 | Total area in orchards > 200 acres | acres | 14,789.3 | - |
| δ1 | Averaged tree density in orchards with < 10 acres | trees/acre | 48.78 | 12.61 |
| δ10 | Averaged tree density in orchards ≥ 10, < 50 acres | trees/acre | 42.88 | 11.89 |
| δ50 | Averaged tree density in orchards ≥ 50, < 200 acres | trees/acre | 39.81 | 11.27 |
| δ200 | Averaged tree density in orchards > 200 acres | trees/acre | 38.97 | 10.11 |
| µ1 | Averaged maturity coefficient in orchards < 10 acres | - | 0.574 | 0.67 |
| µ10 | Averaged maturity coefficient in orchards ≥ 10, < 50 acres | - | 0.905 | 0.62 |
| µ50 | Averaged maturity coefficient in orchards ≥ 50, < 200 acres | - | 0.958 | 0.65 |
| µ200 | Averaged maturity coefficient in orchards > 200 acres | - | 1.012 | 0.58 |
| w | Mass moisture content of pruned branches | g H2O/g wood | 0.54 | 0.058 |
Table 3. Scenario-Defined Coefficients Used in the Regional Biomass Estimation Model
| Scenario | Coefficients | ||||
| No. | Description | bi | pi | ci | ri |
| 1 | Going into an "on" year, 70% of orchards are pruned; 50 % of small orchard material can be procured economically; 15% of orchards undergo corrective pruning; prunings are chipped on 5% of the a200 land area. | 0.7 | 0.50 | 0.15 | 0.05 |
| 2 | Going into an "on" year; 60% of orchards are pruned; 25% of small orchard material can be procured economically; 5% of orchards undergo corrective pruning; prunings are chipped on 20% of the a200 land area. | 0.6 | 0.25 | 0.05 | 0.20 |
| 3 | Going into an "off" year, 40% of orchards are pruned; 25% of small orchard material can be procured economically; 10% of orchards undergo corrective pruning; prunings are chipped on 5% of the a200 land area. | 0.4 | 0.25 | 0.10 | 0.05 |
| 4 | Going into an "off" year, 30% of orchards are pruned; 15% of small orchard material can be procured economically; 5% of orchards undergo corrective pruning; prunings are chipped on 30% of the a200 land area. | 0.3 | 0.15 | 0.05 | 0.30 |
Results
Pruning Survey
The survey was designed to produce an estimate of maturity-ranking of only older pecan acreages for the Mesilla Valley. While the majority of orchards visited had a maturity ranking of stage 3 or higher (75% , Figure 2), most of the immature orchards or recently transplanted orchards were not visited.
Of the 248 surveyed blocks, 101 (40.7% ) were pruned in 2006, and 9 of those had undergone corrective pruning. That is, approximately 41% of the orchards were pruned going into the "off" year even though it is desirable to prune going into the "on" year. It is possible that these orchards were out of sync with the rest of the valley, or that stochastic variables such as weather events forced farmers to prune in the less-optimal year.
More than half of the orchards were pruned using mechanical hedging machines, while the other half were either pruned entirely by hand or used both methods (Figure 3A). Most orchards still prune dead wood and selected branches by hand even though the bulk of the tree may be pruned and shaped by the single bar topper/hedger machine.
In the majority of cases where mechanical pruning was used, the operator had to make two passes through the orchard, one for the vertical side cut and one for the angled top hedge cut. For orchards receiving a light maintenance pruning (13% of orchards), the trees were either top or side cut (Figure 3B).
Trees pruned by hand were primarily pruned on select branches (every row both directions or as needed), although many custom jobs also pruned the bulk of the tree in an every-other-row or every row in one direction pattern, similar to the mechanical pruning program (Figure 3C). In no cases were mechanically pruned orchards pruned in both directions in the same year. Only 5% of the orchards surveyed had an alternative pruning program different from the every-row or every-other-row program. Since branch prunings were not available to determine the frequency of pruning using terminal bud scars, the growth pattern on most mechanically pruned trees where alternate rows were pruned suggested that the frequency was every four years, or every-other-row in alternate years. One orchard owner said his trees were on a six-year cycle (pruning every third row on alternate years), but his trees and rows were spaced 40 feet apart, allowing for greater light penetration and longer pruning frequency.
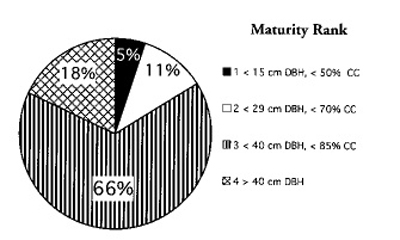
Figure 2. Percentage of maturity-ranked orchards visited in the pruning survey, where DBH = Diameter at Breast Height and CC = Canopy Coverage.
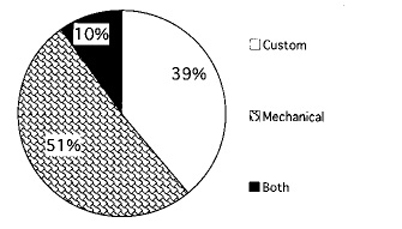
Figure 3A. Pruning method by orchard within orchards surveyed.
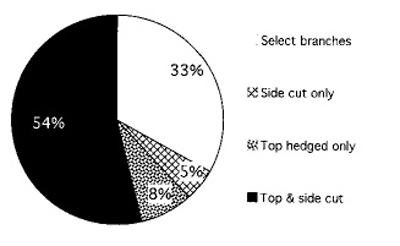
Figure 3B. Pruning method by tree within orchards surveyed.
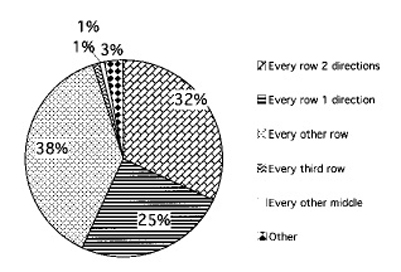
Figure 3C. Pruning method by row within orchards surveyed.
Orchard Tree Density
Assumptions about tree density can have a significant effect on estimates of biomass when extrapolated for total acreage planted to pecans. To minimize this potential error, the pruning survey database was queried to determine an average tree density for each of the orchard size classes. Tree density values listed in Table 4, matching either ground-truthed measurements of tree and row spacing or measurements taken from satellite imagery, were used for data input. Orchard sizes were based on information derived from the Doña Ana County tax assessor's files. Acreage from separate parcels but managed (theoretically) by one owner or company were combined.
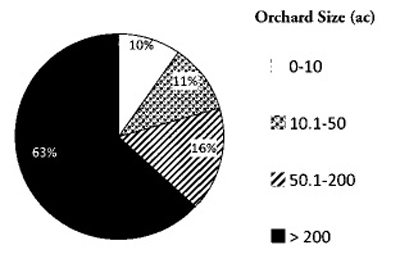
Figure 4. Doña Ana County land area in pecan orchards (USDA NAAS, 2004). Individual parcels have been combined into owner/management units.
Table 4. Tree Density as a Function of Tree Spacing, Row Spacing, and Skip Patterns
| Spacing Trees (ft) | Rows (ft) | Skip patterna | Density (trees/acre) |
| 30 | 30 | - | 48.4 |
| 31 | 31 | - | 45.0 |
| 33 | 33 | - | 40.0 |
| 35 | 35 | - | 36.0 |
| 30 | 40 | - | 36.3 |
| 35 | 40 | - | 32.3 |
| 30 | 50 | - | 29.0 |
| 40 | 40 | - | 27.0 |
| 50 | 50 | - | 17.4 |
| 30 | 30 | E2T/E2R | 42.0 |
| 30 | 30 | E4T/ER offset | 36.0 |
| 30 | 30 | E4T/E2R + E2T/E2R | 27.7 |
| 60 | 30 | offset | 24.2 |
| 20 | 40 | E2T/E2R | 40.8 |
| 30 | 40 | E2T/E2R | 30.3 |
| 30 | 30 | E5T/E2R offset | 38.7 |
| aE2T = every other tree, E4T = every fourth tree, E5T = every fifth tree, ER = every row, E2R = every other row, offset = a skip pattern within a row repeated in the adjacent row offset by one tree space | |||
On average, smaller orchards have more trees per acre than larger orchards (Table 5). The larger orchards tend to have more mature trees that require culling to open the orchard canopy for light penetration. However, orchards with less than 10 acres represent less than 10% of the total acreage, whereas orchards with greater than 200 acres represent 63% of the total acreage (Figure 4).
Table 5. Tree Density Averaged from Pruning Survey Data Stratified by Orchard Size Class
| Orchard size class (ac) | Tree density (trees/ac) |
Std. deviation | Sample size |
| 0-10 | 48.78 | 12.61 | 24 |
| 10.1-50 | 42.88 | 11.89 | 54 |
| 50.1-200 | 39.81 | 11.27 | 70 |
| > 200 | 38.97 | 10.11 | 100 |
Orchard Maturity Rank
In order to incorporate the effect of orchard maturity in the model estimation of pruning biomass, a unitless coefficient was derived. It was assumed that trees with a maturity rank of 3 would have a coefficient (µ) value of 1. More mature trees would be expected to produce more biomass, especially if they underwent corrective pruning. Likewise, younger trees would be expected to produce less biomass. Of the 248 survey sites visited, 57% had a ranking of 3 (Figure 2). When the µ coefficient was derived using measured branch weights and correlate maturity rank (m), a cubic polynomial relation (µ = 0.1952 m3 - 0.7382 m2 + 0.9159 m - 0.3728) best described the regression. However, since there was so much variability in measured branch weights and so few data points from orchards with lower maturity rank, a more conservative linear relation was derived based on the assumption that an orchard with a maturity rank of 4 would produce approximately 75% more biomass than an orchard with a maturity rank of 3, and an orchard with a maturity rank of 1 would not produce any biomass. For the model, maturity rank for the 248 sites visited during the pruning survey was averaged for each of the orchard size classes and converted to µ (Table 6) using the following function:
![]()
Table 6. Maturity Coefficient (µ) Derived from Averaged Maturity Rankings for Each Orchard Size Class
| Orchard size class (ac) | Mean maturity rank | Std. dev. | n | µ |
| 0-10 | 2.31 | 0.67 | 24 | 0.574 |
| 10.1-50 | 2.81 | 0.62 | 54 | 0.905 |
| 50.1-200 | 2.89 | 0.65 | 70 | 0.958 |
| > 200 | 2.97 | 0.58 | 100 | 1.012 |
Pruned Branch Weights
The weight of branch prunings per acre varied from 0.91 to 9.7 GT (Table 7). The heaviest prunings were recorded at orchards 6 and 7 that were undergoing corrective pruning to reduce tree height. Diameter of pruned branches at the cut end frequently exceeded 4 inches (10 cm). The lightest pruning weight was recorded at orchard 4, where trees and rows were spaced approximately 40 ft apart and the trees of every third row were pruned. Both of these extremes do not necessarily represent typical pruning situations. Classified by pruning objective, and eliminating the atypical pruning program, the average wet weight per tree was 258 lbs for maintenance pruning and 695 lbs for corrective pruning; the average wet weight per acre would be 3.5 GT for maintenance pruning and 8.4 GT for corrective pruning.
Moisture content measurements of branch samples taken from each orchard where pruning branch weights were measured indicated that, on average, the initial mass moisture content was about 0.54 ± 0.058 grams of water per gram of wood.
Table 7. Pruning Weights Collected at Mesilla Valley Orchards in February 2006
| Orchard | Plot no. | Weight (lb) | Plot area (ft2) | Averaged weight per tree (lb) |
Averaged weight per area (GTa/ac) |
|
Orchard 1 Trees spaced 25 ft, rows spaced 33 ft Mechanical pruning: top-hedged and side cut E2Rb |
1 | 610 | 3,300 | 275 |
3.63 SD = 0.50 CV = 13.8% |
| 2 | 470 | ||||
| 3 | 500 | ||||
| 4 | 620 | ||||
|
Orchard 2 Trees spaced 25 ft, rows spaced 30 ft Custom pruning: top and side cut E2R + selective ERc |
1 | 510 | 3,000 | 273 |
3.96 SD = 0.36 CV = 9.0% |
| 2 | 580 | ||||
|
Orchard 3 Trees spaced 30 ft, rows spaced 30 ft Mechanical pruning: side cut E2R |
1 | 430 | 3,600 | 128 |
1.54 SD = 0.77 CV = 49.8% |
| 2 | 210 | ||||
| 3 | 250 | ||||
| 4 | 130 | ||||
|
Orchard 4 Trees spaced 41 ft, rows spaced 41 ft Mechanical pruning: side cut E3Rd, on adjacent row top-hedge one side E3R |
1 | 370 | 6,724 | 213 |
0.91 SD = 0.29 CV = 21.1% |
| 2 | 380 | ||||
| 3 | 530 | ||||
|
Orchard 5 Trees spaced 30 ft, rows spaced 30 ft Mechanical pruning: top-hedged and side cut E2R |
1 | 370 | 3,600 | 403 |
4.88 SD = 2.29 CV = 47.0% |
| 2 | 1,000 | ||||
| 3 | 1,050 | ||||
|
Orchard 6 Trees spaced 30 ft, rows spaced 30 ft Mechanical pruning: corrective top and side cut E2R |
1 | 1,310 | 3,600 | 803 |
9.71 SD = 1.34 CV = 13.8% |
| 2 | 1,680 | ||||
| 3 | 1,590 | ||||
| 4 | 1,840 | ||||
|
Orchard 7 Trees spaced 30 ft, rows spaced 30 ft Mechanical pruning: corrective top and side cut E2R |
1 | 1,120 | 3,600 | 587 |
7.10 SD = 1.36 CV = 19.2% |
| 2 | 980 | ||||
| 3 | 1,420 | ||||
|
aGreen ton |
|||||
Model Estimates of Biomass Availability
The results of the model-estimated biomass indicate harvestable pruning material ranging from 12,791 to 41,523 BDT (Table 8). The model-estimated 41,523 BDT could be harvested using the "best case" scenario (Table 8, scenario 1) assuming that, going into an "on" year, 70% of the orchards were pruned, 50% of the pruned material from orchards having less than 10 acres could be economically collected, 15% of the orchards underwent corrective pruning, and only 5% of the orchards with greater than 200 acres had their pruned material shredded and left on the orchard floor. The model computed 12,791 BDT of harvestable material given the assumptions from the "worst case" scenario (Table 8, scenario 4) that, going into an "off" year, only 30% of the orchards were pruned, material from only 15% of the orchards having 10 acres or less could be economically collected, 5% of the orchards underwent corrective pruning, and 30% of the orchards with greater than 200 acres had their material shredded. Results from scenarios 2 and 3 represent intermediate estimates of biomass availability.
Table 8. Model-Estimated Harvestable Biomass (cumulative, and from each orchard size class, using scenario coefficients found in Table 4)
| Scenario | Material from orchards 1-10 acres (BDT) | Material from orchards 10.1-50 acres (BDT) | Material from orchards 50.1-200 acres (BDT) | Material from orchards > 200 acres (BDT) | Cumulative harvestable biomass (BDT) |
| 1 | 1,341 | 3,629 | 7,659 | 28,894 | 41,523 |
| 2 | 575 | 3,768 | 5,680 | 18,044 | 28,067 |
| 3 | 383 | 2,708 | 4,082 | 15,398 | 22,570 |
| 4 | 172 | 1,884 | 2,840 | 7,894 | 12,791 |
To gain perspective on the effects of pruning management that matches alternate bearing cycles on the availability of harvestable biomass, or the effect of increased utilization of the shredding machines in the a200 orchards, the model was run by varying either bi or ri coefficients while holding the others in scenario 2 constant. These analyses indicate that increasing the proportion of pruned orchards going into an "on" year by 10% results in an 18% increase in harvestable biomass (Figure 5), but increasing the proportion of shredder use by 10% results in an 8% decrease in harvestable biomass.
Discussion
Energy Production
There are three key issues regarding the utilization of pecan pruning biomass for energy production: fuel value of the material, scaling biomass availability to new and existing markets while accounting for unreliable (and potentially diminishing) supply, and technical obstacles involved in procuring, stockpiling, and processing the biomass.
Fuel value. One ton of clean wood with lower fuel value (higher proportion of bark) has approximately 8 GJ of energy value, which is equivalent to 7.58 × 10⁶ BTU. Expressed in terms of power, with 1 MW equivalent to 3.412 × 10⁶ BTU/hr, efficiently burning 0.45 ton/hr would generate 1 MW. Annualized, a 100% efficient power plant would burn 3,943 tons of wood to generate 1 MW capacity. In reality, even the most efficient biomass gasification plants operate at 20-40% efficiencies, so a plant may need to burn 19,700 tons to generate 1 MW capacity. This is approximately what is observed at California's remaining biomass gasification plants (Figure 6), which consume approximately 18,000 BDT per MW of capacity.
Scaling biomass availability. As of 1997, the smallest fluidized bed type gasification plant still in operation in California had a capacity of 21 MW and consumed 175,000 BDT/yr. The smallest plant with an open grate type boiler had a capacity of 4.5 MW and consumed 35,000 BDT/yr. Based on the minimum model-estimated harvestable biomass of 12,791 BDT (ignoring the technical obstacles associated with procuring, stockpiling, and processing the material), commercial power production based solely on this resource would not be feasible.
Given the current recommended cost threshold of $0.06254 per kWh set by the El Paso Electric Company for contract power suppliers, one ton of wood, which has an equivalent energy value of 2,222.2 kWh, would have a maximum theoretical dollar value of $138.97 based on this cost cap. Assuming 22.5% power generation efficiency, the dollar value of that ton of wood would be $30.58. After deductions for plant operating costs, overhead, debt amortization, and costs incurred from collecting, transporting, stockpiling, and processing the fuel, the dollar value of that ton of wood rapidly dwindles to what pecan growers are currently paying workers to push, pile, and burn the material (3.5 ton/ac at $16.50/ac = $4.71/ton). While there may be a small margin for profit on a per ton basis, especially as power production efficiency increases, the small scale of the resource would limit the size of the production facility, as well as the ability of potential suppliers to acquire credit to build and operate a facility.
Currently, prunings are not a reliable resource. While it is a recommended practice to prune alternate bearing trees going into their heavy bearing year in order to minimize yield differences between "on" and "off" years, there are probably as many pruning programs in the Mesilla Valley as there are orchards, and these are constantly changing. Currently, some of the older orchards are going through a cycle of canopy height reduction in both "on" and "off" years. After that, annual pruning loads may be less than they are today, as these trees will then be maintenance pruned. In the future, as more orchards mature the pruning industry may also mature and develop more consistent pruning practices, and the recurring biomass availability would be more consistent from year to year.
Weather is a stochastic variable that can alter resource availability. A wet winter can prevent pruning equipment from entering the orchard. If wet conditions persist much after bud break, growers have no alternative but to prune the following year. Given the small number of pruning contractors, even a short delay due to weather may result in drastic reductions in harvestable material.
Technical obstacles. Assuming that a power production facility could be centrally located in the Mesilla Valley so that the fuel density distribution was optimal, the greatest technical difficulties to utilizing pruning biomass would be procuring a year's supply of material within a period of 2 to 3 months from a 150 square mile area, doing a minimal amount of processing, and stockpiling the biomass near the production facility.
There are a number of scenarios for the procurement of pruning residue for energy feedstock:
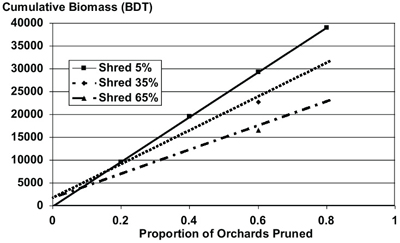
Figure 5. Effect of increasing the proportion of orchards pruned going into an "on" year on harvestable biomass assuming 5%, 35%, or 65% shredder use in orchards larger than 200 acres.
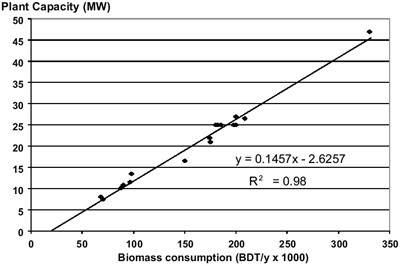
Figure 6. Relationship between California plant power capacity, utilizing fluidized bed type boilers, and annual biomass consumed (NREL/SR-430-22765).
a) Branches can be pushed and piled to the ends of the orchard rows by the grower's crew where they are loaded onto trailers and taken to a landing site (currently burn site), as is currently practiced. The energy company contractor would either chip or bale the material at the landing site and haul it to the stockpile yard at the energy generating facility.
b) Branches can be pushed to the end of the blocks by the grower's crew where the energy contractor can collect, chip, or bale the material and haul it to the stockpile location.
c) The energy contractor can collect the branches in the orchard, eliminating one step, and process the material at the orchard or haul it to the energy plant.
There are several critical unknowns regarding the interaction of orchard owners with energy contractors. Soil compaction resulting from pruning, collecting, and removing the prunings is an important concern, as is cross contamination of soil from other orchards, which may carry pathogens. However, both of these are concerns with current practices, and biomass removal may not increase the risk of soil compaction or contamination. Baling equipment, used in forestry operations, has not been evaluated in these orchard settings. Furthermore, chippers currently used in orchards are not equipped to collect the chips. Ideally, the collection process must be rapid and efficient, and must be completed before mid-March. Since many orchards do not have excess space for storing branches until they can be processed, the collection phase of the procurement process should occur within the farming cycle, i.e., after nut harvest but before bud break in the spring (approximately mid-December to mid-March). Ultimately, costs associated with procurement efficiency (tons of material acquired per day) would dictate the method of procurement.
Several large orchards have either invested in their own shredding machines or contract companies to do the shredding. This alternative to burning, which may not be cost-effective for the smaller scale orchards, would eliminate a significant amount of fuel for energy production. Shredding and incorporating prunings into the orchard soil provides minimal benefit in terms of nutrients or soil quality, but research into the decomposition of shreddings has determined that there are no short-term problems associated with adding shredded material to the soil. The benefits to the large orchard owner come from the comparative costs associated with owning and operating the machine versus the savings in labor costs associated with the push, pile, and burn method. This has important implications with regard to treating the prunings as a resource rather than a waste management problem. To tip the equation in favor of treating prunings as a resource, the revenue from the sale of pruning residue must sufficiently offset the labor and overhead costs of pushing and piling the material so that the net cost is lower than the cost associated with owning and operating a shredder. Compensation could also come in the form of state and federal tax credits for biomass fuel production.
In one feasibility study, Cabral (2005) assumed that the cost of procuring the biomass fuel or material for mulch, using a small work crew and a few chipping machines, could be charged to orchard owners at the same rate that it currently costs to push, pile, and burn the material. The proposal also suggests that growers would have to coordinate farm practices with the procurement contractors.
Part of what makes these applications attractive to business is the potential to use tipping fees from growers to partially subsidize the cost of collection from the orchards. A tipping fee from growers has been built into the business pro-forma projections roughly commensurate to what it costs growers currently to simply stack and burn waste wood. Now growers prune and burn randomly. In order for this system to work [turning prunings into mulch], growers must coordinate pruning regimes so that there is an even supply. One chipper and a two person crew can cover 46 acres per day and produce 115 tons of material per day. Over a six month period this translates into 15,000 green tons, which becomes 7,500 tons after drying.
The notion that an independent contractor can procure enough material from all of the participating orchards to run a biomass energy or mulching operation and charge the orchard owners what it currently costs for them to pile and burn with their own crew is overly optimistic. For example, just a few years ago, pecan shells were considered waste and were free for the taking. Today, they are a resource sold to nurseries and landscapers for use as mulch. The same can be expected of pecan pruning wood in the future.
Getting pecan growers to coordinate their farming practices to suit the schedule of any orchard management contractor is already difficult. Furthermore, growers will not tolerate piles of bulky, combustible material waiting to be picked up and processed at the edges of their orchards during the growing season, and certainly will not allow a contractor to remove branches from the orchard floor during the growing season. It must be assumed that pruning and collection must be concluded within a three-month period, not a six-month period.
Failing to provide compensation for the fuel resource would strip away any incentive for growers to participate in a biomass collection program. For reasons outlined below it may be both more efficient and more economically attractive for push-pile operations to proceed as they currently do using the owner's on-farm labor or temporary for-hire crews (at an estimated cost of $16.50 per acre), then have the energy or mulching contractor drive-up, process the pruning residue, and pay the orchard owners for the gathered material. If growers get $3 to $10 per green ton for prunings and an additional energy production tax credit on a per ton basis, they may be more inclined to participate in the program. If they pay the same either way, there is no incentive. From the energy producer's perspective, procuring dry material for biomass energy at a net cost of $10/BDT would be one-tenth the cost of the fuel oil needed to produce an equivalent amount of energy.
Large-Scale Business Opportunities-Biomass Energy Production
In the early 1990s, California led the world in energy production from renewable resources (including solar and geothermal). In the 15 years following the oil crisis in the 1970s, California put about 1,000 MW of power generating capacity into service using biomass fuels. In 1994, California restructured its electric utility industry, and deregulation allowed for competition among alternative generating sources on the basis of price alone; there was no regard for resource diversity or environmental impacts. As a result, 95% of the biomass power in California was bought by Pacific Gas and Electric Company and Southern California Edison, and 16 facilities were shut down. The expiration of the initial 11-year fixed-price purchase contracts, cheap oil prices in the late 1990s, and the current low short-term power purchase rates have not allowed these facilities to resume operation.
All of the biomass energy facilities in California utilize steam-turbine technology. Generating efficiency has been around 1.25 BDT/MWh. Fuel costs fell from a range of $34 to $50/BDT in 1993 to $20/ BDT in 1995.
Orchard and vineyard prunings in California have been more expensive and difficult to use as fuels because the orchards are not concentrated in a localized area, which increases travel costs and, in turn, procurement costs. When compared to urban waste and sawmill waste residues with higher source densities, agricultural and orchard residues are more costly. Consequently, biomass power producers estimate that only 5-10% of pruning residues are converted into fuel. The Mesilla Valley has an advantage because the source of prunings is relatively confined, with a north-south distance of less than 50 miles and with increasing acreage. However, this increase in acreage is coming at the expense of other crops, such as cotton and chile. According to the El Paso Electric Company's 2006 Diversity Request for Proposals for Renewable Energy Supply, El Paso Electric considers overall reliability, availability, dispatch flexibility, and cost of the various renewable resources when awarding contracts. Before pecan prunings will be accepted as a fuel source, resource reliability, costs of procurement, and competing uses must be determined. In the near future, multiple smaller-scale energy plants, or a modular tandem power plant, may be the best alternative for utilizing pecan biomass for energy.
Literature Cited
Cabral, D. (2005). A feasibility study for alternatives for the commercial utilization of pecan wood waste from pruning New Mexico orchards. Produced by New Mexico Manufacturing Extension Partnership and Sandia National Laboratories.
Eastern Research Group, Inc., & Enviro-Tech Communications. (2002). Non-Burning Management Alternatives on Agricultural Lands in the Western United States, Volume 1: Agricultural Crop Production and Residue Burning in the Western United States (E.R.G. no. 3261.00.005.001). Sacramento, CA: Author.
Mexal, J. G., Herrera, E. A., Sammis, T. W., & Zachritz, W. H. (2003). Noncommensurable Values of the Pecan Industry (Guide H-654). Las Cruces, NM: New Mexico State University Cooperative Extension Service.
United States Department of Agriculture National Agricultural Statistics Service. (2004). Pecans: Orchards, acreage, and production by county. Retrieved 15 June 2006 from http://www.nass.usda.gov/nm/nmbulletin/62_04.pdf
To find more resources for your business, home, or family, visit the College of Agricultural, Consumer and Environmental Sciences on the World Wide Web at www.cahe.nmsu.edu
Contents of publications may be freely reproduced for educational purposes. All other rights reserved. For permission to use publications for other purposes, contact pubs@nmsu.edu or the authors listed on the publication.
New Mexico State University is an equal opportunity/affirmative action employer and educator. NMSU and the U.S. Department of Agriculture cooperating.
Printed and electronically distributed December 2008, Las Cruces, NM