International Trade in Chile Peppers: Data from the Global Trade Atlas® 1,2
New Mexico Chile Task Force Report 16
By Leslee Morris and Rhonda Skaggs
College of Agriculture, Consumer and Environmental Sciences, New Mexico State University
Authors: Respectively, Former graduate research assistant and professor, respectively, Department of Agricultural Economics and Agricultural Business, College of Agriculture and Home Economics, New Mexico State University.
What is this report’s objective?
This report’s objective is to address questions that have been raised by members of the New Mexico Chile Task Force. Since the task force’s inception in 1998, questions have arisen about international trade in chile peppers and pepper products. However, limited data about international trade in peppers and pepper products were available to address these questions. In 2003, the task force purchased a proprietary data product that is the best resource available for addressing multilateral international trade questions.
What data are presented in this report?
Multilateral trade data for 2002 are presented. Researchers obtained this data from the Global Trade Atlas®, sold by Global Trade Information Services, Inc. (GTIS).
What is Global Trade Information Services, Inc. (GTIS)?
GTIS obtains and processes official merchandise trade data from 45 countries and sells access to it through interactive databases posted on the company’s Internet site. GTIS provides subscribers with a username and password, allowing them access to the databases. GTIS corporate headquarters are in Columbia, S.C. The company also has offices in Washington, D.C., Paris and Tokyo.
Where does GTIS obtain trade data?
GTIS uses official data from the reporting countries (table 1). These data are usually provided by customs or national statistics agencies. The availability of historical data for these countries varies but usually goes back to 1995 or 1996. The 45 countries covered by GTIS account for more than 95 percent of world trade.
| Table 1: Countries reporting trade data to GTIS, Inc. | |||
| Region | County | Region | County |
| Africa | South Africa | Other Europe | Poland Russia Turkey |
| East Asia and Pacific |
Australia |
European Free Trade Association | Iceland Norway Switzerland |
| European Union |
Austria |
North America
|
Canada
|
| South America | Argentina Brazil Chile Colombia Peru |
||
How are the Global Trade Atlas® data organized?
The GTIS data include information on value, quantity, unit price, reporting country and trading partner country for both exports and imports classified in the Harmonized Tariff System (HTS). Trade data are available at the two-digit, four-digit and six-digit levels, down to the most detailed levels provided by each country. Data for a few countries and/or a few products are available at eight-digit and 10-digit levels in the GTIS product.
What is the Harmonized Tariff System (HTS)?
The HTS is a method for classifying both exports and imports. It is based on the metric standard and uses a series of digits, or codes, to classify products. HTS codes can have up to 10 digits. The greater the number of digits, the more detailed the product description and the less aggregated the data. HTS codes are harmonized internationally at the eight-digit level. This means that eight-digit codes are the same for all countries, but 10-digit codes are often different between countries. For a more detailed explanation of the HTS, see U. S. Imports and Exports of Chile Peppers and Pepper Products: Frequently Asked Questions, New Mexico Chile Task Force Report 15, available on the Web at www.chiletaskforce.org. The complete Harmonized Tariff Schedule of the United States is available from the U.S. International Trade Commission at: hotdocs.usitc.gov/tariff_chapters_current/toc.html.
What HTS codes are covered in this report?
Multilateral import and export data are reported here for the following HTS codes:
070960–Fruits of the genus Capsicum (peppers) or of the genus Pimenta (e.g., allspice), fresh or chilled. This code includes peppers produced in greenhouses and an “other” category.
090420–Fruits of the genus Capsicum (including cayenne pepper, paprika and red pepper) or of the genus Pimenta (including allspice), dried, crushed or ground.
Why are multilateral data presented here for only two HTS codes?
The Global Trade Atlas® contains very few multilateral data for fresh or chile pepper products classified at a higher level than the six-digit level.
How much did the Chile Task Force pay to access the GTIS data?
New Mexico State University (NMSU) researchers first accessed GTIS data in summer 2003, at a cost of $1,650. Data were downloaded over a period of three weeks. In early 2004, the GTIS database was reactivated at no additional cost. Researchers in NMSU’s Department of Agricultural Economics and Agricultural Business committed to purchase an additional subscription to the database in 2004.
Where can I find information about the many countries that import or export chile pepper products?
An excellent resource for information about the many countries that appear as importers and/or exporters in the Global Trade Atlas® is The World Factbook. This resource is published by the U.S. Central Intelligence Agency and is available online at www.cia.gov/cia/ publications/factbook/
What is a FTZ?
FTZ is the abbreviation for free trade zone. On the GTIS import and export data matrices, FTZs are listed as either importers or exporters. A free trade zone is a port or an area designated by the government of a country for duty-free entry of any non-prohibited goods. Merchandise may be stored, displayed or used for manufacturing within the zone and reexported without duties. The FTZs included in the chile pepper import/export matrices are in Turkey.
Other than FTZs, what other unusual import sources or export destinations are shown in the matrices?
The import and export matrices include the following terms: bunkering, stores and provisions. These terms cover items taken onto a ship for use on the ship.
Why are chile pepper and pepper products shown being exported from several countries that don’t produce significant quantities of peppers?
The pepper product export matrices (070960 and 090420) show large quantities of exports from several European countries. These countries are the site of significant transshipping of peppers and pepper products. Europe is the intermediate destination of the peppers and pepper products produced elsewhere. Many of the peppers and pepper products are ultimately shipped to a third country final destination. These peppers and pepper products are double-counted in the trade data reported here.
How do I access the GTIS multilateral pepper and pepper product matrices?
The matrices used in this report can be downloaded from the New Mexico Chile Task Force Web site (www.chiletaskforce.org). The four matrix files (all in Microsoft Excel™ worksheets) are 070960 Exporting Matrix, 070960 Importing Matrix, 090420 Exporting Matrix, and 090420 Importing Matrix.
How were the data in the import and export matrix files compiled?
The Global Trade Atlas® data are organized by reporting country. To construct the matrices, import and export data for each reporting country for each HTS code were saved in individual Excel™ worksheet files. Each column in each of the four matrix files represents a separate data file. The four matrix files are a compilation of 180 individual data files.
For what can the import and export matrices be used?
These matrices provide previously unavailable information about international trade in chile peppers and pepper products. The multilateral data provide insight into products’ international movements that are important to the New Mexico agricultural sector and the state’s overall economy. The data can inform users about the current status of markets, help to forecast potential market changes, and thus help predict where markets are headed. This information can be used to influence trade policies (i.e., to develop trade complaints).
To whom is this information important?
This information can be beneficial to the entire New Mexico and southwestern United States chile pepper industries (both producers and processors). Ninety percent of United States chile pepper harvested acreage is located in New Mexico, Arizona and Texas, with 60% located in New Mexico. (U.S. Department of Agriculture, National Agricultural Statistics Service, 2003). The southwestern chile pepper industry is directly affected by international trade trends and events. It is imperative that industry members be better informed about international trade in peppers and pepper products.
How do you read the import and export matrices?
The export and import matrices are set up differently. The export matrices (fig. 1) have exporting countries running along the top (horizontally), with importing countries running down the far left side (vertically). The far left column of importing countries is arranged alphabetically. The row of exporting countries is sorted by continent or general region. To find a quantity of a commodity exported to a specific country, locate the exporting country. Then find the importing country on the far left side of the matrix. Proceed to the right following that row until the row and the column meet. In that space will be the amount of product exported to the specified importing country.
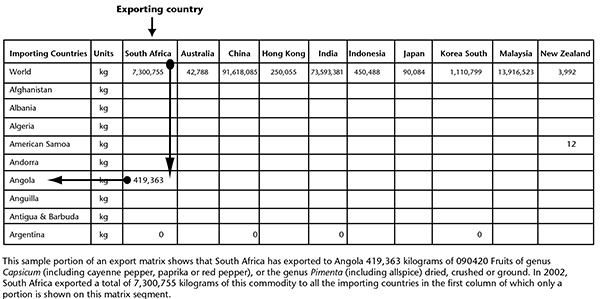
Figure 1. Exporting countries of commodity 090420 Fruits of the genus Capsicum, or the genus Pimenta dried, crushed or ground.
On import matrices (fig. 2), the importing countries run across the top (horizontally), while the exporting countries are listed in the left hand column. The column of exporting countries is arranged alphabetically. The row of importing countries is sorted by continent or general region. To find a specific quantity of a commodity imported by a specific country, first locate the importing country. Next, find the exporting country in the far left column of the matrix. Once both countries have been located, proceed inward and downward into the matrix until the two columns meet. At the intersection will be the quantity of product traded.
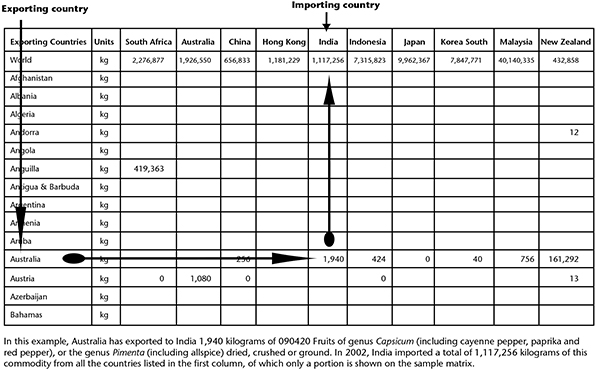
Figure 2. Importing countries of commmodity 090420 Fruits of the genus Capsicum or the genus Pimenta dried, crushed or ground. Importing country
What if I have questions about the data in these matrices?
If you have questions about this report, please contact the New Mexico Chile Task Force at (505) 646-2353.
References
Morris, L. and Skaggs, R. (2004). U.S. Imports and Exports of Chile Peppers and Pepper Products: Frequently Asked Questions. New Mexico Chile Task Force Report 15. Las Cruces: New Mexico State University. In press.
U.S. Department of Agriculture–National Agricultural Statistics Service. (2003). Vegetables–2002 Summary. Report #Vg 1-2(03).
Footnotes
1 This report was reviewed by Octavio Ramirez, department head, and James Libbin, professor, Department of Agricultural Economics and Agricultural Business; Rich Phillips, project manager, New Mexico Chile Task Force, all with New Mexico State University; and Dino Cervantes, general manager, Cervantes Enterprises Inc., Vado, N.M.
2 This publication was prepared with financial support from the New Mexico Chile Task Force and the New Mexico Agricultural Experiment Station. It was prepared by Leslee Morris, in partial fulfillment of requirements for the Master of Agriculture–Agribusiness degree, under the direction of Rhonda Skaggs.
Further reading links
CTF-1: An Industry-University Response to Global Competition
https://pubs.nmsu.edu/research/horticulture/CTF1/index.html
CTF-11: Developing New Marketing Strategies for the Southwestern Chile Industry
https://pubs.nmsu.edu/research/horticulture/CTF11/index.html
CTF-15: U.S. Imports and Exports of Chile Peppers and Pepper Products: Frequently Asked Questions
https://pubs.nmsu.edu/research/horticulture/CTF15/index.html
To find more resources for your business, home, or family, visit the College of Agricultural, Consumer and Environmental Sciences on the World Wide Web at aces.nmsu.edu/pubs
Contents of publications may be freely reproduced for educational purposes. All other rights reserved. For permission to use publications for other purposes, contact pubs@nmsu.edu or the authors listed on the publication.
New Mexico State University is an equal opportunity/affirmative action employer and educator. NMSU and the U.S. Department of Agriculture cooperating.
December 2004, Las Cruces, NM