The U.S. Dairy Industry and International Trade in Dairy Products
Technical Report 42
Ereney Hadjigeorgalis
College of Agricultural, Consumer and Environmental Sciences, New Mexico State University
Author: Assistant Professor, Department of Agricultural Economics and Agricultural Business, New Mexico State University (Print friendly PDF)
Introduction
The U.S. Dairy Industry produced over $20 billion in sales in 2002. New Mexico ranked seventh nationally in dairy products sales, contributing over $730 million to the state economy in 2002 (U.S. Census Bureau, 2004). The Dairy sector accounted for approximately 11% of national agricultural sales in 2002, and dairy is the top contributor to the New Mexican economy, accounting for 37% of agricultural cash receipts in 2003. The importance of this sector to New Mexico warrants the need for a comprehensive report of industry issues and challenges, both from a domestic production standpoint as well as an international trade perspective.
The Structure of U.S. Dairy Production
Location
Although milk is produced in all 50 states, the bulk of U.S. dairy production is heavily concentrated in only a few states. In 2004, five states accounted for 52% of milk production and 10 states accounted for 71% of milk produced. These states are, in order of importance, California, Wisconsin, New York, Pennsylvania, Idaho, Minnesota, New Mexico, Michigan, Texas and Washington. (NASS, 2004).
There are 10 dairy production regions in the United States.: Northeast, Lake States, Corn Belt, Northern Plains, Appalachian, Southeast, Delta States, Southern Plains, Mountain and Pacific (Table 1). The Northeast, Lake States and Corn Belt are generally known as the traditional dairy regions (Blayney, 2002). Idaho, New Mexico and Washington State, which are located in the Mountain and Pacific Regions, respectively, have displaced the traditional dairy states of Iowa, Ohio and Missouri in recent years. The importance of Western regions as major sources of milk supplies is now a significant feature of the U.S. dairy industry (Blayney, 2002).
The fastest-growing milk-producing states are Idaho and New Mexico (NASS, 2004). From 2000-2004, milk production increased 28% in New Mexico and 26% in Idaho. This increase is attributable to increases in both cow numbers and production per cow. Texas has also grown rapidly since 2002. Milk production there increased 13% from 2002 to 2004.
Most U.S. dairy cows are Holsteins, which generally are more productive than other breeds (USDA-b, 2002). In 2004, there was an average of 9 million milk cows in the United States, with an average annual production per cow of 18,957 pounds. Milk cow operations totaled 81,440, with an average number of cows per operations of just over 110 (NASS, 2004).
Table 1: U.S. Dairy Production Regions
| Region | States |
| Northeast | Maine, Vermont, New York, Pennsylvania, Maryland, Connecticut, New Hampshire, Delaware, Rhode Island, Massachusetts, New Jersey |
| Lake States | Michigan, Minnesota, Wisconsin |
| Corn Belt | Iowa, Missouri, Ohio, Illinois, Indiana |
| Northern Plains | North Dakota, South Dakota, Nebraska, Kansas |
| Appalachian | Virginia, West Virginia, Kentucky, Tennessee, North Carolina |
| Southeast |
Florida, South Carolina, Georgia, Alabama |
| Delta States | Mississippi, Louisiana, Arkansas |
| Southern Plains | Texas, Oklahoma |
| Mountain | Arizona, New Mexico, Colorado, Utah, Nevada, Wyoming, Idaho, Montana |
| Pacific | California, Washington, Oregon |
| Source: Blayney, 2002 | |
Farm Size
The U.S. dairy industry is dominated by small, family operations. Over 70% of dairy farms were family owned or family corporations in 2002 (Blayney, 2002). However, in recent years there has been an increase in the importance of large-scale dairy operations. In 2004, 77.7% of production came from operations of 100 cows or more, up from 52.2% in 1993. Approximately 43% of herd inventory corresponded to operations that had 500 or more cows. Although these large farms (greater than 100 cows) accounted for nearly half of the milk produced, they only represented 22% of all operations (NASS, 2004). Several of these dairies are multiple herd operations spread over wide geographical areas (Blayney, 2002).
Most dairy farmers belong to producer-owned cooperatives, which assemble members' milk and move it to processors and manufacturers (USDA b, 2002). Milk can be sold as fluid milk or cream, or it can be processed into an array of manufactured dairy products. Sales of fluid milk products typically represent only one-third of total milk supply (USDA-b, 2002). Half of the milk supply is used to produce cheese, of which cheddar is the most popular followed by mozzarella (USDA-b, 2002).
U.S. milk production has remained largely flat over 2002-04. There were large surplus stocks of nonfat dry milk in 2003. Food aid shipments, subsidized exports and internal issues are expected to reduce ending stocks by nearly a quarter, and production of nonfat dry milk is also forecast to fall for a second year in a row (USDA-FAS, 2003).
Dairy Production in New Mexico
New Mexico has been one of the fastest growing dairy states. It is ranked seventh in the nation for milk production and eighth for cheese production (Dairy producers of New Mexico). There are currently about 180 dairies in New Mexico, with the highest number in Chaves County. There were approximately 326,000 head of dairy cattle in 2004 (NASS, 2004), giving an average herd inventory of 1,811 milk cows per dairy. Large-scale dairies clearly dominate in the state. In 2004, 98% of herd inventory corresponded to operations with at least 500 head of dairy cows, while only 0.2% corresponded to operations with less than 100 head of dairy cows (NASS).
Milk cows in New Mexico produced an average amount of 20,583 pounds of milk per cow in 2004, which is above the national average (NASS). This is equivalent to approximately 2,573 gallons of milk. Approximately half of all milk produced is processed locally into cheese (Dairy Producers of New Mexico). One of the largest mozzarella cheese manufacturers worldwide, Leprino, is located near Roswell, New Mexico. Leprino alone processes approximately 4.5 million pounds of fluid milk per day. (NM agriculture).
U.S. Dairy Policy
The dairy industry in the United States, as in most countries, receives a significant amount of assistance from the federal government. The major programs in place to assist the dairy sector include federal Milk Marketing Orders, a price support program, direct payments to producers, and the Dairy Export Incentive Program (DEIP).
Federal Milk Marketing Orders were first established under the Agricultural Marketing Agreement Act of 1937 (USDA–c, 2002). They are intended to help establish orderly marketing conditions for the benefit of both producers and consumers and are based on a classified pricing system and revenue pooling (USDA-c, 2002). The first reform of these orders came with the 1996 Farm Act, which reduced the total number of orders from 33 to 11. It also established new methods for determining class prices and standardized the language between orders (USDA-c, 2002).
The dairy price support program was instituted under the Agricultural Act of 1949 (USDA-c, 2002). Under this program the Commodity Credit Corporation has agreed to purchase at current support prices any butter, cheddar cheese or nonfat dry milk that meets specifications (USDA-c, 2002). The price support program was originally slated to end at the end of 1999 but was twice extended through 2001. Under the 2002 Farm Act, the program has been extended a third time through 2007. Elimination of the dairy price support program is a necessary condition under the Uruguay Round agreement (USDA-c, 2002).
The Dairy Export Incentive Program (DEIP) has played an important part in the milk price support system since the 1990 Farm Act. The DEIP effectively pays a subsidy to dairy product exporters by paying them cash bonuses that allow them to purchase at higher U.S. prices and sell at lower international prices. These bonuses apply to exports of nonfat dry milk, butterfat and certain cheeses (USDA-c, 2002).
International Dairy Trade
Only 5% of the total cow's milk produced globally is traded on international markets (USDA-a, 2002). Dairy trade is primarily in butter, cheese and dry milk powders, with limited trade in fluid milk products, ice cream, yogurt and dry whey products.
Trade Agreements Governing Dairy Products
The Agreement on Agriculture of the Uruguay Round is the principal document governing multilateral trade liberalization in dairy products. For a short time, trade in dairy products was also regulated by the International Dairy Agreement, which entered into effect on January 1, 1980, after the Tokyo Round of Multilateral Trade Negotiations. Signatories to the International Dairy Agreement included Argentina, Bulgaria, Chad, the EC(15), Japan, New Zealand, Norway, Romania, Switzerland and Uruguay (World Trade Organization [WTO], 1997). The agreement was terminated in 1997 due to the establishment of the WTO Committees on Agriculture and Sanitary and Phytosanitary Measures, which made the International Dairy Agreement redundant (WTO, 1997).
Bilaterally, the most important trade agreements that have included dairy products have been the NAFTA agreement, the Closer Economic Relations (CER) Agreement between Australia and New Zealand, and the U.S. and Australia Free Trade Agreement.
Under the NAFTA agreement, all tariffs have been phased out for trade with Mexico. The Canadian portion of the NAFTA agreement excluded dairy products. The NAFTA agreement entered into force on January 1, 1994. Under the CER Agreement, all dairy trade was liberalized between Australia and New Zealand.
The U.S.–Australia Free Trade Agreement entered into force on January 1, 2005. Under this agreement, Australia guarantees duty-free tariff treatment for all U.S. dairy products. The U.S. agreed to eliminate all tariffs on dairy products that had previously been governed by tariff-rate quotas under the Uruguay Round. Australia also gains additional access to the U.S. market through the establishment of several duty free tariff-rate quotas on dairy products not previously imported from Australia. These new duty-free quotas will grow by 3 to 6 percent per year and all tariffs will be completely phased out over an 18-year period. The over-quota and safeguard duty rates on all dairy products, however, remain unchanged (USDA-FAS-b, 2004).
Trade Disputes and Contentious Issues
Under the Agreement of Agriculture of the Uruguay Round (UR) in 1994, member countries agreed to limit both the volume and value of subsidized exports, with varying restrictions placed on different countries. In 1998, the United States and New Zealand filed a formal dispute with the WTO that claimed that Canada was exceeding its export subsidy limits under the UR. The WTO ruled in favor of the United States and Canada in 1999. In an effort to comply with this directive, Canada eliminated its direct dairy export subsidies and replaced them with a new export program in each province. The Commercial Export Milk (CEM) program allowed Canadian processors to purchase lower-priced milk and use it to make cheese and other dairy products for export (USTR Press Release, 2002). The United States argued, and the WTO agreed, that the governmental provision of lower priced milk to processors for export constituted an illegal export subsidy. On April 30, 2003, Canada eliminated the CEM program, and as of August 1, 2003, Canada has eliminated all subsidized dairy exports to the United States, and limited such exports to other foreign markets (Agriview Online, 2003).
A second contentious issue on the trade front in dairy products was the 2003 introduction of a bill in the U.S. Congress, the Milk Import Tariff Equity Act, which included milk protein concentrates (MPC) and casein under the current dairy import quota structure. The bill was re-introduced in February of 2005 as HR 521, and is currently in the House Subcommittee on Trade. MPC and casein are not produced in the United States; they are imported chiefly for use in highly processed cheese products and specialized sports nutrition products. Use of MPC in other dairy products is restricted by the FDA. The controversy surrounding MPC imports is that they serve as a lower-cost substitute for nonfat dry milk in certain processed dairy products. Thus, MPCs displace nonfat dry milk, which must be later bought back by the government's Dairy Price Support Program.
U.S. Dairy Tariff Rate Quotas
Prior to the Uruguay Round Agreement, the United States operated a system of dairy import quotas. These have all been replaced by tariff rate quotas. While a quota limits the total amount of a product that may enter an importing country in a given year, a tariff rate quota establishes a two-tier tariff for imports. Imports below a pre-specified quota limit enter the country duty free or at a reduced tariff rate, while imports above this limit enter at a higher rate, which is generally prohibitive. See Table 2 for tariff-rate quotas for major categories of dairy products.
Table 2: Tariff-Rate Quota Limits and Tariff Rates
| Product | TRQ Limit |
Within Limit Tariff |
Out of Limit Tariff (US$/kg) |
| Fluid Milk, 1-6% Fat (liters) | 11,356,236 | 0.04 | 0.15 |
|
Fluid Milk and Cream 6-45% Fat |
6,694,840 | 0.032 | 0.772 |
| Fluid Milk and Cream and Sour Cream >45% Fat, Butter |
6,997,000 | 0.123 | 1.541 to 1.646 |
| Milk Powder <3% Fat | 5,261,000 | 0.033 | 0.865 |
| Milk Powder 3-35% Fat, Dried Sour Cream 6-35% Fat |
3,321,000 | 0.068 | 1.092 |
| Whole Milk Powder and Dried Buttermilk |
99,500 | 0.137 | 1.556 |
| Evaporated and Condensed Milk | 6,857,300 | 0.022 to 0.033 | 0.313 to 0.496 |
| Dried Buttermilk and Dried Whey | 296,000 | 0.033 | 0.876 |
| Dairy Spreads and AMF Butter Substitutes and Butter Oil |
6,080,500 | 0.154 | 1.996 |
| Fresh Cheeses | 48,327,859 | 10% | 1.509 |
| Blue Mold Cheese (Other than Stilton) |
29,891,001 | 10-20% | 2.269 |
| Cheddar Cheese | 13,506,306 | 10-16% | 1.227 |
| American Type Cheese | 3,772,556 | 10-20% | 1.055 |
| Edam and Gouda Cheese | 7,066,402 | 10-15% | 1.803 |
| Italian Type Cheese | 13,731,064 | 7.5-25% | 2.146 |
| Swiss, Emmantaler and Gruyere Cheese |
8,104,833 | 6.4-10% | 1.386 |
| Cheese with <0.5% fat and margarine cheese |
5,724,907 | 10% | 1.128 |
| Sources: Harmonized Tariff Schedule of the United States, 2004; U.S. Dairy Product Trade: Modeling Approaches and the Impact of New Formulations | |||
Production and Export Supply of Dairy Products
Major exporters of dairy products worldwide include the European Union (EU), New Zealand and Australia. Milk output in the EU is controlled by quotas and has remained relatively stable (USDA-FAS, 2003). This quota regime has been extended until 2014–15, following the EU's recent Mid-Term Review, which concluded in July 2003 (USDA-FAS, 2003). It is expected that surplus milk supplies in the EU will be used to supply growing cheese production with a consequent decrease in the EU's production of butter and nonfat dry milk (USDA-FAS, 2003).
EU exports of cheese and nonfat dry milk are subsidized; therefore, they are limited by the Uruguay Round Agreement. Currently the EU exports approximately 60% of its milk powder via export subsidy programs, and is limited to subsidized cheese exports of 321,300 tons. However, a growing portion of premium quality cheeses are exported without any aid (USDA-FAS, 2003).
While milk production in the EU has been stable, New Zealand milk production has been increasing. Most of New Zealand's production is controlled by Fronterra Dairies. Fronterra has been reducing inventory and tightening export supply in an attempt to lower their supply chain costs (USDA-FAS-d, 2004). New Zealand exports of butter are expected to decrease by 2.6% for the 2004-05 season to 381,000 tons. Cheese production is expected to increase 2% to 319,000 tons in 2004-05, but exports will remain unchanged from the previous year. Although milk powder production is expected to increase on the order of 4.7 to 4.9% in 2004-05, exports are forecasted to increase by less than 4%. New Zealand is expected to be the main beneficiary of the expanding world market for whole milk powder since the EU is constrained by the Uruguay Round limits on subsidized exports to 240,000 tons, and Australian production is still recovering from the 2002-03 drought (USDA-FAS-c, 2004).
For the 2004-05 season, Australian milk production is forecast to increase by only 1%, 6.4% below the pre-drought level attained in 2001-02 (USDA-FAS, 2003). Recent data indicate, however, that water conditions have improved for Australian dairy farmers, and two-thirds report that they have returned to pre-drought production levels. Heavy rainfall was reported in November 2004 in Victoria, where most of Australia's milk production is concentrated. Milk exports, however, are forecast to remain unchanged from 2004-05, as domestic consumption has increased by 1.5% (USDA-FAS-c, 2004). High world prices for nonfat dry milk benefited the United States in 2004. U.S. exports of nonfat dry milk powder increased by more than 77% in 2004, but at the cost of a reduction in stocks on the order of 43% to 250,000 tons. (USDA-FAS 2004). Whereas the support price for nonfat dry milk is fixed at $1,764/MT by the Commodity Credit Corporation, world prices have hovered around $2,150-$2,350/MT. Nonfat dry milk is currently being exported without any subsidies so it is not subjected to Uruguay Round limits on such exports.
Consumption and Import Demand
Import demand for cheese remains fairly strong in key markets such as Japan and Russia. In Russia, in particular, cheese imports have expanded considerably, doubling in volume from 2002-04. Given that Russian milk production has been declining while disposable income has been growing, cheese imports demand will most likely continue to rise (USDA-FAS-f, 2004). Russia is also one of the top butter import markets of the world (USDA-FAS, 2003).
For 2004, import demand for milk powders increased in Algeria, where 47% of domestic milk consumption is reconstituted milk (USDA-FAS-g, 2004). Algeria has inadequate domestic milk production and depends on imports to meet demands. Algerian imports of dairy products account for approximately 22% of total agricultural product imports (USDA-FAS-g, 2004).
China is an emerging market for milk powder that is expanding rapidly. Chinese imports of whole-milk powder are expected to increase by 24% in 2005 to reach 113,000 tons. The increased demand is attributed to demand from higher income groups and decreased confidence in the safety of domestic milk supplies after 12 cases of infant death were reported due to contaminated milk powder (USDA-FAS-e, 2004).
World Dairy Product Prices
Dairy prices for major dairy commodities have been climbing since mid-2002 due primarily to the weakening U.S. dollar, the Australian drought and a rebound of major economies (USDA-FAS, 2003). Reduced supplies, coupled with increasing incomes are likely to stimulate import demand and keep prices relatively strong in 2005.
U.S. Export and Import Markets for Dairy Products
Since 2002, the United States has been a net importer of dairy products, primarily cheese. A substantial percentage of U.S. imports of dairy products originate in the EU, which accounted for 33% of all U.S. dairy product imports in 2004 (fig. 1). The EU is followed by New Zealand (19%), Canada (13%) and to a lesser degree China (6%) and Mexico (5%). U.S. imports from both New Zealand and Canada have increased dramatically since 1997. Imports in 2003 from the EU were approximately 40% higher than 1997 levels, and imports from New Zealand have increased by approximately 110% during the same time period. In 2004, imports from the EU increased 9.8%, thanks to its enlargement from 15 to 25 countries in May of 2004.
In 2004, U.S. dairy products were exported to nine main markets: Mexico, China, Canada, Japan, Philippines, Republic of Korea, Taiwan, Thailand, and Indonesia (fig. 2). The main export market for dairy products as an aggregate are the NAFTA countries–Canada and Mexico–which jointly accounted for 34% of all U.S. dairy product exports in 2004. Recently, China has also become an important export market for U.S dairy products, absorbing 9% of such exports in 2004. Exports to China have increased dramatically since 2001. Total quantity exported in 2004 to China was almost three times the quantity exported in 1999.
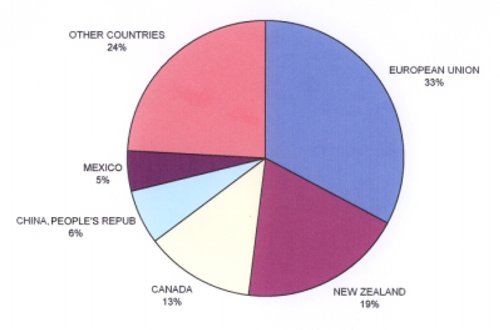
Figure 1: Import Shares of U.S. Dairy Imports (2004)
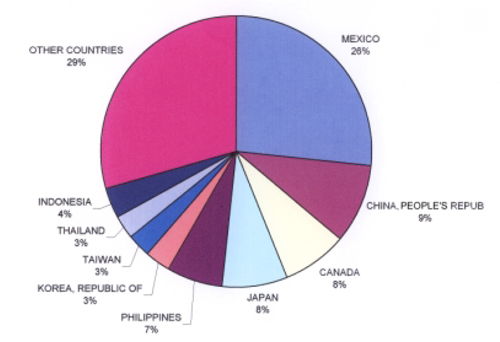
Figure 2: Export Shares for U.S. Dairy Export Markets (2004)
Fluid Milk and Cream
The principal export destination for U.S. fluid milk and cream in 2004 was Mexico, which absorbed almost 60% of all such exports (fig. 3). Canada was the second-largest export market, accounting for 33% of all U.S. exports of fluid milk and cream. Thus, the NAFTA countries jointly accounted for approximately 93% of all U.S. dairy exports of fluid milk and cream.
U.S. imports of fluid milk and cream in 2004 came principally from Canada (39%) and New Zealand (32%) (fig. 4). Mexico is a growing import source of fluid milk and cream for the United States. In 1995, Mexico accounted for a little over 1% of imports, whereas in 2004, this share had risen to 13%. The EU has also increased its share from less than 1% of all such imports in 1996 to approximately 11% in 2003.
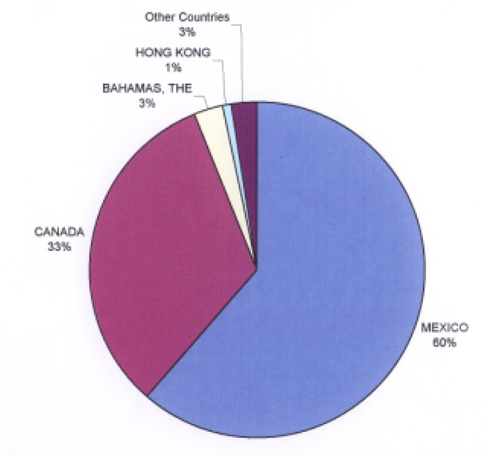
Figure 3: Principal Export Markets for Fluid Milk and Cream (2004)
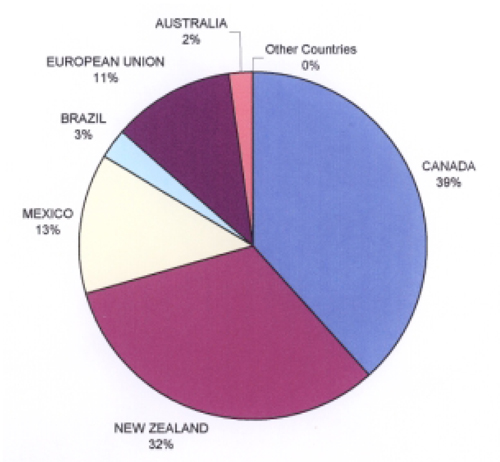
Figure 4: Principal Countries of Origin for U.S. Fluid Milk and Cream Imports (2004)
Butter
The United States is a net importer of butter. Total quantity imported in 2004 was 36,995 metric tons, and 6,108 metric tons were exported. The newly enlarged EU accounted for 35% of all butter imported in 2004 and was a close second, accounting for 33% of all butter imported in 2004. Other important import sources are Uruguay, Israel and Australia (fig. 5).
On the export side, the main export destinations of U.S. butter are the NAFTA countries of Canada and Mexico, which together absorbed 75% of all butter exports in 2004 (fig. 6). Mexico was the principal export destination for U.S. butter from 1994 through 2000, except 1996, when the United Arab Emirates imported an unusually large amount of U.S. butter. Since 2001, however, exports to Mexico have been lower than those to Saudi Arabia, in 2001 and 2002, and to Canada in 2003 and 2004. The NAFTA countries were followed in importance by Kuwait and the United Arab Emirates. Imports of butter over the 10-year period from 1995 to 2004 have been cyclical, with inordinately large increases from the major import sources in both 1998 and 2002. Imports of butter from all sources, however, increased substantially from 2003 to 2004, with imports from the EU and New Zealand increasing two-fold and almost ten-fold.
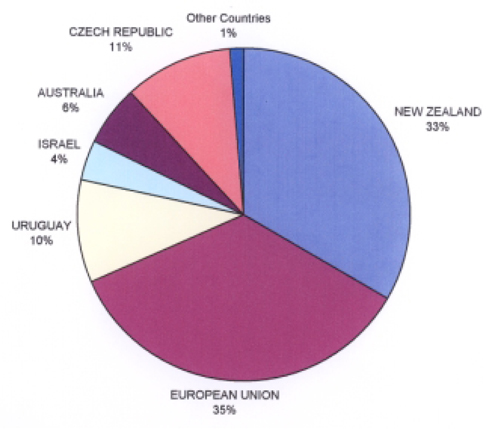
Figure 5: Principal Countries of Origin of U.S. Butter Imports (2004)
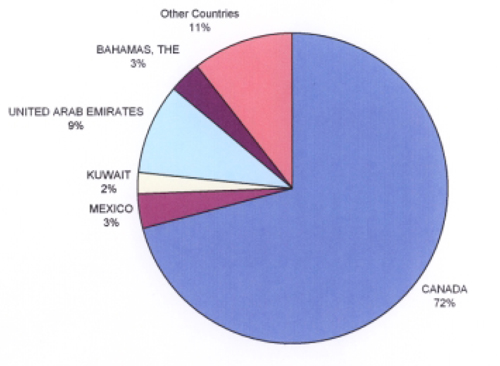
Figure 6: Principal Export Markets for U.S. Butter (2004)
Nonfat Dry Milk
The United States is a net exporter of nonfat dry milk products. While exports of other dairy products have remained fairly stable since 1996, exports of nonfat dry milk have increased substantially from a low of 21,598 metric tons in 1996 to 254,002 metric tons in 2004. The principal export market for
U.S. nonfat dry milk is Mexico, which in 2004 received 36% of these exports (fig. 7). Other markets are of limited importance, with the Philippines following Mexico at 9% of U.S. exports. Although Mexico remains the principal export destination for U.S. nonfat dry milk, exports to this country have exhibited cyclical behavior since 1999. Exports to other major markets have remained stable over the last decade.
The United States imported 8,065 metric tons of nonfat dry milk in 2004. The major import sources for the U.S. of nonfat dry milk are, in order of importance, New Zealand and Mexico, which together accounted for 78% of nonfat dry milk imports in 2004 (fig. 8). In general, imports of nonfat dry milk over the past 10 years have been increasing for the major import sources. Imports from New Zealand have increased 1,912% since 1994. Those from Mexico have increased 911% during the same time period. In 2002, Chile began exporting nonfat dry milk to the United States for the first time in small quantities.
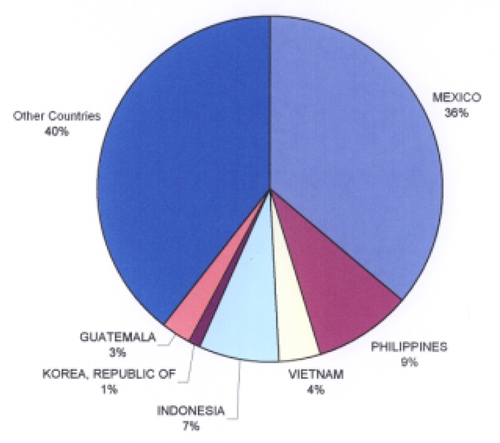
Figure 7: Principal Export Markets for U.S. Nonfat Dry Milk (2004)
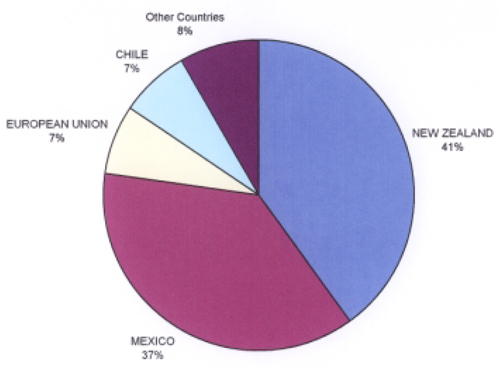
Figure 8: Principal Countries of Origin for U.S. NFDM Imports (2004)
Cheese
The United States is a net importer of cheese from a diversified group of countries. In 2003, the largest single source of U.S. cheese imports was the European Union, which accounted for 60% of all imports (fig. 9). Imports from the EU have remained fairly stable over the past decade while imports from New Zealand have followed a rising trend.
Mexico is the principal destination for U.S. cheese exports, accounting for 35% of such exports in 2004 (fig. 10). The NAFTA countries together accounted for 44% of all U.S. cheese exports in 2004. Japan was also an important cheese export market, absorbing 15% of U.S. exports in 2004. Exports to Japan have leveled off in the past few years, however, as shipments to Mexico rise substantially. In 1999, Mexico accounted for 13% of U.S. exports of cheese and imported 5,090 metric tons. In 2004, it imported 21,353 metric tons, more than three times the 1999 level.
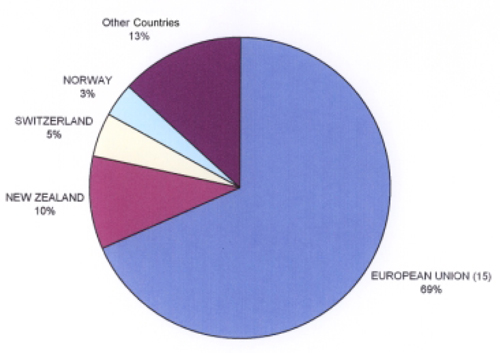
Figure 9: Principal Countries of Origin for U.S. Cheese Imports (2004)
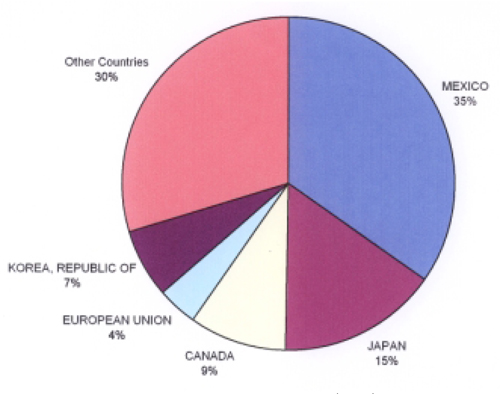
Figure 10: Principal Export Markets for U.S. Cheese (2004)
Yogurt
The United States is a net importer of yogurt. In 2004, more than 4,388 metric tons of yogurt were imported, and 3,980 metric tons were exported. Seventy-five percent of imports came from the EU. The EU was followed in importance by Canada, which accounted for only 6% of U.S. yogurt imports in 2004 (fig. 11). Imports from the EU skyrocketed after 1999. Imports of yogurt from the European Union in 2003 were 3,154% of those in 1999. Of the major import sources for yogurt, only Mexico has leveled off in the amount of yogurt that it exported to the United States in the 2001-04 period.
In 2004, the NAFTA countries absorbed 62% of U.S. yogurt exports, followed by Australia, which accounted for only 4% of U.S. exports of yogurt (fig. 12). Over the past decade, yogurt exports to the major markets have been stable, after dropping off precipitously to Mexico during the 1994-96 period.
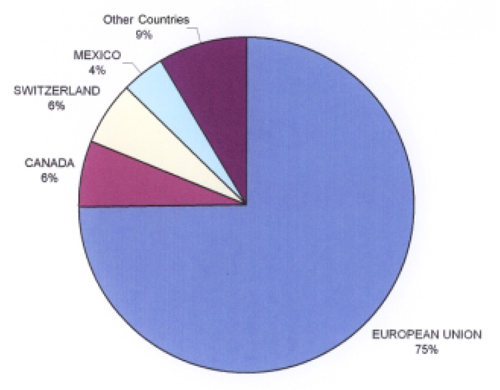
Figure 11: Principal Countries of Origin for U.S. Imports of Yogurt (2004)
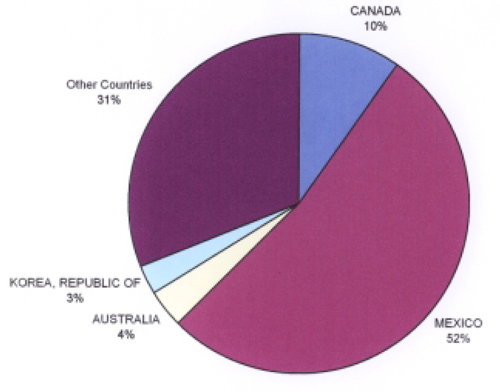
Figure 12: Principal Export Markets for U.S. Yogurt (2004)
Ice Cream
The United States is a net exporter of ice cream, with most exports going to the NAFTA countries and the EU. In 2004, 23,831 metric tons of ice cream were exported and slightly more than 18,613 metric tons were imported (figs. 13 and 14). Canada accounted for 80% of all ice cream imports in 2004 and has consistently increased its ice cream exports to the United States since 1997. On the export side, early in the past decade Japan was an important export destination for U.S. ice cream.
However, its importance has diminished just as Mexico has increased its imports of U.S. ice cream.
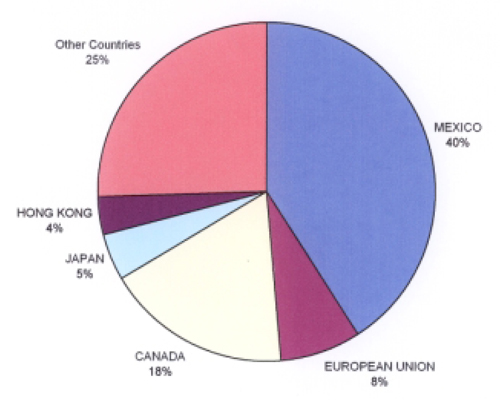
Figure 13: Principal Export Markets for U.S. Ice Cream (2004)
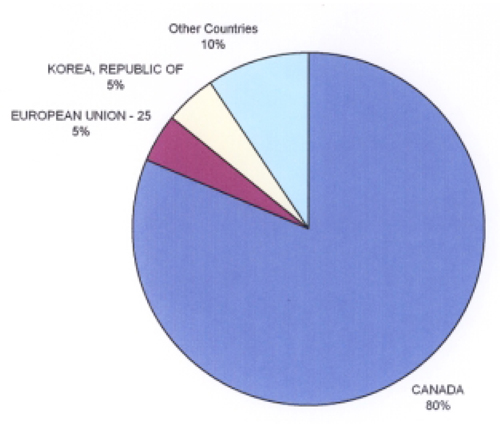
Figure 14: Principal Countries of Origin for U.S. Imports of Ice Cream (2004)
Conclusion
This report has provided a comprehensive description of the current state of the U.S. dairy industry and the major players involved in international trade in dairy products. It is a valuable compendium and summary of information for researchers, extension agents, industry and policymakers.
The dairy sector remains highly protected and regulated by the U.S. government. Liberalization has been slow in this sector but is proceeding at a steady pace as exemplified by advances in tariff reduction and quota elimination in the NAFTA and U.S–Australia Free Trade Agreements. Although some trade disputes have been resolved, notably with Canada, other issues, such as inclusion of milk protein concentrates and casein in the current dairy product quota system, are on-going. Domestically, the trend has been toward a concentration of dairy production among larger establishments and a reduction in the total number of dairy operations nationwide. This trend has been uneven, however; some states, particularly New Mexico and Idaho have witnessed rapid growth in dairy production in recent years. In the future, we can expect these trends in domestic production to continue, as the international arena of dairy trade becomes more important.
Works Cited
Agriview Online, 2003, "United States and Canada Reach Agreement Ending Illegally Subsidized Canadian Dairy Exports to the U.S.," May 16, 2003, Vol. 67, No. 10, http://www.vermontagriculture.com/Agriview%20Online/Agriview051503/agriviewonline2.htm
Blayney, Don P. The Changing Landscape of U.S. Milk Production ERS, USDA, Statistical Bulletin No. 978, (June 2002).
Blayney, Don P. and James J. Miller, ERS, USDA, International Dairy Markets and the WTO.
Dairy Producers of New Mexico, Frequently Asked Questions About New Mexico Dairies, Retrieved July 19, 2004, http://www.nmdairy.org/faq.htm.
Harmonized Tariff Schedule of the United States, 2004.
National Agricultural Statistics Service (NASS),USDA, 2004
Nicholson, C.F. and P. M. Bishop, "U.S. Dairy Product Trade: Modeling Approaches and the Impact of New Product Formulations" Final Report for NRI Grant #2001-35400-10249, March 2004.
U.S. Census Bureau, Statistical Abstract of the United States, 2004. USDA, Foreign Agricultural Service, (FAS), Market and Trade Data, 2004.
USDA, Foreign Agricultural Service (FAS)-a, Dairy: World Markets and Trade, Circular Series No. FD 2-03 (2003).
USDA, FAS-c, "Australia Dairy and Products Annual 2004," GAIN Report No. AS4039, http://www.fas.usda.gov/gainfiles/200412/146118216.pdf.
USDA, FAS-d, "New Zealand Dairy and Products Annual 2004," GAIN Report No. NZ4019. http://www.fas.usda.gov/gainfiles/200410/146117882.pdf.
USDA, FAS-e, "China, People's Republic of Dairy and Products Annual 2004," GAIN Report No. CH4050. http://www.fas.usda.gov/gainfiles/200410/146117830.pdf.
USDA, FAS-f, "Russian Federation Dairy and Products Annual 2004," GAIN Report No. RS4061. http://www.fas.usda.gov/gainfiles/200411/146118005.pdf.
USDA, FAS-g, "Algeria Dairy and Products Annual 2004," GAIN Report No. AG4005. http://www.fas.usda.gov/gainfiles/200412/146118306.pdf.
USDA-a, ERS. ERS USDA Briefing Room-Dairy Trade. 08/30 2002. <http://www.ers.usda.gov/Briefing/Dairy/Trade.htm>.
USDA-b, ERS. ERS USDA Briefing Room –Dairy: Background. 7/25 2002 <http://www.ers.usda.gov/Briefing/Dairy/Background.htm>.
USDA-c, ERS. ERS USDA Briefing Room – Dairy: Policy. 25/7 2002 <http://www.ers.usda.gov/Briefing/Dairy/Policy.htm>.
WTO. Signatories Terminate WTO Plurilateral Agreements on Meat and Dairy Products. WTO / News - Agreements on Meat and Dairy Products - PRESS/78. 30 September 1997. 10/5/04 <http://www.wto.org/english/news_e/pres97_e/pr78_e.htm>.
Acknowledgements
The author thanks Dustin Vendreley, for excellent research assistance, Sylvia Evans and Sylvia Beuhler for editorial assistance and Hillary Sullivan, Jim Libbin and Octavio Ramirez for helpful comments on a previous draft. All remaining errors and omissions are the sole responsibility of the author. This research was financed through support from the New Mexico Agricultural Experiment Station.
To find more resources for your business, home, or family, visit the College of Agricultural, Consumer and Environmental Sciences on the World Wide Web at aces.nmsu.edu
Contents of publications may be freely reproduced for educational purposes. All other rights reserved. For permission to use publications for other purposes, contact pubs@nmsu.edu or the authors listed on the publication.
New Mexico State University is an equal opportunity/affirmative action employer and educator. NMSU and the U.S. Department of Agriculture cooperating.
September 2005