RITF-86
Douglas S. Cram, Robert Sabie, Jr., Samuel T. Smallidge, and Nicholas K. Ashcroft
Authors: Respectively, Extension Forestry and Fire Specialist, Department of Extension Animal Sciences and Natural Resources, New Mexico State University (NMSU); Geographic Information System Analyst, New Mexico Water Resources Research Institute; Extension Wildlife Specialist, Department of Extension Animal Sciences and Natural Resources, NMSU; and Policy Analyst, Linebery Policy Center for Natural Resource Management. (Print Friendly PDF)
Abstract
The community of La Jara, New Mexico, relies on perennial surface water from the La Jara Watershed for drinking and irrigation. This is significant because the community’s drinking water treatment infrastructure is located just one half-mile from the base of this watershed in the direct path of a potential debris flow. The high-elevation, mixed-conifer watershed is located almost entirely within the San Pedro Parks Wilderness. Given recent wildfire trends in the adjacent Jemez Mountains as well as the Southwest in general, water users in the community are concerned about the potential for a high-severity wildfire burning through the watershed and the subsequent damage from postfire debris flows, floods, and sedimentation. This potential scenario would leave the community without drinking or irrigation water for an unknown period of time. This case study presents the probability, volume, and combined hazard of potential debris flows following wildfire in the La Jara Watershed. Debris-flow estimates were generated using empirical models derived by the United States Geological Survey (USGS) using data from actual burned basins throughout the intermountain west. Model inputs included topographic features, soil characteristics, modeled burn severity, and precipitation from potential rainfall events. Analysis results indicated increased probabilities, volumes, and combined hazards for predicted debris flows across the entire watershed given increasing rainfall intensities (i.e., 10- and 25-year events). In the scenario of a 2-year rainfall event, the analysis revealed that the lowest reaches of La Jara Creek (i.e., basin 1 in this analysis) are highly susceptible to the damaging effects of a debris flow. Given this potential hazard and the infrastructure at risk, the concerns expressed by the La Jara community are consistent with a high probability of debris-flow damage. A growing body of scientific literature indicates fuel reduction treatments, such as thinning followed by prescribed fire and so-called “fire use for resource benefit,” can reduce subsequent fire severity, thereby reducing the potential for damaging postfire debris flows.
Introduction
La Jara Creek drains the La Jara Watershed (Figure 1) and is the primary source of drinking and irrigation water for the community of La Jara, NM (population 209; 2000 U.S. Census). Two treatment facilities filter water from the creek before delivering it to homes in the local community as drinking water. For irrigation, water is diverted from the creek and transported to agricultural areas through a network of acequias (i.e., dirt and concrete ditches). The watershed, characterized as mixed conifer and ponderosa pine forests, is contained entirely within the Santa Fe National Forest, with two-thirds of the watershed located within the San Pedro Parks Wilderness. The practice of fire suppression and the lack of forest management treatments due to wilderness status have led to stockpiled fuel loads in the watershed over the last 75 years. Given increased fuel loads and recent wildfire trends toward larger fires with greater areas of high severity (Westerling et al., 2006), the potential for moderate- and high-severity fire has increased in this watershed. See Figure 2 for an illustration of recent wildfires in the Jemez Mountains. The probability of a debris flow, a particularly hazardous and destructive erosional event characterized by a moving mass of soil, rock, and water that travels downslope under the influence of gravity, is increased following moderate- to high-severity wildfire compared to pre-fire conditions. Such an event has the potential to damage or destroy the La Jara drinking and irrigation water infrastructure, the replacement of which would likely be very expensive given costs and extant regulatory criteria. Sedimentation events following rainfall would further challenge maintenance of both water delivery systems for years to come. Predicting the probability and volume of a debris flow in a spatially explicit manner allows end users and other affected parties to plan, prepare, and mitigate hazards based on quantitative data before a fire occurs. Examples of predictive debris-flow modeling in New Mexico before wildfire include Tillery et al. (2014) and Tillery and Haas (2016), while postfire examples include Tillery et al. (2011a, 2011b).
The request for the hazard analysis came from La Jara community members concerned about wildfire and subsequent debris flows, floods, and erosion. The Range Improvement Task Force (RITF) and the New Mexico Water Resources Research Institute (NMWRRI) teamed up to estimate the probability and volume of potential debris flows given moderate and high fire severity and three different precipitation events (i.e., 2-, 10-, and 25-year rainfall events) in the La Jara Creek Watershed. Using the geospatial analysis expertise of NMWRRI, we ran empirical models based upon historical debris-flow occurrence and magnitude data in the western United States (Cannon et al., 2010), terrain and soils information, as well as rainfall and burn severity data to estimate outputs.
Study Area
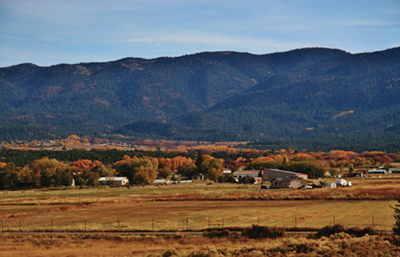
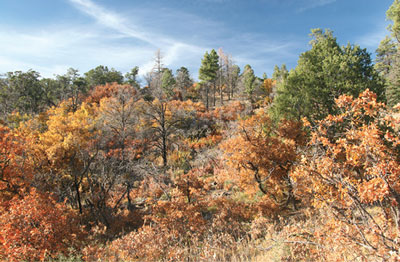
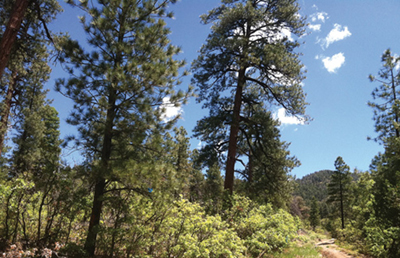
The La Jara Creek Watershed (centered at approximately 36°07’39” N, 106°51’58” W) encompasses 3,300 acres and is located 7.5 miles northeast of Cuba, NM, in the San Pedro Mountains at the northern end of the Nacimiento Mountains (Figure 1). Two perennial creeks drain the watershed: La Jara and Madera Creeks. No flow data (e.g., cubic feet per second) are available for either creek. The upper portion of the watershed is located within the San Pedro Parks Wilderness on the Cuba Ranger District, Santa Fe National Forest. Only a small fraction (approximately 400 acres) of the lower portion of the watershed is located outside of the wilderness area on national forest land. The west-facing escarpment rises precipitously 3,368 feet from the foothills to the top of the watershed (10,500 feet). This topography creates orographic lifting in the watershed. Annual precipitation ranges from 16 inches at the bottom to 32 inches at the top of the watershed (USDA–NRCS New Mexico Annual Precipitation Map 1998; Figure 3). Most precipitation occurs in summer (July and August) as rain and winter as snow. During the summer months, precipitation in the form of high-intensity, short-duration afternoon thundershowers is common (i.e., 1.65 inches/hour) (National Oceanic and Atmospheric Administration’s Precipitation-Frequency Atlas of the Western United States; Bonnin et al., 2011). A dry and windy spring season dries out forest fuels. The dominant cover type in the upper watershed is mixed conifer composed of Douglas-fir ( Pseudotsuga menziesii), white fir (Abies concolor), ponderosa pine ( Pinus ponderosa), and Engelmann spruce ( Picea engelmannii) (Figure 4). The lower elevations (i.e., <8,500 feet) of the watershed are characterized by a forested cover of ponderosa pine, piñon pine ( Pinus edulis), juniper ( Juniperus spp.), and oak ( Quercus spp.) (Figure 4).
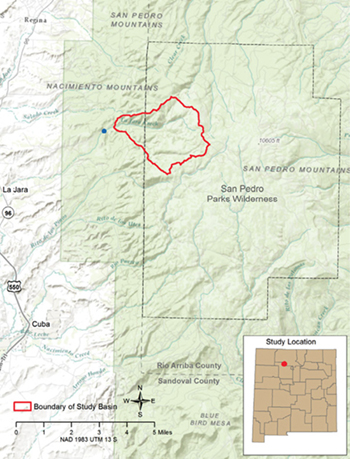
Figure 1. Map of the La Jara Watershed boundary (outlined in red) as used in debris-flow analysis. Black dashed line is the boundary of the San Pedro Parks Wilderness; green area is the Cuba Ranger District, Santa Fe National Forest; and blue circle is the water treatment facility. The community of La Jara can be seen on the far left.
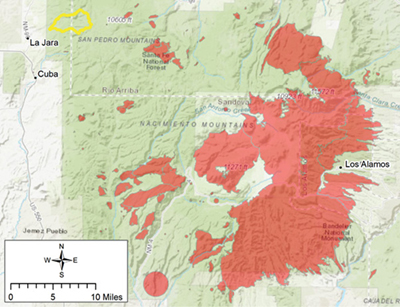
Figure 2. Wildfires (red areas) in the Jemez Mountains, NM, between 1970 and 2015. La Jara Watershed area is outlined in yellow.
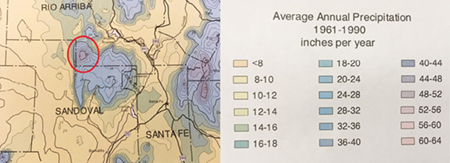
Figure 3. New Mexico annual precipitation map showing effects of orographic lifting over the San Pedro Mountains (outlined in red). Annual precipitation in the La Jara Watershed between 1961 and 1990 ranged from 16 inches at the bottom to 32 inches at the top of the watershed. (USDA–NRCS New Mexico Annual Precipitation Map 1998)
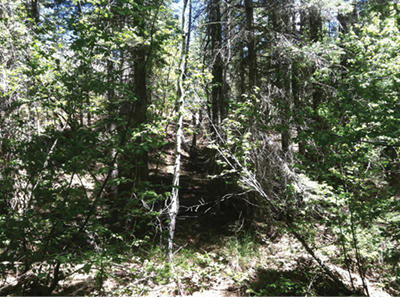
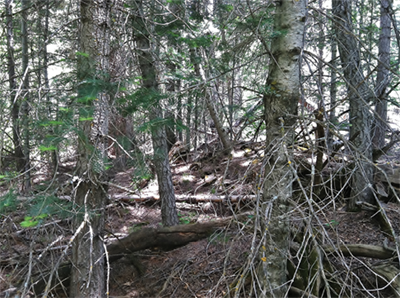
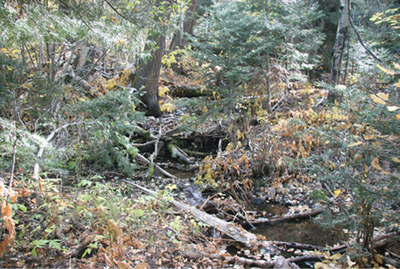
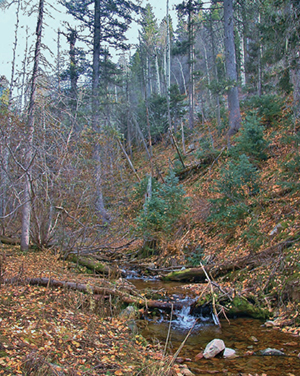
Figures 4e and f. Photographs of the La Jara Watershed. These two photographs show La Jara Creek. (Photos by D. Cram.)
Methods
To quantify the hazard associated with potential debris flows in the La Jara Watershed, two empirical models (sets of equations) were used to estimate probability, volume, and combined relative hazard. These models were developed by Cannon et al. (2010) and designed so that managers could quickly implement them in a geographic information system (GIS) before or after a wildfire. The empirical models were developed for the intermountain western United States and based upon historical debris-flow occurrence and magnitude, rainfall event conditions, terrain and soils information, and burn severity data (Gartner et al., 2008; Cannon et al., 2010).
Probability Model
Probability estimates are based upon logistic regression models derived from region-specific databases. This model was designed to predict the probability of debris-flow occurrence at a point along the drainage network in response to a given rainfall event by combining the following two equations:
(1) P = e x / (1 + e x),
where:
- P is the probability of debris-flow occurrence in fractional form and
- e x is the exponential function where e represents the mathematical constant 2.718.
For recently burned areas in the intermountain western United States, equation 2 is used to calculate x:
(2) x = −0.7 + 0.03(%A) − 1.6(R) + 0.06(%B) + 0.07(I) + 0.2(C) − 0.4(L)
where:
- %A is the percentage of the drainage basin area with slope equal to or greater than 30% (using 10-m digital elevation models) (Gesch et al., 2002);
- R is drainage basin ruggedness, the change in drainage basin elevation (in meters) divided by the square root of the drainage basin area (in square meters) (Melton, 1965);
- %B is the percentage of drainage basin area burned at moderate and high severity;
- I is average rainfall intensity (total rainfall divided by event duration, in millimeters per hour) (Bonnin et al., 2011);
- C is the percentage of clay content of the soil (State Soil Geographic dataset [STATSGO]; Schwartz and Alexander, 1995); and
- L is the liquid limit of the soil (the percentage of soil moisture by weight at which soil begins to behave as a liquid) (STATSGO; Schwartz and Alexander, 1995).
Probabilities predicted by the equation ranged from 0% (least likely) to 100% (most likely). Predicted probabilities were assigned to one of five equal (20%) interval classes for cartographic display.
Volume Model
Debris-flow volumes, both at the basin outlet and along the drainage network, were predicted using multiple linear regression models for region-specific databases. The multiple linear regression models were used to estimate the volume ( V, in m 3) of material that could issue from a point along the drainage network in response to a rainfall event of a given intensity. Volume estimates were classified in order of magnitude scale ranges of 0–1,000 m 3), 1,000–10,000 m3, 10,000–100,000 m3, and greater than 100,000 m 3) for cartographic display.
For recently burned areas in the intermountain western United States, debris-flow volume is calculated with equation 3:
(3) ln(V) = 7.2 + 0.6(ln A) + 0.7(B) 1/2 + 0.2 (T) 1/2 + 0.3
where:
- V is the debris-flow volume, including water, sediment, and debris (in cubic meters);
- A is the area (in km 2) of the drainage basin with slopes equal to or greater than 30% (using 10-m digital elevation models) (Gesch et al., 2002);
- B is the drainage basin area (in km 2) burned at moderate and high severity;
- T is the total rainfall (in mm); and
- 0.3 is a bias-correction factor that changes the predicted estimate from a median to a mean value (Helsel and Hirsch, 2002; Cannon et al., 2010).
Combined Hazard
As described by Cannon et al. (2010), debris-flow hazards for a given basin can be considered as the combination of both probability and volume. For example, in a given setting, the most hazardous basins will have both a high probability of occurrence and a large estimated volume of material. Slightly less hazardous would be basins that have a combination of either relatively low probabilities and larger volume estimates or high probabilities and smaller volume estimates. The lowest relative hazard would be for basins that have both low probabilities and the smallest estimated volumes (Cannon et al., 2010).
To calculate hazard, we followed the methods of Cannon et al. (2010). Specifically, a rank of 1 to 5 (with 5 being the highest) was assigned to each of the five probability classes, and a rank of 1 to 4 was assigned to each of the four volume classes. The ranks of the probability and volume classes were then added together to produce a map of the combined relative hazard ranking for each basin (with 9 being the highest combined hazard).
Model Application
Debris-flow hazard assessments rely upon empirical models to estimate the probability and volume of debris flows for selected watershed basins given an estimated burn severity in response to a design rainfall event. A “design rainfall event” is a potential rainfall event based on precipitation frequency estimates for the area in question (Bonnin et al., 2011). For example, a 10-year recurrence interval rainfall event is expected to have a 10% chance of happening in any given year. Postfire debris flows in the intermountain western United States are often triggered following short-duration, high-intensity thunderstorms (Cannon et al., 2010). Cannon et al. (2008) found most debris flows were triggered in response to rainfall events with short recurrence intervals (i.e., from 2 to 10 years). Further, Kean et al. (2011) demonstrated that periods of intense rain lasting less than 30 minutes were likely to generate postfire debris flows and were a strong driver in predicting postfire debris-flow probability. As such, we selected three design rainfall events to provide a range of potential intensities: 1) 2-year recurrence, 30-minute duration rainfall of 1.65 inches/hour (42 mm/hr) (21 mm accumulation), representing a 50% chance of occurring in any given year; 2) 10-year recurrence, 30-minute duration rainfall of 2.83 inches/hour (72 mm/hr) (36 mm accumulation), representing a 10% chance of occurring in any given year; and 3) 25-year recurrence, 30-minute duration rainfall of 3.42 inches/hour (87 mm/hr) (43 mm accumulation), representing a 4% chance of occurring in any given year. These design events were defined from data and methods detailed in the National Oceanic and Atmospheric Administration’s Precipitation-Frequency Atlas of the Western United States (Bonnin et al., 2011) (data location for rainfall intensity: 36°07’39” N, 106°51’58” W, 10,265 feet in elevation).
For the La Jara Watershed, postfire debris-flow probability, volume, and combined hazards were estimated at both the drainage basin scale and in an accumulative manner along the drainage network (i.e., segments) using a method that has been applied in recently burned areas (Verdin et al., 2012). We delineated four basins within the watershed using RiverTools 4.0 and a 10-meter digital elevation model. Basins 1, 2, 3, and 4 were 685, 930, 466, and 1,231 acres, respectively. We assigned basin outlets, also known as pour points, at the bottom of each basin. Soil physical properties were obtained from the USGS state soil geographic database (Schwartz and Alexander, 1995). In the La Jara Watershed, average clay content of soils was 28.5%. The average liquid limit was 30.0%.
Fire Behavior Modeling
Postfire debris-flow models rely upon a measure of burn severity. Burn severity refers to the amount of canopy and surface vegetation consumed by fire (Keeley, 2009). Specifically, the probability equation requires an estimate of percent basin burned at moderate and high severity, while the volume equation requires an estimate of area (e.g., acres) burned at moderate and high severity. Moderate burn severity across a stand of trees can be characterized as partial overstory canopy consumption (e.g., some combination of trees with crown needle scorching, while others have complete canopy consumption), whereas high burn severity is characterized by complete overstory canopy consumption (e.g., tree mortality and all needles consumed) (Keeley, 2009).
We estimated burn severity across the landscape using FlamMap, a fire-behavior model developed by Finney (2006). Because FlamMap incorporates spatial effects of wind, slope, fuel type, and moisture, the geographic distribution of crown fire potential (used here as a surrogate for fire severity) is considered to be more reliable and realistic as compared to earlier fire behavior software models. Fire and weather inputs necessary to run the model include 20-foot above-ground wind speed, wind direction, foliar moisture content, live herbaceous and live woody fuel moisture, as well as 1-, 10-, and 100-hour dead fuel moisture. Weather data inputs were obtained from the Coyote, NM, Remote Automated Weather Station operated by the Western Regional Climate Center, which was 13 miles east of the San Pedro Mountains but representative nonetheless of the area because of similar elevation, terrain, and vegetation. Mean weather and fuel moisture parameters were taken from June 2011 and can be considered to be representative of conditions observed during the 2011 Las Conchas Fire. We selected the Scott and Reinhardt (2001) method to calculate crown fire potential. Specific weather and fuel moisture inputs that were used in FlamMap are reported in Table 1. Specific fuel and topography information needed to run FlamMap was obtained from LANDFIRE (Ryan and Opperman, 2013). LANDFIRE is an interagency mapping program responsible for producing and maintaining a suite of geospatial layers representing topography, vegetation, and fuels across the U.S. LANDFIRE topographic layers included slope, aspect, and elevation; LANDFIRE fuels layers included canopy cover, stand height, canopy base height, canopy bulk density, and fuel loading (Ryan and Opperman, 2013).
|
Table 1. Values for FlamMap Input Variables* |
|
|
FlamMap Parameters |
Input Values |
|
20-foot wind speed |
21 mph |
|
Wind direction |
211 degrees |
|
1-hour fuel moisture |
5% |
|
10-hour fuel moisture |
7% |
|
100-hour fuel moisture |
8% |
|
Foliar moisture content |
90% |
|
Live herbaceous fuel moisture |
53% |
|
Live woody fuel moisture |
65% |
|
*Weather and fuel inputs taken from the Coyote, NM, Remote Automated Weather Station (Western Regional Climate Center) on June 26, 2011, represent fuel and weather conditions as observed during the first day of the Las Conchas Fire that burned over 44,000 acres in the first 13 hours. |
|
Limitations of the Model
The use of models for forecasting uncertain events necessarily comes with limitations and potential errors (Tillery and Haas, 2016). One such limitation includes the assumption that an entire watershed would receive equal precipitation in time and space within a single rainfall event. Rainfall amounts, particularly during high-intensity events that are common to the area, are variable in time and space even given the relatively small size of the basins. Modeling potential fire behavior also has limitations based on static fire weather and fuel input parameters (e.g., wind speed and direction, fuel moisture, etc.). Although we selected fire weather and fuel parameters to simulate extreme conditions, modeling uncertainty still exists given the dynamic nature of fire behavior. Maps provide interpretation for areas within the study area, but not beyond (i.e., downstream floodplains). The model is considered useful for conditions that persist on a burned landscape for one to several years after a fire (Tillery and Haas, 2016). Beyond that time period, resource conditions will vary depending on precipitation events and mitigation treatments, which are not accounted for in this model. This case study evaluates only postfire debris flows and does not consider other potential hazards and challenges such as flash floods or sedimentation, which may remain for many years after a fire. See Tillery and Haas (2016) and Tillery et al. (2014) for in-depth discussion on the limitations of these models.
Results
Burn Severity Simulation Results
Simulated fire activity in the watershed was a combination of surface and crown fire. FlamMap simulation results indicated passive and active crown fire activity in locations where forest structure supported crown fires, such as areas with greater tree density and crown bulk density (Cram et al., 2006). FlamMap predicted moderate and high fire severity for 71% of the watershed (Figure 5). This seems reasonable considering the steep slopes, fuel loading, and fuel moisture inputs used in FlamMap (Table 1). As a validation comparison, 60% of the Las Conchas Fire burned at moderate and high severity (when unburned and no information acres were removed).
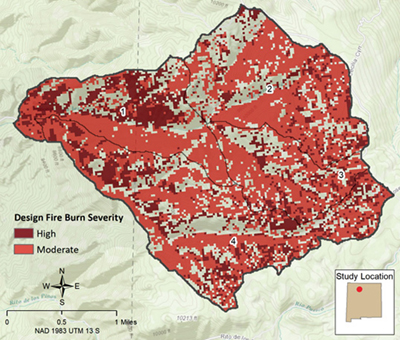
Figure 5. Moderate and high burn severity as predicted by FlamMap based on weather and fuel variable inputs (see Table 1 for input values).
Debris-Flow Probability Estimates (Basin and Segment)
The probability of debris-flow occurrence for each basin for 2-, 10-, and 25-year rainfall events is shown in Figures 6a–c. Basin 1 was estimated to have the greatest probability of debris flow at the lowest proportion of area burned at all three rainfall intensities (see insets on Figures 6a–c). Given a 2-year rainfall event, basins 2, 3, and 4 had lower probabilities of debris flows given the same percent area burned at high and moderate burn severity as basin 1. The inset charts show that for the 10- and 25-year rainfall events, basins 2, 3, and 4 had lower debris-flow probabilities given the same percent area burned at high and moderate severities as basin 1 up to 60% for the 10-year rainfall event and up to 80% for the 25-year rainfall event. Overall, as would be expected, increases in rainfall intensity and percent area burned lead to increases in probability for debris flows across all basins.
Streamline segment postfire debris-flow probabilities for 2-, 10-, and 25-year rainfall events are shown in Figures 7a–c. Given a 2-year rainfall event, the majority of the entire La Jara main channel was estimated to have a 60–80% chance of a debris flow, whereas the Madera Creek primary channel was predicted to have a 40–60% chance on the lower reaches but a 60–80% chance on the upper reaches. Segment probabilities for 10- and 25-year events were generally 80–100%.
Debris-Flow Volume Estimates
Basin debris-flow volumes for 2-, 10-, and 25-year rainfall events are shown in Figures 8a–c. Basin 4 was estimated to have the greatest debris-flow volume at all three rainfall intensities, in part because of the larger area of basin 4 compared to the other basins. Basin 3 appeared to have the greatest resilience to greater increasing volume given increasing rainfall intensities and area burned (see insets on Figures 8a–c).
Streamline segment volumes for 2-, 10- and 25-year rainfall events are shown in Figures 9a–c. The greatest predicted volume (i.e., >100,000 m 3) was the lowest reach of basin 1 given a 2-year event (as well as 10- and 25-year events). Above this location in basin 1, the predicted volume on the La Jara Creek was 10,000–100,000 m 3 given 2-, 10-, and 25-year events. Likewise, the lowest segment volumes in basin 4 were also predicted to be 10,000–100,000 m 3 for 2-, 10-, and 25-year events. These estimates were reduced (i.e., 1,000–10,000 m 3) for the highest elevations of the watershed for all three rainfall events.
Debris-Flow Hazard Estimates
Postfire debris-flow hazard was determined by combining debris-flow probability and volume estimates for each basin and stream segment. Predicted debris-flow volumes in this assessment were independent of estimated probabilities. As such, even if a basin had a high probability of producing a debris flow (i.e., the upper reaches of the watershed), the estimated volume of the debris flow must also be considered for evaluation of overall basin hazard. Basin hazard rankings are shown in Figures 10a–c. Given a 2-year rainfall event, basin 3 had a moderate debris-flow hazard rating. The remaining basins were ranked high for
2-, 10-, and 25-year rainfall events.
Streamline segment hazards for 2-, 10-, and 25-year rainfall events are shown in Figures 11a–c. The greatest segment hazard was the main channel of basin 1 given a 2-year rainfall event. Given a 10- and 25-year event, all the main channels of basins 1, 2, 3, and 4 were predicted to have high hazard rankings. Despite their high probabilities, the highest reaches of basins 2, 3, and 4 were rated only at moderate hazard because of their low predicted volumes.
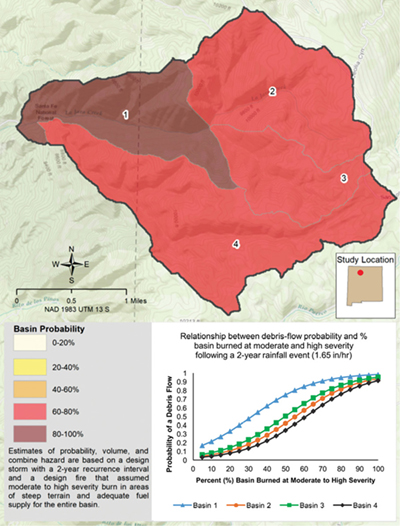
Figure 6a. La Jara Watershed basin postfire debris-flow probabilities for 2-year rainfall event (1.65 inches/hour).

Figure 6b. La Jara Watershed basin postfire debris-flow probabilities for 10-year rainfall event (2.83 inches/hour).
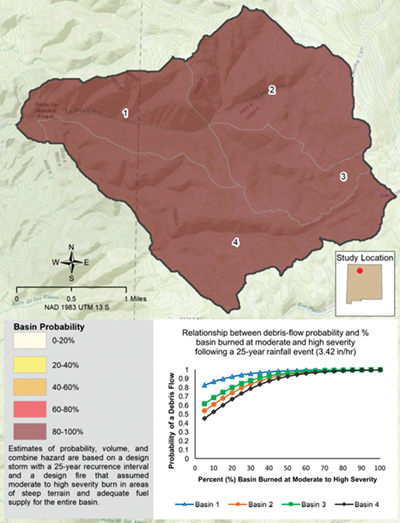
Figure 6c. La Jara Watershed basin postfire debris-flow probabilities for 25-year rainfall event (3.42 inches/hour).
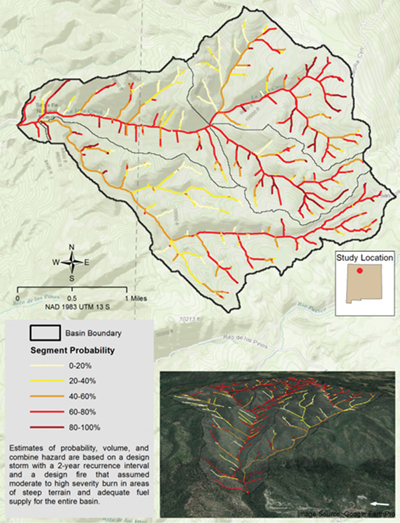
Figure 7a. La Jara Watershed postfire debris-flow segment probabilities for 2-year rainfall event (1.65 inches/hour).
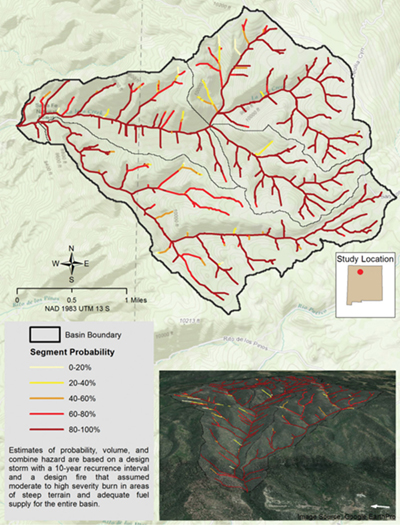
Figure 7b. La Jara Watershed postfire debris-flow segment probabilities for 10-year rainfall event (2.83 inches/hour).
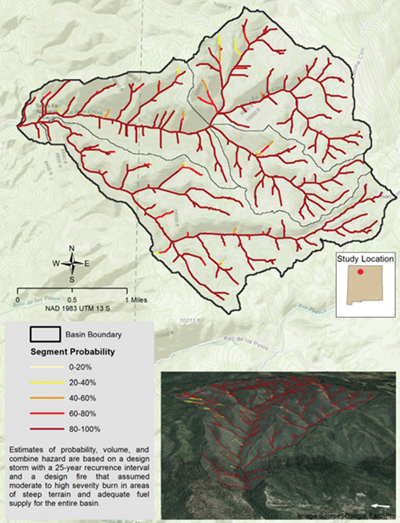
Figure 7c. La Jara Watershed postfire debris-flow segment probabilities for 25-year rainfall event (3.42 inches/hour).
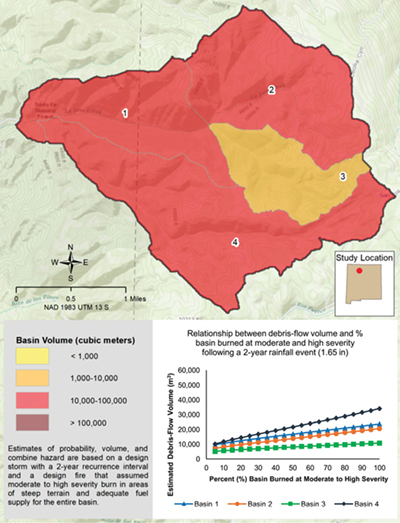
Figure 8a. La Jara Watershed basin postfire debris-flow volumes for 2-year rainfall event (1.65 inches/hour).
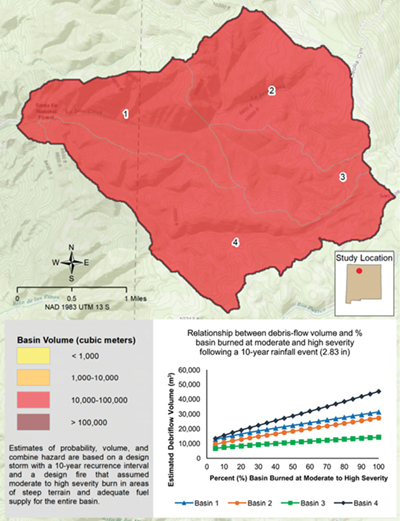
Figure 8b. La Jara Watershed basin postfire debris-flow volumes for 10-year rainfall event (2.83 inches/hour).

Figure 8c. La Jara Watershed basin postfire debris-flow volumes for 25-year rainfall event (3.42 inches/hour).
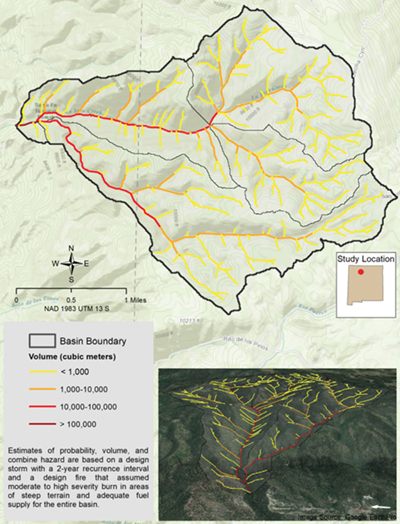
Figure 9a. La Jara Watershed postfire debris-flow segment volumes for 2-year rainfall event (1.65 inches/hour).
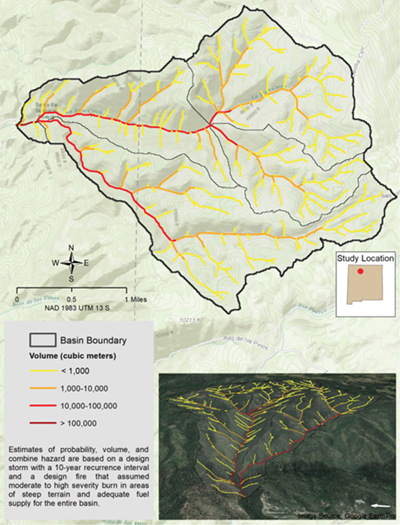
Figure 9b. La Jara Watershed postfire debris-flow segment volumes for 10-year rainfall event (2.83 inches/hour).
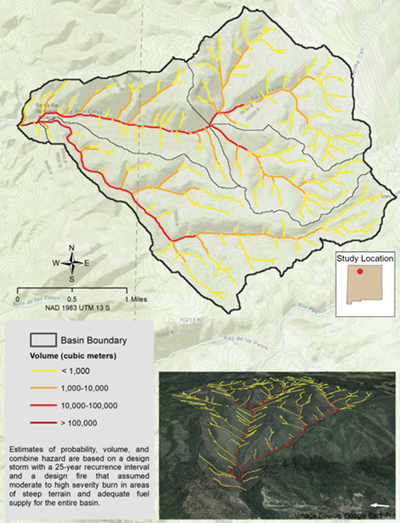
Figure 9c. La Jara Watershed postfire debris-flow segment volumes for 25-year rainfall event (3.42 inches/hour).
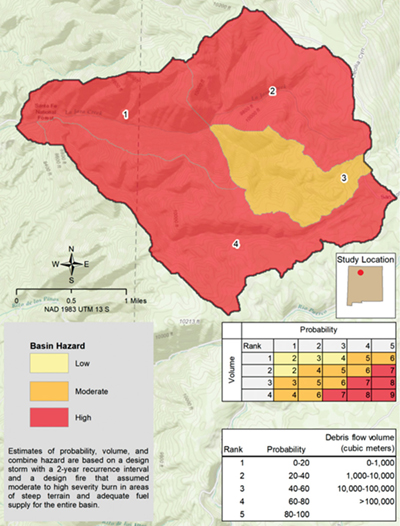
Figure 10a. La Jara Watershed postfire debris-flow basin hazard for 2-year rainfall event (1.65 inches/hour).
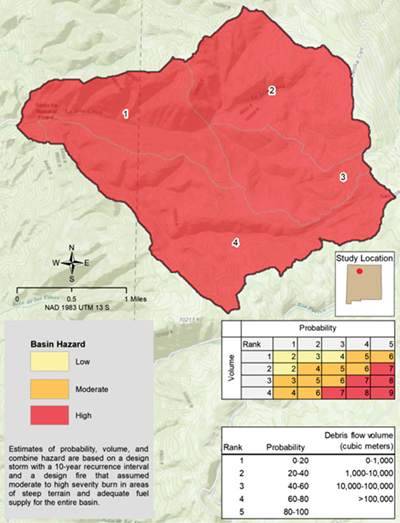
Figure 10b. La Jara Watershed postfire debris-flow basin hazard for 10-year rainfall event (2.83 inches/hour).

Figure 10c. La Jara Watershed postfire debris-flow basin hazard for 25-year rainfall event (3.42 inches/hour).
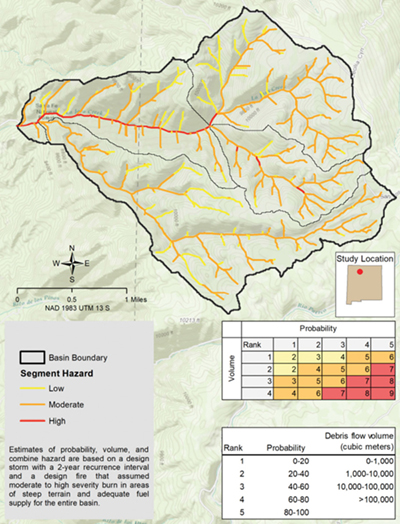
Figure 11a. La Jara Watershed postfire debris-flow segment hazard for 2-year rainfall event
(1.65 inches/hour).
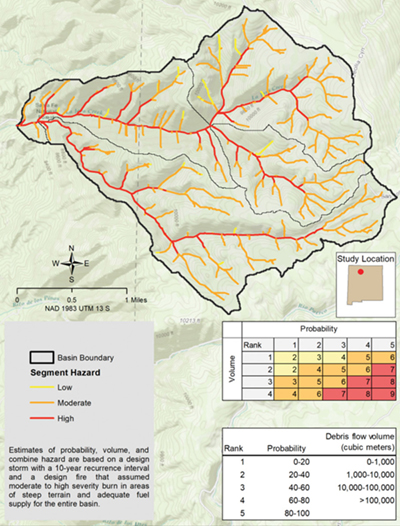
Figure 11b. La Jara Watershed postfire debris-flow segment hazard for 10-year rainfall event (2.83 inches/hour).
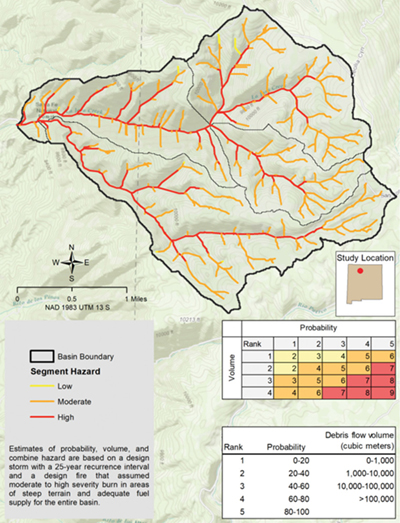
Figure 11c. La Jara Watershed postfire debris-flow segment hazard for 25-year rainfall event (3.42 inches/hour).
Discussion
Results from the combined hazard analysis (Figure 11a) indicated that a debris flow in the lowest reaches of basin 1 following wildfire would be ranked as a high hazard even under relatively frequent rainfall intensities (i.e., 2-year rainfall event). This is significant because the community drinking water treatment infrastructure is located just one half-mile from the base of this watershed in the direct path of a potential debris flow. Given this potential hazard and the infrastructure at risk, the concerns expressed by the La Jara community are consistent with a high probability of debris-flow damage. As would be expected given the 2-year rainfall event results, as rainfall intensifies (i.e., 10- and 25-year events), the segment hazard rating for all the primary segments in the watershed were rated high.
The basin and segment maps provide useful information for managers and stakeholders interested in identifying specific locations for mitigation efforts. Segment maps represent a continuous response from the top to the bottom of the watershed, whereas the basin maps show how an individual basin might respond. In particular, the segment maps provide detailed information on which stream segments present the greatest risk for debris flows.
Mitigation Options
Research literature continues to indicate forests in the Southwest were historically characterized by frequent surface fires (Liebmann et al., 2016). Mean fire return interval for forests in the Jemez Mountains before fire suppression and exclusion was 16.5 years (Liebmann et al., 2016). These frequent fires acted as a natural thinning agent by reducing litter buildup, burning small trees, and thinning ladder fuels. Fires tended to burn at low and moderate severities, resulting in reduced sediment yield following rainfall events as compared to high-severity fires (Benavides-Solorio and MacDonald, 2001). In the absence of frequent fire, high-severity crown fires have replaced low- to moderate-severity fire regimes in Southwestern pine-grassland stands, threatening not only those communities at the wildland-urban interface but also forest persistence in large areas throughout the West (Falk, 2017). Given forest adaptations to frequent fire, mitigation options include a management focus on restoration type treatments that aim to return stand structure and fuel loads to more historic conditions (Reynolds et al., 2013). Thinning and burning treatments have been shown to reduce subsequent fire behavior and severity (Cram et al., 2006; Martinson and Omi, 2013).
The greatest risk to the La Jara Watershed, given current fuel loads, is a fire starting at lower elevations (e.g., foothills/ponderosa pine forest type) and moving east, up in elevation throughout the watershed. In this scenario (most likely to occur in the dry spring), prevailing southwest winds would drive flames uphill, resulting in increased fire propagation and severity in the eastern portion of the watershed. It is important to remember that the entire La Jara Watershed is only 3,300 acres. Given the size and severity of contemporary wildfires in the Jemez Mountains and throughout the Southwest (e.g., the Las Conchas Fire was 156,293 acres), this entire watershed could be burned at moderate and high severity in a matter of hours given the right fuel and weather conditions.
Mitigation options given the fire and debris-flow concerns include conducting fuel reduction treatments at lower elevations, followed by recurring prescribed fires. The importance of recurring, perpetual maintenance burns cannot be overemphasized. Research has shown that thinning treatments alone without follow-up fire treatments do little to significantly change fire behavior (Cram et al., 2006; Mason et al., 2007; Martinson and Omi, 2013). Complementary treatments in the upper-elevation watershed (i.e., within the wilderness boundary) could include lop, pile, and burn treatments; broadcast prescribed fire; as well as allowing natural ignitions to burn when fuel and weather conditions are conducive to achieving low and moderate burn severities as well as isolated high severity. Results from this case study suggest that a 20–30% decrease in the percentage of basin area burned at moderate and high severity could reduce debris-flow probability between 30 and 40% given a 2-year rainfall event (Figure 6a).
Secondary to forest management, there may be an opportunity to fortify the existing water treatment infrastructure at the bottom of the watershed (see blue circle in Figure 1). Given the relatively small footprint of this infrastructure, a structurally and economically viable solution may be achievable. However, this is out of the scope of this analysis. It is reasonable to estimate that if the water treatment infrastructure were to be destroyed by debris flow, replacing it would be costly.
Acknowledgments
We thank Ernie Torrez for bringing this issue to the Range Improvement Task Force, acting as a liaison to help access the La Jara community, and seeking scientific solutions. We thank Jon Williams, NMWRRI, for initial GIS work. We wish to particularity thank Anne Tillery for her guidance along the way and for excellent comments and edits on an earlier draft of this manuscript. We also thank Dr. Alexander “Sam” Fernald and Dr. Hatim Geli from New Mexico State University and Martha Graham from New Mexico Rural Water Association for reviewing this manuscript and providing helpful comments.
Literature Cited
Benavides-Solorio, J., and L.H. MacDonald. 2001. Post-fire runoff and erosion from simulated rainfall on small plots, Colorado Front Range. Hydrological Processes, 15, 2931–2952.
Bonnin, G., D. Martin, B. Lin, T. Parzybok, M. Yekta, and D. Riley. 2011. Precipitation-frequency atlas of the United States, atlas 14, v. 1, version 5. Silver Spring, MD: National Weather Service, National Oceanic and Atmospheric Administration. Accessed August 25, 2017, at http://hdsc.nws.noaa.gov/hdsc/pfds/.
Cannon, S.H., J.E. Gartner, R.C. Wilson, J.C. Bowers, and J.L. Laber. 2008. Storm rainfall conditions for floods and debris flows from recently burned areas in southwestern Colorado and southern California. Geomorphology, 96, 250–269.
Cannon, S.H., J.E. Gartner, M.G. Rupert, J.A. Michael, A.H. Rea, and C. Parrett. 2010. Predicting the probability and volume of postwildfire debris flows in the intermountain western United States. Geological Society of America Bulletin, 122, 127–144.
Cram, D.S., T.T. Baker, and J.C. Boren. 2006. Wildland fire effects in silviculturally treated vs. untreated stands of New Mexico and Arizona [Research Paper RMRS-RP-55]. Fort Collins, CO: USDA Forest Service, Rocky Mountain Research Station.
Falk, D. 2017. Restoration ecology, resilience, and the axes of change. Annals of the Missouri Botanical Garden, 102, 201–216.
Finney, M.A. 2006. An overview of FlamMap fire modelling capabilities. In P.L. Andrews and B.W. Butler (Comps.), Fuels management—How to measure success: Conference proceedings, 28–30 March, 2006, Portland, OR [Proceedings RMRS-P 41] (pp. 213–220). Fort Collins, CO: USDA Forest Service, Rocky Mountain Research Station.
Gartner, J.E., S.H. Cannon, P.M. Santi, and V.G. Dewolfe. 2008. Empirical models to predict the volumes of debris flows generated by recently burned basins in the western U.S. Geomorphology, 96, 339–354.
Gesch, D.B., M.J. Oimoen, S.K. Greenlee, C.A. Nelson, M.J. Steuck, and D.J. Tyler. 2002. The national elevation dataset. Photogrammetric Engineering and Remote Sensing, 68, 5–11.
Helsel, D.R., and R.M. Hirsch. 2002. Statistical methods in water resources, vol. 49, 1st ed. New York: Elsevier Science Publishing Company Inc.
Kean, J.W., D.M. Staley, and S.H. Cannon. 2011. In situ measurements of post-fire debris flows in southern California: Comparisons of the timing and magnitude of 24 debris-flow events with rainfall and soil moisture conditions. Journal of Geophysical Research, 116. doi:10.1029/2011JF002005.
Keeley, J.E. 2009. Fire intensity, fire severity and burn severity: A brief review and suggested usage. International Journal of Wildland Fire, 18, 116–126.
Liebmann, M.J., J. Farella, C.I. Roos, A. Stack, S. Martini, and T.W. Swetnam. 2016. Native American depopulation, reforestation, and fire regimes in the Southwest United States, 1492–1900 CE. Proceedings of the National Academy of Sciences, 113, E696–E704.
Martinson, E.J., and P.N. Omi. 2013. Fuel treatments and fire severity: A meta-analysis [Research Paper RMRS-RP-103WWW]. Fort Collins, CO: USDA Forest Service, Rocky Mountain Research Station.
Mason, G.J., T.T. Baker, D.S. Cram, J.C. Boren, A.G. Fernald, and D.M. VanLeeuwen. 2007. Mechanical fuel treatment effects on fuel loads and indices of crown fire potential in a south central New Mexico dry mixed conifer forest. Forest Ecology and Management, 251, 195–204.
Melton, M.A. 1965. The geomorphic and paleoclimatic significance of alluvial deposits in southern Arizona. Journal of Geology, 73, 1–38.
Reynolds, R.T., A.J. Sánchez Meador, J.A. Youtz, T. Nicolet, M.S. Matonis, P.L. Jackson, D.G. DeLorenzo, and A.D. Graves. 2013. Restoring composition and structure in southwestern frequent-fire forests: A science-based framework for improving ecosystem resiliency [RMRS-GTR-310]. Fort Collins, CO: USDA Forest Service, Rocky Mountain Research Station.
Ryan, K.C., and T.S. Opperman. 2013. LANDFIRE—A national vegetation/fuels data base for use in fuels treatment, restoration, and suppression planning. Forest Ecology and Management, 294, 208–216.
Schwartz, G.E., and R.B. Alexander. 1995. Soils data for the conterminous United States derived from the NRCS State Soil Geographic (STATSGO) data base [Open-File Report 95–449]. Reston, VA: U.S. Geological Survey. Accessed July 2013, at http://water.usgs.gov/GIS/metadata/usgswrd/XML/ussoils.xml.
Scott, J.H., and E.D. Reinhardt. 2001. Assessing crown fire potential by linking models of surface and crown fire behavior [Research Paper RMRS-RP-29]. Fort Collins, CO: USDA Forest Service, Rocky Mountain Research Station.
Tillery, A.C., and J.R. Haas. 2016. Potential postwildfire debris-flow hazards—A prewildfire evaluation for the Jemez Mountains, north-central New Mexico [Scientific Investigations Report 2016-5101]. Reston, VA: U.S. Geological Survey.
Tillery, A.C., M.J. Darr, S.H. Cannon, and J.A. Michael. 2011a. Postwildfire debris flow hazard assessment for the area burned by the 2011 Track Fire in northeastern New Mexico and southeastern Colorado [Open-File Report 2011-1257]. Reston, VA: U.S. Geological Survey.
Tillery, A.C., M.J. Darr, S.H. Cannon, and J.A. Michael. 2011b. Postwildfire preliminary debris flow hazard assessment for the area burned by the 2011 Las Conchas Fire in north-central New Mexico [Open-File Report 2011-1308]. Reston, VA: U.S. Geological Survey.
Tillery, A.C., J.R. Haas, L.W. Miller, J.H. Scott, and M.P. Thompson. 2014. Potential postwildfire debris-flow hazards—A prewildfire evaluation for the Sandia and Manzano Mountains and surrounding areas, central New Mexico [Scientific Investigations Report 2014-5161]. Reston, VA: U.S. Geological Survey.
Verdin, K.L., J.A. Dupree, and J.G. Elliot. 2012. Probability and volume of potential postwildfire debris flows in the 2012 Waldo Canyon burn area near Colorado Springs, Colorado [Open-File Report 2012-1158]. Reston, VA: U.S. Geological Survey.
Westerling, A.L., H.G. Hidalgo, D.R. Cayan, and T.W. Swetnam. 2006. Warming and earlier spring increase western U.S. forest wildfire activity. Science, 313, 940–943.
Western Regional Climate Center. RAWS USA Climate Archive. Accessed July 2017, at https://raws.dri.edu/.
To find more resources for your business, home, or family, visit the College of Agricultural, Consumer and Environmental Sciences on the World Wide Web at pubs.nmsu.edu
Contents of publications may be freely reproduced for educational purposes. All other rights reserved. For permission to use publications for other purposes, contact pubs@nmsu.edu or the authors listed on the publication.
New Mexico State University is an equal opportunity/affirmative action employer and educator. NMSU and the U.S. Department of Agriculture cooperating.
December 2017 Las Cruces, NM