Guide H-651
Esteban A. Herrera, Extension Horticulturist,
William C. Lindemann, Soil Microbiologist
College of Agriculture, Consumer and Environmental Sciences New Mexico State University. (Print Friendly PDF)
In many crops, plant growth is limited the most by the availability of water and nitrogen (N). This is especially true in arid regions, the indigenous level of nitrogen in soil organic matter is low and irrigation supplies most or all of the crop water requirement.
Commercial pecan production in the desert Southwest would be impossible without substantial yearly inputs of water and N. The fertilization program of most pecan orchards involves mainly N and zinc (Zn). For the most part, Zn requirements are met with foliage sprays. This publication covers some aspects of N fertilization.
Two methods are used to predict the nutrient status of a pecan orchard: soil analyses and leaf analyses. A soil analysis provides a “snapshot” of the nutrients available to the tree from a localized area in the soil profile. By analyzing soil, growers should be able to identify deficient nutrients. However, soil analysis is a poor diagnostic tool, because it only assesses a small amount of soil. Trees, especially pecans, have extensive root systems that mine large amounts of soil for nutrients. Also, a soil analysis indicates nutrient quantities in the soil that don’t reflect actual nutrient uptake by roots. Thus, soil analysis truly does not indicate the tree’s actual nutritional status. Because of these limitations, no critical nutritional levels for essential elements in soil have been established for trees as they have been for field and row crops with considerably smaller root systems.
Leaf analysis is another commonly used method to monitor a pecan tree’s nutrient status. Critical leaf levels for the essential elements (nutrients) have been established for most tree crops, including pecans. Leaf samples are taken in midsummer, when leaf nutrient levels are stable and the tree’s nutrient requirements are greater. Because leaf analysis reflects the tree’s nutrient status, supplemental fertilizer needs can be determined.
Using leaf analysis to determine the trees’ current N status is essential to figuring out the amount of N to apply. Trees with high leaf N and high N content in the soil analysis may not require any additional N, that would encourage excessive shoot growth and minimize production. Also, pecan trees with adequate N and a light crop usually do not require more than the normal of N application rate. Low N rates are needed for transplanted and heavily pruned trees.
Nitrogen occurs in the soil in several forms. Most occurs as organic N in organic matter (plant residues and humus). A typical loamy soil in the Mesilla Valley contains 500–1,000 parts per million (ppm) of organic N (approximately 2,121–4,243 lbs). Thus, soil organic matter and organic fertilizers act as a reservoir for N. However, organic N must be converted to a form that plants can absorb. Organic N does not leach in appreciable quantities.
The conversion of organic N to usable N by plants is called mineralization. In this process, soil microorganisms decompose organic matter and release ammonium (NH4) into the soil solution. Most of the NH4 released is from residues from previous years, but small amounts come from humus as well (fallen leaves and hulls make for most organic residues in pecan orchards). Likewise, microorganisms make small amounts of humus each year, putting some of the residue N back into the humus reservoir (fig. 1). Mineralization occurs quickest under warm, moist, and well-aerated soil conditions that are favorable to microbial activity. The N from tree leaves that is incorporated into the soil surface is all mineralized the first year, while the N in husks probably takes at least two years to totally mineralize. Manure and other organic fertilizers usually mineralize about 40–60% of their organic N the first year after application and about 50% of the remaining organic N in subsequent years. Urea (a synthetic, organic N source) mineralizes within a week if conditions are conducive to microbial activity.

Fig. 1. Nitrogen cycling in the soil-plant system that shows losses of fertilizer N through denitrification, ammonia volatilization, and leaching.
Although plants can absorb some NH4 (especially young trees), most of the NH4 produced is quickly converted to nitrate (NO3). Ammonium can leave the soil system as a gas ammonia (NH3), but ammonia volatilization losses are usually small. Incorporating ammonium-based N fertilizers like urea into the soil and encouraging good soil drainage will diminish volatilization. Ammonium does not readily leach (movement of a substance with water through the soil profile and out of the root zone), because it is strongly held by soil particles and conversion to NO3 occurs rapidly. A typical, loamy soil in the Mesilla Valley contains 1–3 ppm (4–13 lbs.) of NH4-N, if no fertilizer has recently been applied.
Nitrate is the main form of N absorbed by plants. The conversion of NH4 to NO3 in soil (nitrification) is usually quick, if the conditions are conducive to microbial activity (warm, moist, and well aerated). Thus, most of the N, either organic or synthetic, entering the soil system, ends up as NO3. During nitrification, acidity is produced. Ammonium sulfate is the greatest acid producer, but all ammonium-based fertilizers and organic fertilizers create acidity. Nitrate is very mobile. It easily leaches from the soil (because it is not held by soil particles) or escapes to the atmosphere in the form of a gas (denitrification). A loamy soil in the Mesilla Valley contains 5–20 ppm (21–85 lbs) of NO3-N, if no fertilizer has recently been applied. Thus, adequate orchard management requires good water management to prevent N losses out of the root system through leaching and denitrification. It has been shown that unaccounted for fertilizer N losses of (leaching and denitrification) are relatively low in orchards, when N is applied in several small dosages throughout the season. However, when N fertilizer is applied in one or two applications during the season, N losses dramatically increase.
Denitrification is a major loss of N from the soil system. Denitrification occurs when nitrates are converted to N2 gas and the gaseous oxides of N (NO2 and N2O). Like mineralization and nitrification, denitrification is a biological process mediated by soil microorganisms. Unlike mineralization and nitrification, most denitrification occurs under wet, poorly aerated conditions. Thus, poorly drained soils can lose much of their NO3 via denitrification. Good water and N management will reduce but not eliminate denitrification losses.
Nitrogen is absorbed by pecan trees mainly as nitrate from the soil solution, as water is evaporated from the leaf surface, it is replaced with water absorbed by the roots. Nutrients such as nitrate are absorbed with the water. Therefore, applying N when no leaves are on the tree (early in the season) results in little N absorption; soil water is not being actively taken up by trees. Thus, N fertilizers results in a quick conversion to nitrate and subsequent loss with little plant uptake, especially after the season’s first (heavy) irrigation.
It is clear that N moves in the soil system in response to microbial, chemical, and physical processes as opposed to primarily chemical and physical processes that influence other nutrients, such as phosphorus and Zn. The cycling of N in soil is a natural occurrence that is highly influenced by orchard management decisions. The processes leading to N loss from the soil-plant system (NH3 volatilization, leaching, and denitrification) cannot be avoided completely, but losses can be minimized through water and orchard management and knowledge of how N moves in the soil-tree system.
To better understand the fate of N in New Mexico pecan orchards, an experiment was started in 1996 using a nonradioactive N isotope (15N). 15N allows the tracing of fertilizer N within the plant and in the soil. The experiment was conducted in a commercial pecan orchard using the cooperator’s normal management techniques. After the first application (March 25, 1996) of 104 lb/acre of 15N-labeled ammonium sulfate (NH4SO4), the orchard was flood-irrigated with 3.9 inches of water (table 1). After 10 days, small amounts of fertilizer 15N had moved to a depth just above the water table (9 feet), but the highest concentration remained in the upper soil profile (fig 2). The 15N fertilizer recovery in the entire profile was 98.6%, with 85.8% remaining in the upper 3 feet of soil. Background 15N in figs. 2 and 3 represent the amount of 15N naturally present in the soil.
Table 1. Dates and rates of 15N-labeled (NH4)2SO4 application and quantity of water applied immediately following fertilization in 1996.
| Date | ------------ Fertilizer ------------ | Water Applied (inches) |
|
| (NH4)2SO4 | N | ||
| ------------ lb / acre ------------ | |||
| March 25 | 104.0 | 21.7 | 3.9 |
| April 23 | 306.6 | 64.0 | 3.0 |
| May 13 | 134.7 | 28.1 | 3.3 |
| May 24 | 134.7 | 28.1 | 3.3 |
| June 3 | 132.4 | 27.7 | 3.7 |
| June 15 | 132.4 | 27.7 | 4.4 |
| Rest of the season | — | — | 38.2 |
| Total | 944.8 | 197.3 | 59.8 |

Fig. 2. 15N-fertilizer location in soil 10 days after fertilizer application and irrigation in March 1996.
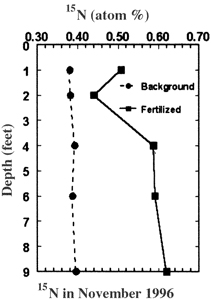
At the end of the growing season (Nov. 6, 1996), after 945 lb per acre of labeled NH4SO4 had been applied (table 1), about 35.4% of the 15N fertilizer applied was recovered in soil to a depth of 9 feet (fig. 3a and table 2). Enrichment was most pronounced at the greater depths, 15N close to the surface was mainly in the organic form or else it would have moved deeper into the profile. The presence of elevated 15N levels directly above the water table indicates a large potential loss of fertilizer N to the groundwater by leaching.

Fig. 3a. 15N fertilizer location in soil at the end of the 1996 season.
Table 2. 15N recovery in the soil and tree at the end of the 1996-1999 seasons, following application of 945 lbs of 15N-(NH4)2SO4 (197 lbs of actual N) in 1996.
| Component | --------------- % Recovery --------------- | |||
| 1996 | 1997 | 1998 | 1999 | |
| Tree | 21.8 | 15.1 | 10.1 | 5.5 |
| Soil (0-9 ft) | 35.4 | 12.5 | 11.7 | 11.2 |
| Previously harvested nuts | – | 3.9 | 4.8 | 5.2 |
| Total (tree and soil) | 57.2 | 31.5 | 26.6 | 21.9 |
| Lost to the environment | 42.8 | 68.5 | 73.4 | 78.1 |
| Tree Component Leaf (recycled) Shuck (recycled) Nut (removed) Root (stored) Wood (stored) |
5.6 0.9 3.9 3.2 8.2 |
2.7 0.4 0.9 2.9 8.2 |
1.2 0.2 0.4 2.2 6.1 |
1.3 0.1 0.3 1.4 2.4 |
During the following winter, the orchard was irrigated with 4.4 inches of water and received an additional 0.6 inch of precipitation. Calculations indicated that between Nov. 6, 1996, and March 3, 1997, 13% of the 15N applied in 1996 was lost from the soil profile, again suggesting fertilizer N leaching into the groundwater. Nitrate uptake during the winter months in which no transpiration occurred would have been minimal, particularly at depths below 4 feet, where root absorption and root concentration is low.
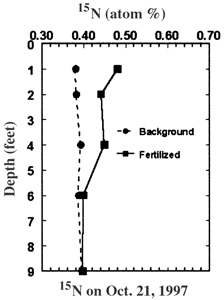
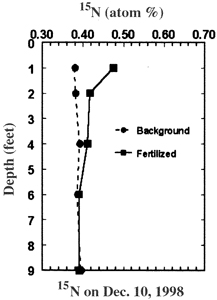
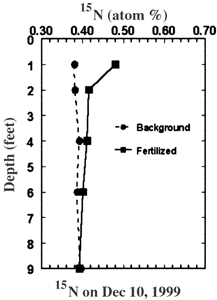
At the end of all three seasons, (1997, 1998 and 1999) the amount of 15N below 4 feet was small (figs. 3b, 3c, 3d). Most of the 15N fertilizer applied in 1996 was recycling in the upper 4 feet of soil and bound in organic debris and humus. The 15N fertilizer recovery in the soil (table 2) shows a large drop between 1996 and 1997, and only a slight drop between 1997 and 1999. These data clearly show that some fertilizer N will recycle between tree and soil for many years after application, and the year of application has the greatest N loss.

Fig. 3b. 15N fertilizer location in soil at the end of the 1997 season.

Fig. 3c. 15N fertilizer location in soil at the end of the 1998 season.

Fig. 3d. 15N fertilizer location in soil at the end of the 1999 season.
The 15N enrichment of plant tissue was evident in all years after application and in all tissues (wood, roots, nuts, leaves, catkins). In 1997 and subsequent years, the grower applied commercial NH4SO4 (1,600 lb per acre) in several split applications, yet the 15N content in the tree in 1997 was only slightly lower than the 15N content in 1996. The 15N present in the 1997 leaf tissue represents either fertilizer N from 1996 that was translocated from reserve tissue or N absorbed from the soil. This result demonstrates that for pecan trees the benefits of N fertilization in the current year extend to the following season.
At the end of the 1996 growing season, the total recovery of 15N fertilizer was 57.2% (table 2). Of this, 35.4% was in the soil and 21.8% in the tissue. Of the 15N recovered in the tissue, 3.9 % (kernel and shell) was removed during harvest, 6.5% (leaf and shuck) was recycled, and 3.2% and 8.2% was stored in the root and wood, respectively. Nitrogen lost from the soil-plant system (42.8%) was presumably due to leaching, denitrification, and ammonia volatilization. We suspect that leaching was the major cause. Volatilization was kept to a minimum because the 15N fertilizer was incorporated by hand and the orchard irrigated within 24 hours. Denitrification was probably low because of the soil’s low organic matter content. Leaching losses of nitrates could have been higher in this experiment if the cooperator had applied the N fertilizer in two split applications in March and June, as is customary in the Mesilla Valley. By the end of the 1999 growing season, 78.1% of the 15N fertilizer applied in 1996 was lost and 21.9% could be accounted for in soil and tree components. These percentages translate to 22.1 lbs of N in the soil (mainly organic); 7.5 lbs of N stored in the tree (roots and wood); 2.8 lbs of N to be recycled (leaves and shucks); 10.9 lbs of N in pecans harvested from 1996 to1999; and 153.4 lbs N lost through leaching, denitrification, and volatilization (table 2, fig .4)

This experiment was conducted under fertilization, irrigation, and other management practices typical of commercial pecan production in the Southwest. It provides the first quantitative data to describe the fate of 15N fertilizer applied to pecan trees during the year of application and subsequent years. The data indicate that management of both N fertilizer and water are closely linked. The soil at depths greater than about 1 foot remained near field capacity the entire growing season as determined by neutron probe and tensiometer measurements. However, irrigation water was applied numerous times during the growing season and during the winter to keep the top foot moist. Our data clearly show 15N accumulation below 4 feet and its eventual loss from the profile. Although some leaching is required to control salinity, application of smaller amounts of water would conserve both water and N fertilizer and would reduce nitrate contamination of groundwater.
To find more resources for your business, home, or family, visit the College of Agricultural, Consumer and Environmental Sciences on the World Wide Web at pubs.nmsu.edu.
Contents of publications may be freely reproduced for educational purposes. All other rights reserved. For permission to use publications for other purposes, contact pubs@nmsu.edu or the authors listed on the publication.
New Mexico State University is an equal opportunity/affirmative action employer and educator. NMSU and the U.S. Department of Agriculture cooperating.
Printed and electronically distributed August 2001, Las Cruces, NM.


