Guide H-510
Cheryl Kent and Bernd Leinauer
College of Agricultural, Consumer and Environmental Sciences, New Mexico State University
Authors: Respectively, Extension Agricultural/Horticulture Agent, Bernalillo County Extension Office; and Extension Turfgrass Specialist, Department of Extension Plant Sciences, New Mexico State University. (Print Friendly PDF)
Introduction
The natural precipitation in New Mexico is not sufficient to grow and sustain turfgrasses and most other landscape plants. Therefore, supplemental irrigation is necessary to maintain turf at an acceptable quality level. Pop-up sprinklers are commonly used to irrigate lawn areas. Understanding the precipitation rate and uniformity of the sprinkler system will allow correct irrigation scheduling for more efficient irrigation and water savings. The step-by-step instructions outlined in this guide will help you perform a catch can irrigation audit on a pop-up sprinkler system. For a complete discussion on all aspects of turfgrass irrigation, refer to NMSU Circular 660, Turfgrass Irrigation (available at https://pubs.nmsu.edu/_circulars/CR660/).
Preparing for the Audit
1. Visually inspect your system for obvious problems.
In many cases, an initial visual inspection can detect obvious problems that can be corrected, which will greatly improve the performance of the irrigation system. Turn on the system and watch it run. Are there broken sprinklers or obvious adjustments needed (heads not popping up all the way, clogged heads, or heads pointing in the wrong direction with water falling on the sidewalk instead of the lawn)? Are there obstructions preventing water from reaching the intended target (tree trunks, overgrown grass, weeds, or overhanging shrubs)?
2. Fix problems. Repair problems before proceeding further. If necessary, consult with a landscape contractor.
3. Map out the sprinkler heads. Locate all sprinkler heads and note the type and model. Sketch a map of the area and assign a number to each head on the map. Record the distance between heads and mark this on the map. For lawns with multiple irrigation zones, indicate which heads are in which irrigation zone.
Performing the Audit
If possible, perform the audit at the same time of day that irrigation normally takes place. Choose a calm day (winds less than or equal to 5 mph). Use catch cans to collect and measure the water delivered by the irrigation system. Catch cans are receptacles of uniform size placed on the lawn area (Figure 1). A minimum of 24 catch cans are needed for reliable results. Calibrated containers may be purchased from an irrigation supply store (Figure 2).
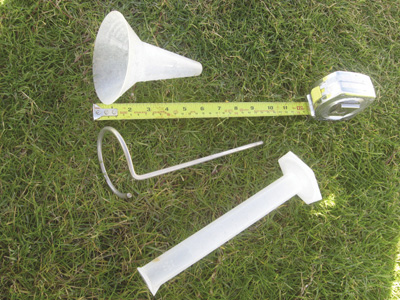
Figure 1. Calibrated catch can, measuring tape, metal support stake, and graduated cylinder.
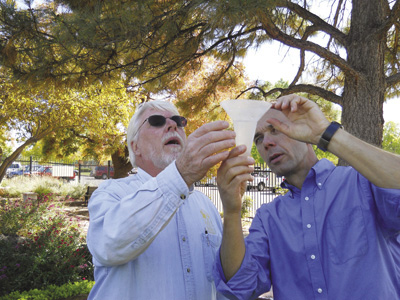
Figure 2. If graduated catch cans are used for irrigation audit, the graduated cylinder from Figure 1 is not needed and the volume may be read directly from the catch can.
The "Tuna Can" Audit
Food cans, such as tuna, cat food, or coffee cans, may be used as catch cans. However, they are hard to level, and most will need small rocks inside to keep them on the ground and leveled. After running sprinklers for a set amount of time, simply measure the depth of water in the cans with a ruler after removing any rocks used for leveling. This sort of "tuna can" audit will not be as accurate as using calibrated containers, but valuable information can still be obtained.
4. Measure the surface area of the catch can (Figure 3). Express the answer in in². If a round container is used, the surface area (A) is equal to the radius of the container opening squared multiplied by π.
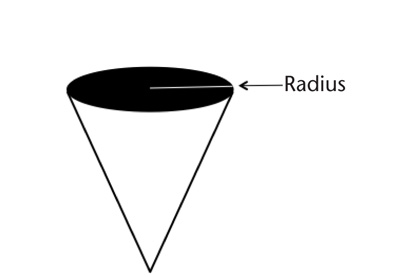
Figure 3. Sketch of catch can. Black area is the surface area (A) of the catch can.
Formula for the area of a circle: A = π r²
Example: π = 3.1416; r = 2.25 in
A = 3.1416 x 2.252 = 15.9 in²
5. Place catch cans (Table 1, Figure 4).
Table 1. Quick Reference for Placing Catch Cans Properly*
| Sprinkler Design | Catch Can Placement |
| Fixed spray heads in irregularly shaped areas (sprinklers are not in defined rows; this applies to most homeowners). See Figure 6. | Place the catch cans out in a rough grid pattern 5 to 8 ft apart within one zone. Repeat for each zone. See Figure 6. |
| Fixed spray heads that are in defined, evenly spaced rows. | Place catch cans in a rough grid pattern 10 to 20 ft apart. Repeat for each zone. |
| Rotor sprinklers in irregularly shaped areas. | Place catch cans in a rough grid pattern 10 to 20 ft apart. |
| Rotor sprinklers that are in defined rows but less than 40 ft apart. This very likely only applies to parks, fairways, and large backyards for which you have several zones of only turf. | Place a catch can 2 to 3 ft from the sprinkler head and then place another catch can every one-third the distance to the next sprinkler head. Use this spacing for the grid pattern (see Example 1). |
| Rotor sprinklers in defined rows greater than 40 ft apart. This very likely only applies to parks, fairways, and large backyards for which you have several irrigated zones of only turf. | Place a catch can 2 to 3 ft from the sprinkler head and then place another catch can every one-fourth the distance to the next sprinkler Use this spacing to form a grid pattern (see Example 2). |
| * For all arrangements, catch cans should be at least 12 to 24 inches from the edge of the lawn. | |
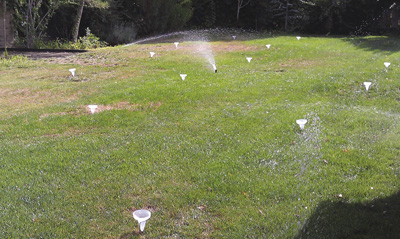
Figure 4. Catch cans placed in a grid pattern on a home lawn.
• Example 1: For two sprinkler heads that are 30 ft apart, place a catch can 2 ft away from each sprinkler head. The distance between the catch cans is 26 ft. Divide 26 by 3, which is 8.7 ft, or one-third the distance between catch cans. Place a catch can at 10.7 ft and at 19.4 ft (total of four equally spaced catch cans). See Figures 5 and 6.
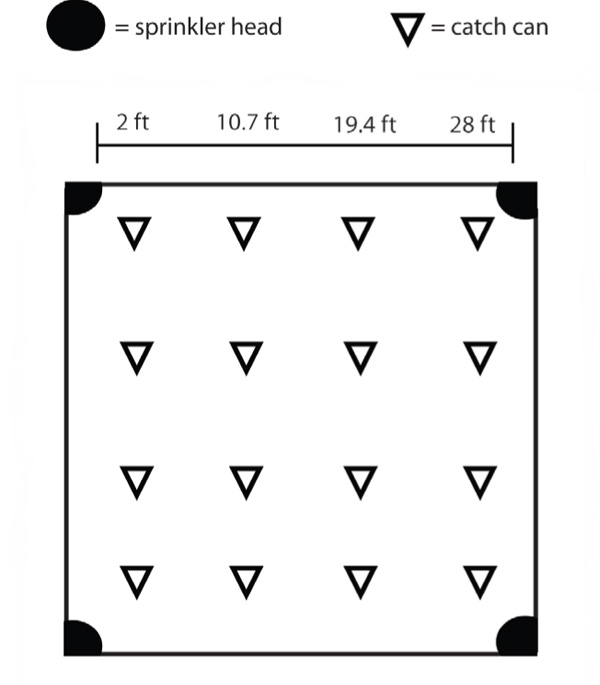
Figure 5. Sketch of approximate catch can locations for Example 1. The same configuration can be used for Example 2, but the spacing between catch cans would change.
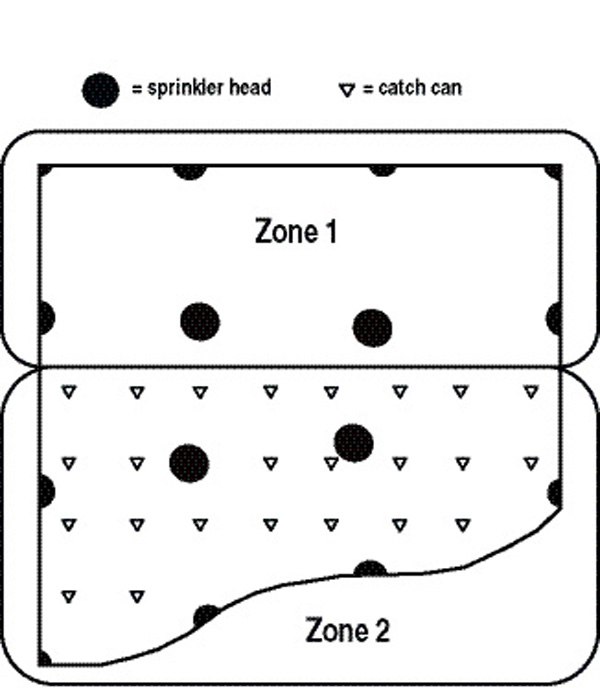
Figure 6. Sketch of approximate catch can locations for an irregularly shaped lawn. Catch cans are approximately 8 ft apart. Sprinklers in zone 1 will overspray into zone 2, so run both zones before collecting data.
• Example 2: For two heads that are 50 ft apart, place a catch can 2 ft away from each head. The distance be tween catch cans is 46 ft. Divide 46 by 4, which is 11.5 ft, or one-fourth the distance. Place catch cans at 13.5 ft, 25 ft, and 36.5 ft (total of five equally spaced catch cans).
6. Run irrigation system for set amount of time. Preferably, use the runtime commonly used to irrigate the turf area (10 minutes, for example). Caution! Do not perform the audit on a windy day (less than 5 mph wind is recommended). During inspection, if significant overspray between zones is an issue, audit the two adjacent zones at the same time by setting catch cans out in both zones and allowing each zone to run for the same amount of time before collecting data from the catch cans.
7. Measure the volume in milliliters (mL) in each container. Use a graduated cylinder or measuring cup and record volumes on a data sheet. Some catch cans available for purchase may have the graduation for mL or inches already on them.
Performing the Calculations
8. Once the data are collected, calculate the average volume of water in each container.
• Example: Volume in mL for 24 catch cans:
13, 35, 40, 29, 39, 41, 45, 45, 30, 35, 47, 35, 79, 79, 50, 35, 17, 22, 28, 46, 67, 78, 42, 53
Sum = 1030 mL
Average = 1030 mL/24 = 42.9
9. Calculate the irrigation amount (Ia). The irrigation amount is equal to the average volume of water (mL) divided by the catch can surface area A (in² , calculated in Step 4): Ia = Avg (mL) / A (in² )
• Example: 42.9 mL / 15.9 in² (from Step 4) = 2.7 mL/in²
10. Convert the irrigation amount from Step 9 to inches. To convert Ia from mL/in² to inches, multiply the result by 0.06. This gives you the average amount of water applied to the lawn per unit of time (Example: 2.7 mL/in² x 0.06 = 0.2 inch rounded up to the nearest 1/10 inch). This means the irrigation system precipitated 0.2 inch of water on average in the allotted runtime. The number is useful for an overall Ia, but it does not tell you how uniformly the water is applied.
11. In order to determine how uniformly the sprinklers irrigate, arrange the catch can data from smallest to largest. Calculate the average volume of the lowest quarter (25% of the catch cans that collected the lowest amount of precipitation). If you used 24 catch cans for your irrigation audit, you need the average volume of the six cans that collected the least amount. Divide the lowest quarter average by the total average and then multiply by 100. This gives you the lowest quarter distribution uniformity in percent (%).
• Example: 13, 17, 22, 28, 29, 30, 35, 35, 35, 35, 39, 40, 41, 42, 45, 45, 46, 47, 50, 53, 67, 78, 79, 79(data from Step 8 arranged in ascending order)
Lowest quarter = 13, 17, 22, 28, 29, 30
Sum = 139 mL
Average = 139 mL / 6 = 23.2
Lowest quarter average / Total average (from Step 8) = 23.2 / 42.9 = 0.54
0.54 x 100 = 54%
Table 2 lists a ranking for distribution uniformity values. The distribution uniformity of your sprinkler system should at least rate "good." If the rating is lower than "good," investigate the causes for the poor uniformity. Not all problems are obvious, and you may need the help of a landscape contractor to address and fix them.
Table 2. Lowest Quarter Distribution Uniformity Rating for Sprinklers Used in Turf Irrigation
|
Excellent
|
Very Good
|
Good
|
Fair
|
Poor
|
|
| Fixed Spray |
0.75
|
0.65
|
0.55
|
0.50
|
0.40
|
| Rotor |
0.80
|
0.70
|
0.65
|
0.60
|
0.50
|
12. The midpoint uniformity may be calculated by following the directions in Step 11 using the data from the lowest half (50% of the catch cans that collected the lowest amount of precipitation). This number is useful if the desire is not to maintain a very high-quality turf. In our example, this would be the 12 cans with the lowest amounts. This result is known as the midpoint uniformity.
• Example:
13, 17, 22, 28, 29, 30, 35, 35, 35, 35, 39, 40, 41, 42, 45, 45, 46, 47, 50, 53, 67, 78, 79, 79
Lowest half = 13, 17, 22, 28, 29, 30, 35, 35, 35, 35, 39, 40
Sum = 358 mL
Average = 358 mL / 12 = 29.8
Lowest half average / Total average (from Step 8) = 29.8 / 42.9 = 0.70
0.70 x 100 = 70%
Please see pages 9 and 10 of NMSU Circular 660, Turfgrass Irrigation, for more details on how to use the data from the irrigation audit for irrigation scheduling.
In summary, understanding the precipitation rate and uniformity of the sprinkler system will allow correct irrigation scheduling, resulting in more efficient irrigation and water savings. Please contact your county Extension agent with any questions on sprinkler irrigation auditing.
References
Irrigation Association. 2009. Recommended audit guidelines.

Cheryl Kent is the Bernalillo County Horticulture Agent for New Mexico State University's Cooperative Extension Service. She earned her B.S. in Biology from the University of Texas at Austin and M.S. in Agronomy from New Mexico State University. She is ready to answer questions about vegetable gardening, trees, pests, lawns, soil, and anything else related to horticulture.
To find more resources for your business, home, or family, visit the College of Agricultural, Consumer and Environmental Sciences on the World Wide Web at pubs.nmsu.edu
Contents of publications may be freely reproduced for educational purposes. All other rights reserved. For permission to use publications for other purposes, contact pubs@nmsu.edu or the authors listed on the publication.
New Mexico State University is an equal opportunity/affirmative action employer and educator. NMSU and the U.S. Department of Agriculture cooperating.
Printed and electronically published July 2013 Las Cruces, NM