Managing Milk Composition: Evaluating Herd Potential
Guide D-104
Michael Looper, NMSU Extension Dairy Specialist
Sandra R. Stokes, Extension Dairy Specialist, The Texas A&M University System
Dan N. Waldner, Extension Dairy Specialist, Oklahoma State University
Ellen R. Jordan, Extension Dairy Specialist, The Texas A&M University System.
College of Agriculture, Consumer and Environmental Sciences New Mexico State University. (Print Friendly PDF)
This Publication is scheduled to be updated and reissued 3/06.
The major components of raw milk are water, fat, protein, lactose and minerals. These components can be influenced by many factors, including genetics and nutrition.
Nutrition or dietary influences readily alter the principle solids constituents of fat concentration and milk protein concentration. Fat concentration is the most sensitive to dietary changes and can be altered over a range of nearly 3.0 percentage units. Milk protein concentration can also be altered by dietary manipulation. However, compared to the alterations possible in fat concentration, the range is much smaller at approximately 0.60 percentage units. The concentrations of lactose and minerals, the other solids constituents of milk, do not respond predictably to dietary alterations.
Before attempting to alter and improve milk fat and protein production, however, it is important to evaluate the potential of a herd to respond to feed management changes. Following are some key points that can help determine your herd's potential.
Evaluating Potential
Fat and Protein Tests: Milk protein percent generally follows changes in milk fat content, except when milk fat depression occurs and when high levels of fat are fed. If the milk protein-to-milk fat ratio is less than 0.80 for Holsteins, milk protein depression may be a problem (Table 1). When the ratio is greater than 0.95, the herd suffers from milk fat depression (low milk fat test). In general, if results of the fats test are below the protein test by 0.2 points (e.g., 2.8 percent fat and 3.0 percent protein), rumen acidosis can be a problem. If greater than 20 percent of the cows exhibit fat:protein inversions, examine the feeding management program. Also, if protein tests below breed average or greater than 20 percent of cows have fats tests below 3.0 percent, reevaluate the feeding program.
| Breed | Protein-to-Fat Ratio Range |
| Ayrshire | 0.80 - 0.83 |
| Brown Swiss | 0.83 - 0.85 |
| Guernsey | 0.73 - 0.75 |
| Holstein | 0.80 - 0.83 |
| Jersey | 0.73 - 0.75 |
| Milking Shorthorn | 0.83 - 0.85 |
*Ratios calculated using true protein.
Feed Intake and Peak Milk Production: Feed intake is controlled by the animal's brain and is determined by meal frequency and size. However, the individual animal, type of ration and environmental factors influence intake.
Maximum feed intake minimizes negative energy balance during early lactation. As cows move into positive energy balance by consuming more energy than they are using, body weight is regained, losses in body condition are minimized and cows produce milk of normal fat and protein content. Increasing feed intake can improve milk protein by 0.2 to 0.3 units. This increase in milk protein percent may be caused by an overall increase in energy intake.
Cows should reach peak milk production between 4 to 8 weeks postpartum, followed closely by peak dry matter intake between 10 to 14 weeks postpartum. High producing cows eat 3.5 to 4.0 percent of their body weight daily as dry matter. If a herd is consuming less than 3.5 to 4.0 percent of body weight as dry matter, production of solids-corrected milk may be limited.
A slow rise in postpartum feed intake lengthens the days to peak milk production and may reflect metabolic problems or obese cows. Research has demonstrated that fat cows have depressed appetites at calving compared to thin cows. This results in longer delays to peak milk yield.
Cows with body condition scores greater than 3.75 at calving (obese) suffer from dry matter intake depressions of 1.5 to 2.0 percent for every 0.25 body condition score over 3.75. Therefore, monitor feed intake and days to peak milk production to determine if cows are managed properly with adequate, but not excessive, body condition.
Rumen pH: Evaluating rumen pH can be a useful tool in determining if acidosis is a potential problem in a herd and a cause for low fat tests or fat:protein inversions. The pH within the rumen can vary from 5.5 to 6.8, with 6.0 to 6.3 being optimal. The critical pH threshold is less than 5.0 for acute acidosis and less than 5.5 for subacute acidosis. In many dairy operations, subacute acidosis is a frequent challenge. Daily episodes of pH less than 5.5 ultimately predispose cattle to low-grade acidosis. Symptoms include erratic appetite, body weight loss, diarrhea and lameness.
Historically, stomach tubing has been used to collect samples of rumen fluid for pH determination. However, this procedure can lead to false interpretation because saliva contamination causes pH values higher than the actual rumen environment. Recently, rumenocentesis has been promoted as a means of collecting rumen fluid for diagnosis of low-grade acidosis. However, research indicates the rumenocentesis procedure can result in the development of abdominal abscesses accompanied by a temporary loss in milk production.
Cannulation of the rumen by a veterinarian is probably the preferred method for obtaining representative samples of rumen fluid. Cannulation has traditionally been used for research purposes and is not particularly suited for use on commercial dairy operations. In comparing results from the two methods, pH values from cannula collections will be approximately 0.35 points higher than those obtained by rumenocentesis.
Take rumen samples for pH determination 5 to 8 hours after feeding for herds receiving total mixed rations and 2 to 5 hours after concentrate feeding when forage and concentrate are fed separately. To obtain the best results and reduce variations, collect samples from a minimum of 10 to 12 animals per affected herd. If more than 30 percent of the cows within this subgroup have a pH less than 5.5, consider the entire group abnormal. Evaluate feeding management practices and adjust as needed.
Ration Particle Size: Adequate particle size in the ration is necessary to avoid digestive upset and low milk fat production. Cows require fiber and forage to stimulate chewing activity and saliva production, both of which are necessary for maintenance of rumen pH and rumen health.
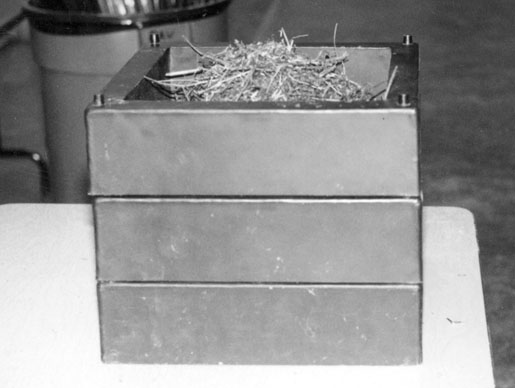
Particle size separators have been developed to measure particle size distribution in feeds. Separators consist of a series of stacked screens that separate a ration sample into various sized particles. This provides a visual, quantitative assessment of particle size distribution as it occurs in the rumen.
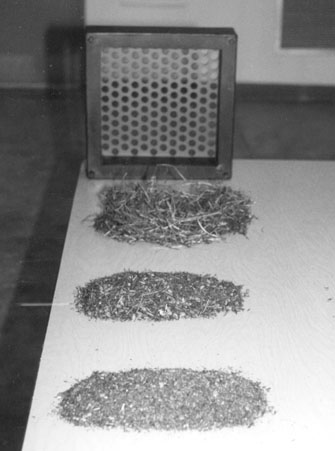
Use of a separator, such as the Penn State Particle Size Separator, is simple and can be used on-farm to monitor changes in forage harvesting procedures or feed mixing protocols. This tool separates particles into three groups: particles greater than 0.75 inches, between 0.31 and 0.75 inches, and less than 0.31 inches. The upper screen identifies particles that will be included in the rumen mat and will stimulate cud chewing and saliva production. The middle screen identifies the portion of the total mixed ration (TMR) that is moderately digestible. The bottom pan collects particles that are readily digestible or rapidly removed from the rumen. Table 2 (previous page) contains particle size distribution recommendations from Penn State University for forages and total mixed rations.
Use caution when applying these recommendations to southern dairies because both forage base and feeding management practices differ from the Northeast U.S. A Texas study evaluated particle size of lactation rations on 20 commercial dairies in Central Texas. Samples were evaluated using the Penn State Separator and compared to the Northeast recommendations. Results from this study (Table 3) show that Texas rations are considerably different and suggest that Northeast recommendations may not apply to rations fed in the South. Particle size analysis needs to be compared with other information about ration formulation, feeding management practices and, most importantly, responses from the cows to changes.
Table 3. Forage particle size distribution in Texas rations1.
| Top(>0.75") Screen 2 | Middle (0.75 - 0.31") Screen 2 | Bottom (<0.31") Screen 2 | |
| Silage-based TMR | 18 | 43 | 39 |
| Hay-based TMR | 22 | 32 | 46 |
1Adapted from Rippel et al., 1997. In: Mid-South Ruminant Nutrition Conference Proceedings, p. 20.
2Portion remaining on screen (%).
Chewing Activity: The level of fiber feeding and the physical size of the fiber particles contribute to the effectiveness of a fiber source for stimulating rumination (cud chewing), buffer production (salivation) and maintenance of milk with normal fat and composition. Feeding diets low in forage (less than 40 percent on total ration dry matter) or forages that are finely ground results in inadequate stimulation of chewing activity (less than 8 to 10 hours per day) and lower saliva production. As a general rule, approximately 40 percent of the cows not eating or drinking should be chewing their cuds during daylight hours.
Manure Evaluation: Manure that contains large amounts of undigested corn or with a pH less than 6.0 indicates that too much grain or nonfiber carbohydrates are being fed. It also indicates that acidosis may be a potential problem, resulting in low fat tests or protein:fat inversions.
Manure also can be evaluated and scored based on its consistency, which may indicate ration imbalances and signal potential problems. Table 4 lists fecal consistency scores and descriptions as well as example situations when certain fecal consistencies may occur. Various stages of production in a cow correlate to suggested fecal scores:
| dry cows | 3.5 |
| close-up dry cows | 3.0 |
| fresh cows | 2.5 |
| high producing cows | 3.0 |
| late lactation cows | 3.5 |
Manure scoring is not likely to become a popular management tool because considerable cow-to-cow variation exists. However, abrupt changes in appearance of feces can indicate changes in ration composition and alert managers to potential problems.
Table 4. Fecal consistency scores, descriptions and examples.
| Score | Description | Example |
| 1 | Thin, fluid, green | Sick cows, off feed, cows on pasture |
| 2 | Loose, splatters, little form | Fresh cows, cows on pasture |
| 3 | Stacks 1 to 1.5 inches high, dimples, | Recommended for high producing cows |
| 2 to 4 concentric rings | ||
| 4 | Stacks 2 to 3 inches | Dry cows, low protein, high fiber |
| 5 | Stacks over 3 inches | All forage, sick cows |

A separator is simple to use and can be used on-farm to monitor changes in forage harvesting procedures or feed mixing protocols.

The separator divides forage particles into three groups: particles greater than 0.75 inches, between 0.31 and 0.75 inches, and less than 0.31 inches.
Summary
Producers using DHIA (Dairy Herd Improvement Association) records are in the best position to critically evaluate their nutrition and feeding management programs. They are encouraged to work with their management teams to consider the above points in determining if their herds will respond to feed management changes to improve milk component composition. Refer to the publication "Managing Milk Composition: Maximizing Rumen Function" for more information.
The information given herein is supplied with the understanding that no discrimination is intended and no endorsement by the New Mexico State University or the Cooperative Extension Service is implied. The separator divides forage particles into three groups: particles greater than 0.75 inches, between 0.31 and 0.75 inches, and less than 0.31 inches. A separator is simple to use and can be used on-farm to monitor changes in forage harvesting procedures or feed mixing protocols.
New Mexico State University is an equal opportunity/affirmative action employer and educator. NMSU and the U.S. Department of Agriculture cooperating.
March 2001
Electronic Distribution March 2001


