Managing Milk Composition: Normal Sources of Variation
Guide D-103
Michael Looper, Sandra R. Stokes,Dan N. Waldner,Ellen R. Jordan
College of Agricultural Consumer and Environmental Sciences, New Mexico State University
Authors: Respectively, New Mexico State University Extension Dairy Specialist, Extension Dairy Specialist, The Texas A&M University System;Extension Dairy Specialist, Oklahoma State University; and Extension Dairy Specialist, The Texas A&M University System. (Print Friendly PDF)
Many factors influence the composition of milk, the major components of which are water, fat, protein, lactose and minerals.
Nutrition or dietary influences readily alter fat concentration and milk protein concentration. Fat concentration is the most sensitive to dietary changes and can vary over a range of nearly 3.0 percentage units. Dietary manipulation results in milk protein concentration changing approximately 0.60 percentage units. The concentrations of lactose and minerals, the other solids constituents of milk, do not respond predictably to adjustments in diet.
Milk composition and component yields also can be affected by genetics and environment, level of milk production, stage of lactation, disease (mastitis), season and age of cow.

Normal Sources of Variation in Composition
Genetics and Environment: Table 1 contains the breed averages for percentage of milk fat, total protein, true protein and total solids. A change in milk composition using traditional breeding techniques occurs slowly, although new techniques of genetic manipulation may allow faster progress in the future. Yields of milk, fat, protein and total solids are not easily impacted by genetics; heritability estimates for yield are relatively low at about 0.25. Meanwhile, heritability estimates for milk composition are fairly high at 0.50. Conversely, environmental factors such as nutrition and feeding management will impact yield more than the actual percent composition of the major milk constituents.
The priority placed on each genetic trait depends upon its economic or profit impact. Milk yield per cow tends to receive the most attention by producers. However, component yields should not be overlooked. Genetic selection should be directed toward increasing fat, protein and nonfat solids yields. But, because component percentages tend to have negative genetic associations with yield traits, a change in these percentages is not likely to be achieved through genetic selection alone.
| Table 1. Breed averages for percentages of milk fat, total protein, true protein and total solids. | ||||
| Percent | ||||
| Breed | Total Fat | Total Protein | True Protein | Total Solids |
| Ayrshire | 3.88 | 3.31 | 3.12 | 12.69 |
| Brown Swiss | 3.98 | 3.52 | 3.33 | 12.64 |
| Guernsey | 4.46 | 3.47 | 3.28 | 13.76 |
| Holstein | 3.64 | 3.16 | 2.97 | 12.24 |
| Jersey | 4.64 | 3.73 | 3.54 | 14.04 |
| Milking Shorthorn | 3.59 | 3.26 | 3.07 | 12.46 |
Level of Production: Yields of fat, protein, nonfat solids and total solids are highly and positively correlated with milk yield. Under selection programs that emphasize milk yield, fat and protein yields also increase. However, the percentages of fat and protein in the total composition decrease.
The concept of milk component yield versus milk composition can be illustrated by comparing different bulk tank production averages with similar protein composition. If the tank average increases from 65 pounds to 70 pounds while protein composition remains constant at 3.1 percent, an additional 0.16 pounds of protein is produced per cow per day. However, if the percentage of protein increases from 3.1 to 3.2 percent while the bulk tank average production remains at 65 pounds, protein production (yield) increases by only 0.07 pounds per cow per day.
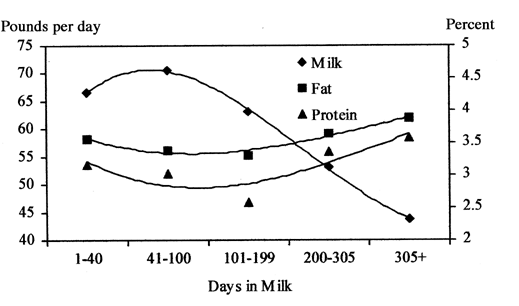
Stage of Lactation: The concentration of milk fat and protein is highest in early and late lactation and lowest during peak milk production through mid-lactation (Fig. 1). Normally, an increase in milk yield is followed by a decrease in the percentages of milk fat and protein while the yields of these constituents remain unchanged or increase.

Disease: Although other diseases can affect milk component content and distribution, mastitis has been the predominate disease studied. Table 2 shows the compositional changes in milk constituents associated with elevated somatic cell counts (a measure of severity of the disease). Mastitis results in a reduction in fat and casein content and an increase in whey content of milk. These changes in the milk proteins, in conjunction with alterations in lactose, mineral content and milk pH, result in lower cheese yields and altered manufacturing properties. Milk from cows with elevated somatic cell counts (greater than 500,000 somatic cells/ml) has longer coagulation time and forms weaker curds than milk from cows with lower somatic cell counts.
| Table 2. Change in milk constituents associated with elevated somatic cell counts. | |||
| Constituent | Normal Milk% | High SCC Milk% | Percent of Normal |
| Milk nonfat solids | 8.9 | 8.8 | 99 |
| Fat | 3.5 | 3.2 | 91 |
| Lactose | 4.9 | 4.4 | 90 |
| Total protein | 3.61 | 3.56 | 99 |
| Total casein | 2.8 | 2.3 | 82 |
| Whey protein | 0.8 | 1.3 | 162 |
| Sodium | 0.057 | 0.105 | 184 |
| Chloride | 0.091 | 0.147 | 161 |
| Potassium | 0.173 | 0.157 | 91 |
| Calcium | 0.12 | 0.04 | 33 |
Adapted from Harmon, 1994. J. Dairy Science 77:2103.
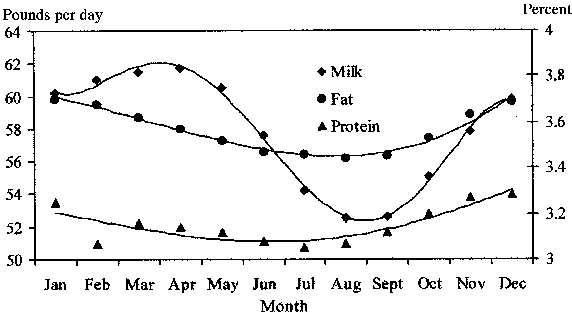
Season: Milk fat and protein percentages are highest during the fall and winter and lowest during the spring and summer (Fig. 2). This variation is related to changes in both the types of feed available and climatic conditions. Lush spring pastures low in fiber depress milkfat. Hot weather and high humidity decrease dry matter intake and increase feed sorting, resulting in lower forage and fiber intake.

Age (Parity): While milk fat content remains relatively constant, milk protein content gradually decreases with advancing age. A survey of Holstein DHIA (Dairy Herd Improvement Association) lactation records indicates that milk protein content typically decreases 0.10 to 0.15 units over a period of five or more lactations or approximately 0.02 to 0.05 units per lactation.
Summary
Many factors besides nutrition management can influence milk composition. This is an important point to remember when evaluating the potential to improve a herd's milk composition and component yields. Certainly, genetics plays an important role, but changes here are slow. Producers who pay attention to detail, keep disease to a minimum and adjust their management program as the seasons dictate will be in the best position to take advantage of nutrition management changes to alter milk composition and improve their bottom line.
To find more resources for your business, home, or family, visit the College of Agricultural, Consumer and Environmental Sciences on the World Wide Web at pubs.nmsu.edu
Contents of publications may be freely reproduced for educational purposes. All other rights reserved. For permission to use publications for other purposes, contact pubs@nmsu.edu or the authors listed on the publication.
New Mexico State University is an equal opportunity/affirmative action employer and educator. NMSU and the U.S. Department of Agriculture cooperating.
February 2001, Las Cruces, New Mexico


