Circular 691
Robert Grassberger and Jay Lillywhite
College of Agricultural, Consumer and Environmental Sciences, New Mexico State University
Authors: Respectively, Professor Emeritus, Organization, Information & Learning Sciences, University of New Mexico; and Professor/Department Head, Department of Agricultural Economics and Agricultural Business, New Mexico State University. (Print friendly PDF)
Introduction
State and local governments are continuously exploring opportunities and implementing new programs to positively impact economic development, such as incentives and infrastructure for businesses, workforce development, and marketing campaigns to attract vacationers. New Mexico is no exception. The state has explored, implemented, or supported a variety of economic development programs to improve the state’s economy. These programs include programs to attract and retain film production, promote space exploration, and grow new businesses around the state.

©Arne9001 | Dreamstime.com
An economic development strategy implemented by many states, but yet to be explored or implemented on a statewide basis in New Mexico, is a program to attract retirees to the state. Retirees can boost demand for various goods and services within the economy, including housing, healthcare, and hospitality (e.g., restaurants). In addition to stimulating economic growth through increased demand for these services, retiree purchases of goods and services provide increased government revenue through payment of various taxes. Further, attracting retirees who are well-educated has the potential of bringing business expertise and new startup companies.
While popular as measured by the number of states participating in retiree marketing programs and/or incentives, broad evidence of their success has not been reported in the literature, and in fact some evidence exists to suggest such programs may not be successful. For example, a recent study exploring the impacts of state tax breaks for seniors enacted over the last four decades suggested that such programs have had zero impact on senior migration patterns. According to the study authors, “Our results are overwhelming in their failure to reveal any consistent effect of state income tax breaks on elderly interstate migration” (Conway and Rork, 2012, p. 315).
The research described in this report provides an initial estimate of the potential fiscal impacts of a New Mexico retiree attraction program. Specifically, the analysis examines potential fiscal returns in the form of various taxes, including gross receipts, property, personal income, and excise taxes. Potential costs of retirees to state and local governments are also explored. The results provide important insights to economic development stakeholders relative to potential benefits of embarking on a campaign to attract retirees.
Potential Retiree Market
According the U.S. Census Bureau, in 2016, 34.8% of the U.S. population was over 50 years of age (Figure 1). There were 80.12 million active retirees and pre-retirees (between the ages of 50 and 70), accounting for 24.4% of the U.S. population (U.S. Census Bureau, 2016) and 46.39 million1 households (U.S. Census Bureau, 2017). While the magnitude of the retiree market is large, it is unclear how many retirees may consider moving to New Mexico. Most people, retired or not, are tied to place. Individuals tend to live the majority of their lives in one geographic region. For retirees, that place may be where their friends, relatives, and grandchildren live, and the social aspects of their current place are far more compelling than the promise of skiing in the morning and golfing in the afternoon.
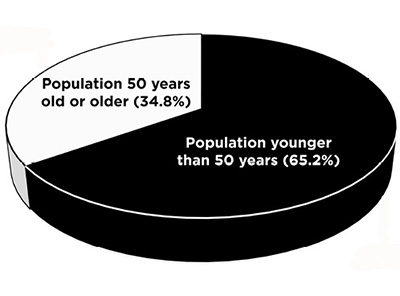
Figure 1. U.S. population by age (source: U.S. Census Bureau).
Further, although those over the age of 50 control more than an estimated 70% of U.S. wealth (Tama-Rutigliano, 2017), that wealth is not evenly distributed. To relocate or to buy a second residence requires money that the vast majority of this group just doesn’t have.
Hence, the target group of those with the capacity to relocate requires both a willingness to move and affluence (financial capacity). According to an Ipsos/USA TODAY survey (Davidson, 2017), 33% of respondents indicated they intend to relocate upon retirement, but only 42% of that 33% indicated that they would consider moving to a different state. Thus, just less than 14% said they would move to another state at retirement. Migration data from the U.S. Census Bureau show that, for those over 60 years of age, historically somewhere between 3 and 4% have moved to another state (Conway and Rork, 2012, p. 313).
But this pool is further slimmed because not everyone who can move is open to relocating to New Mexico. As David Wilson, a marketing consultant who has been working to attract retirees to Las Cruces, stated in a presentation in Albuquerque, “Tree people want to retire to where there are trees,” meaning that those who live in heavily forested areas are unlikely candidates for relocation to the desert Southwest (Wilson, 2018). The best candidates, according to Wilson, are those from the Midwest who seek to escape the cold winters, and those from states surrounding New Mexico who seek more moderate climates, lower population densities, and overall cost of living decreases. Additionally, many affluent Mexicans are also considering relocating to New Mexico. Nevertheless, even 1% of the 46.39 million households aged 50 to 70 still equates to 463,900 households who might consider relocating and retiring in New Mexico2.
Fiscal impact
This fiscal impact analysis looks at the incurred costs to the state as well as the potential tax revenue streams derived from retirees who move into the state. The approached used in the analysis seeks to answer the question, “If the state were to invest a certain dollar amount in a campaign to attract retirees, how long would it take to recuperate those investment dollars?” Therefore, the results of this analysis are presented as the number of new retiree households brought to New Mexico and the number of years these households must remain as in-state residents to break even on the dollars invested by the state in attracting these retirees. While this analysis focuses solely on fiscal impacts, future analyses will assess economic impacts.
The analysis requires a number of simplifying assumptions. These assumptions include:
-
- The attracted retirees and pre-retirees vary in age between 55 and 70 years old. The average age of the head of household is 63. From the Social Security Actuary tables, the remaining statistical life of a 63-year-old is 20.7 years.
- Attracted retirees are assumed to be in good physical health.
- The average earnings of these new retiree households are assumed to be $70,000 annually, where earnings are defined as a mix of Social Security income, pension income, and/or investments. According to the U.S. Census Bureau (2018), the median household income in New Mexico in 2016 was $45,674; hence, a household with an annual income of $70,000 is a relatively affluent household by comparison.
- Retiree households are comprised of two people. This is based on Census data that show households where the householder is age 55+ contain on average 2.1 adults (U.S. Census Bureau, 2016).
- The two people in the household file income tax as married, filing jointly. The federal standard deduction for a household of two is $24,000 under the new tax law (Public Law 115-97). Thus, adjusted gross income (AGI) equates to $46,000 annually.
- The attracted retirees and pre-retirees vary in age between 55 and 70 years old. The average age of the head of household is 63. From the Social Security Actuary tables, the remaining statistical life of a 63-year-old is 20.7 years.
- Consumption patterns and the associated spending are based on the Consumer Expenditure Survey for those making $70,000 or more (U.S. Department of Labor, Bureau of Labor Statistics, 2016).
- The median average price of a home in New Mexico in 2016 was $161,600 (U.S. Census Bureau, 2018). Since the assumed retiree earnings of $70,000 annually are 53% greater than the median annual household income in New Mexico, the purchase price for a home was assumed to be higher as well, or $200,000 in this analysis3.

©Monkey Business Images | Dreamstime.com
Tax Revenue Streams from Attracted Retirees
Four sources of tax revenue are considered in the analysis: gross receipts tax (GRT), personal income tax (PIT), property tax, and excise tax. All analysis is based at the household level.
Gross Receipts Tax
In lieu of sales tax, New Mexico has gross receipts tax (GRT). The gross receipts tax is a tax on individuals conducting business in New Mexico. While GRT is charged to businesses, it is generally passed on to the consumer. GRT is not charged on all goods and services. Examples of exemptions include foods purchased at grocery stores (not restaurant-prepared foods), prescription drugs, premiums paid for insurance, and interest paid on loans. Until recently, goods purchased through internet sales companies that had no physical presence in New Mexico were also not taxed4. Using the Consumer Expenditure Survey (U.S. Department of Labor, Bureau of Labor Statistics, 2016) as a proxy for consumption by the “income before tax” category, an estimate of taxable, in-state consumption was derived. For gross incomes of $70,000 or more annually, an estimated 57.9% of goods and services purchases are subject to GRT5.
The current statewide rate for GRT is 5.125%. However, local governments collect additional taxes that average 2.22% and can be as high as 3.56% (New Mexico Taxation and Revenue, 2018a). Using the cited rates for the second half of 2017, and weighting each local rate by the population of the local geography, an average state rate of 7.35% was derived.
Thus, consumption subject to GRT was estimated at $40,503 ($70,000 × 57.9%), yielding $2,977 ($40,503 × 7.35%) in annual revenues from gross receipts.
Property Tax
Property taxes in New Mexico are some of the lowest in the U.S. New Mexico property taxes are based on an assessed value (one-third of market value) multiplied by the property tax (millage) rate. Tax rates vary by location and are the sum of several tax rates applied by several different jurisdictions. A specific property might be subject to city taxes, county taxes, school district taxes, etc. (New Mexico Department of Finance and Administration, 2018). There is substantial variance across the state in both appraised values of similar-sized properties as well as the mill rates levied. A retiree moving to Santa Fe or Los Alamos would expect to pay substantially more property tax than a retiree moving to Raton or Clovis6.
Property taxes go primarily to local governments7. The mill levy that goes to the state is quite small—generally between 3 and 9% of the total property taxes levied. For the most part, counties use property taxes for general fund operations. Municipalities, who rely more on GRT for general fund operations, use property taxes to finance bonds that are used to pay for such things as roads, libraries, and multigenerational centers. Property taxes also finance school construction, community colleges, hospitals, and flood control.
The effective property tax rate used in this analysis was calculated as the ratio of the median real estate tax payment and the median home price for New Mexico. In 2016, the median house price for an owner-occupied dwelling was $161,600 (U.S. Census Bureau, 2018). The median real estate tax paid in 2016 was $1,232 (Smart Asset, 2018). The effective tax rate using these two figures is 0.76%.
If retirees purchase a house valued at $200,000, they can expect to pay an estimated $1,525 annually. That said, as indicated in a survey of subscribers conducted for Where to Retire magazine (Readex Research, 2017), it is likely that many of those choosing to relocate will buy substantially higher-priced houses in areas. Metropolitan areas of the state also tend to have higher property tax rates. Consequently, an estimate of $1,525 from property taxes will depend on the housing and geographical choices relocating retirees make.
Personal Income Tax
The state of New Mexico taxes all forms of retirement income, including Social Security. Social Security retirement benefits are taxable, but they may also be partially exempt from tax. The exemption is up to $2,500 for taxpayers under the age of 65 (New Mexico Taxation and Revenue, 2018b, pp. 23–24). Individuals over age 65 may be exempt from income up to $8,000 annually depending on their adjusted gross income and filing status (New Mexico Taxation and Revenue, 2018c, p. 5A). This exemption can be claimed on all retirement income including Social Security benefits, pension income, and retirement account income. Income in excess of the exemption is taxed at New Mexico’s income tax rates as shown in Table 1.
|
Table 1. New Mexico Income Tax Rates |
|
|
Adjusted Gross Income |
Tax Rate |
|
$0–$5,500 |
1.7% |
|
$5,500–$11,000 |
3.2% |
|
$11,000–$16,000 |
4.7% |
|
$16,000+ |
4.9% |
As defined earlier, this analysis assumes a household size of two persons filing jointly as married and taking the standard federal deduction8. Further, it assumes that adjusted gross income (AGI) was $46,000 per annum with a head of household who is 63 years of age on average. Under the New Mexico low- and middle-income tax exemption, this household could qualify for up to a $2,500 deduction. However, the deduction is tiered based on AGI. In this case, the deduction is an estimated $1,800 (New Mexico Taxation and Revenue, 2018b, p. 24).
There may also be medical care expense deductions, especially as retirees living in these households get older (New Mexico Taxation and Revenue, 2018c, pp. 25–27). Eligible expenses include premiums paid under Medicare Part B, amounts paid for qualified long-term care insurance, and unreimbursed insurance premiums or co-payments. According to the PIT-1 instructions, deductions may be taken 1) only if the provider is certified or licensed in New Mexico and 2) these expenses are not claimed on federal Schedule A. The assumption for this analysis is that all expenses would be with an in-state provider and that, with the higher deductions allowed under the new federal tax law, there would be no Schedule A filed. The Consumer Expenditure Survey shows medical costs expenditures cross tabulated by both age and income. Medical expenses were first converted to the percentage of gross income for those over 65 and who make over $70,000 per year. This percentage was then applied to the $70,000 annual earnings of the household assumed in this analysis. This equated to $4,331; however, only 15% of it is allowable as a deduction (New Mexico Taxation and Revenue, 2018c, pp. 25–27), which equals $650.
There are also additional exemptions and credits for those over 65 who incur unreimbursed medical expenses when unreimbursed expenses exceed $28,000. Since this analysis assumes that these affluent retirees are also in good health, no exemption or credit was included.
Clearly, the income calculations above are a gross simplification because they require generalizations about the distribution of the ages of those who come to New Mexico to retire, the structure of their earnings, and the ages of each household member. And while it is possible to model these factors, doing so increases the complexity and adds little to improving the projections. Indeed, statistically modeling the ages of those who might be attracted retirees amounts to making additional assumptions about the assumptions already made.
Excise and Insurance Premium Taxes
New Mexico imposes an excise tax on the consumption of tobacco, alcohol, and gasoline. Ultimately, incurring these taxes is based on the use of these products9. Rough estimates of quantity used can be derived by consulting the Consumer Expenditure Survey (CES). In the CES, dollar values for spending on tobacco, alcohol, and gasoline are reported. Since the data are from 2016, dividing the amount spent by the cost of that commodity in 2016 yields the number of units purchased.
For gasoline, the CES reports average annual spending of $2,785. Because the CES is national data, using a national average price per gallon is appropriate. For 2016, the average price per gallon was $2.16 (Statista, 2018). This equates to 1,289 gallons used by households with annual gross incomes between $70,000 and $99,999. New Mexico imposes excise (and other) taxes of $0.18875 per gallon. On 1,289 gallons, the consumer would pay $243 in taxes annually.
Spending on tobacco was $370 annually according to the CES. Using cigarettes as a proxy at $5.98 per pack yields an average consumption of 65 packs per year per household.10 The New Mexico excise tax for cigarettes is $1.66 per pack, for a total tax of $371 per year.
Estimating the consumption of alcohol is more difficult because New Mexico taxes beer, wine, and hard liquor differently. Converted to per gallon, the excise tax for beer is $0.40, for wine $1.70, and for spirits $6.10. The CES shows spending on alcohol of $965 annually. Sales of liquor in the U.S. reveal 50% for beer, 19.4% for wine, and 30.6% for hard liquor. Applying these ratios provides the dollars spent in each category. Finally, prices in each of the categories are hugely variant, but mean prices were developed (per gallon) based on an internet search. In the end, the excise taxes generated from consumption of alcohol results in a rather small $59 per household.
New Mexico also charges an insurance premium tax on vehicles, home, life, and healthcare insurance. There is a 3.003% tax on all insurance premiums. Health insurance is charged the 3.003% tax plus an additional surtax of 1% (New Mexico Office of Superintendent of Insurance, 2018). The CES was used to estimate household spending on these various insurance products. Premium taxes were estimated at $156 per year.
Estimated Taxes Generated from a Representative, Attracted Retiree Household
The tax revenue for an attracted retiree household is presented below. As shown in Table 2, in the first full year of residence the new household generates an estimated $7,465 in taxes. Perhaps most notable are the taxes from consumption of goods and services within the state. At just under 40% of the total taxes accrued, gross receipts illustrates why attracting retirees has been equated to having “permanent tourists” who create economic impact through their spending. Much like tourists, retirees typically have substantial impacts in the Accommodation and Food Services as well as the Retail Trade sectors.
|
Table 2. Estimated Taxes from an Attracted Retiree |
||
|
Source |
Year 1 |
Percent of total |
|
Income Tax |
$2,134 |
28.6% |
|
Property Tax |
$1,525 |
20.4% |
|
Gross Receipts Tax |
$2,977 |
39.9% |
|
Excise Taxes |
||
|
Alcohol |
$59 |
0.8% |
|
Cigarettes |
$371 |
5.0% |
|
Gasoline |
$243 |
3.3% |
|
Insurance premium tax |
$156 |
2.1% |
|
Total taxes/household |
$7,465 |
|
Distribution of Tax Revenues Between State and Local Governments
Although the estimated tax revenues shown above are aggregated, how they are apportioned between state and local entities differs based on the source of the revenue. Constructed from data from the 2012 Census of Governments (U.S. Census Bureau, 2012)11, Table 3 illustrates how New Mexico tax revenues are allocated between state and local governments. While 67.7% of all taxes accrue to the state, stratification by source indicates some revenues are predominantly accrued to local governments—of particular note is property tax at 95.8% to local government.
|
Table 3. New Mexico Tax Revenue Allocation Between State and Local Governments |
||
|
New Mexico |
||
|
Revenue from Own Sources |
State Government |
Local Government |
|
——percent of total—— |
||
|
Taxes |
67.7% |
32.3% |
|
Property |
4.2% |
95.8% |
|
Sales and gross receipts |
71.9% |
28.1% |
|
General sales |
68.0% |
32.0% |
|
Selective sales |
86.9% |
13.1% |
|
Motor fuel |
100.0% |
— |
|
Alcoholic beverages |
97.3% |
2.7% |
|
Tobacco products |
100.0% |
— |
|
Other selective sales |
87.4% |
12.6% |
|
Individual income |
100.0% |
— |
|
Corporate income |
100.0% |
— |
|
Motor vehicle license |
92.5% |
7.5% |
|
All other taxes |
95.1% |
4.9% |
As indicated earlier, state, county, and municipal governments support different services. Subsequently, each of these entities must have sufficient revenues to cover the incurred costs of delivering these services.
Costs of Retiree Households to State and Local Governments
State and local governments incur costs when retirees move to New Mexico. Retirees will use highways, libraries, hospitals, public safety (fire and police), and perhaps some services offered through higher education institutions. However, the costs of some services like public welfare are borne primarily by local governments12. Thus, a substantial influx of retiree households into a community could stress the current service capacity. Other services provided through local governments include water, sewer, and trash collection, but these services are usually enterprise funds and so would be covered in the fees paid by the newly added retiree households.
Retirees are unlikely to use the K–12 school system13, be recipients of Medicaid, or be incarcerated in the prison system. While they may participate in courses offered through the higher education system, the costs per capita would again be small. Retirees will use state-maintained roads, but these costs are covered in gasoline excise taxes.
Related to the costs of retirees to local governments, an oft-mentioned concern about retirees is that they will not support school bonds. Dubbed the “Gray Peril Hypothesis,” researchers have found little support for this contention (Button and Rosenbaum, 1990). Indeed, it appears that affluent retirees, who also tend to be well-educated, are likely to advocate for local schools.
The cost of adding retiree households is likely to be marginal to the state. The greatest risk in terms of incurred costs is likely to be to local governments. However, this is a function of just how many retiree households are located in a particular community as well as the size of the community. For example, Silver City, with a current population of just under 10,000 residents, is likely to feel an impact from an influx of 50 new households. Larger communities like Las Cruces or Rio Rancho might more readily absorb the increased demand for services of an additional 50 households.
Ultimately, the demand for services and the increased costs to deliver those services are a function of the total number of retiree households who relocate to New Mexico and where they choose to reside. Based on retiree preferences for higher-quality healthcare and proximity to continuing education (e.g., museums, colleges, concerts, and theater), it is likely that the lion’s share of retirees would choose to relocate in or near one of the state’s larger metropolitan areas14.
Estimated Tax Revenues Over Time from a Retiree Household
Unlike tourists, retiree impacts continue for the duration of the time they reside in New Mexico. According to Social Security Actuary Tables (U.S. Social Security Administration, 2018a), a 63-year-old will average another 20.7 years of life15. While this is not a guarantee that these retirees will choose to always live in New Mexico, it does provide an indication that they will likely reside here more than a few years.
As stated at the start of this report, the objective of this analysis is to discover what level of investment the state could make in a retiree attraction campaign and when it could expect to recover those investment dollars. In this regard, this analysis is more akin to a break-even analysis than a fiscal impact study.
Because those who relocate are expected to be here for multiple years, a framework showing cash flow for future years was developed. The analysis assumes a household moves in during year one and lives here for five years or more. To assume that no additional retiree attraction would occur from a one-time state attraction campaign is perhaps myopic. Nevertheless, this somewhat unrealistic assumption further adds conservativeness to this analysis.
Unlike a standard break-even analysis, this cash flow considers the time value of money. First, it is assumed that over time the cost of goods and services consumed would rise. To inflate the cost of purchased goods and services, which then impacts GRT, the Consumer Price Index (CPI) of 2.2% was applied. Second, housing prices have been rising steadily, and rising housing prices are reflected in property taxes. According to the St. Louis Federal Reserve Bank’s Housing Price Index (2018) for New Mexico, housing prices between January 2013 and October 2017 rose at an average of 2.25% per year. Further, it is expected that household income and earnings will also increase over time. While the CPI-W (Consumer Price Index for Urban Wage Earners and Clerical Workers) could serve as a proxy, the Social Security Cost of Living Allowance (COLA) was used instead. While it is likely that household earnings from pensions and investments would exceed this rate, given that 30% or more of the earnings of this cohort are likely to be from Social Security, this conservative rate is more appropriate. The Social Security COLA was published at 2% for 2018 (U.S. Social Security Administration, 2018b).
Table 4 shows the projected revenue stream from a representative retiree household over a five-year horizon16. This assumes that the retirees relocate and stay for many years (or are replaced by other retirees should they move).
|
Table 4. Projected Five-year Tax Revenue Stream from an Attracted Retiree Household |
|||||
|
Source |
Year 1 |
Year 2 |
Year 3 |
Year 4 |
Year 5 |
|
Income Tax |
$2,134 |
$2,177 |
$2,220 |
$2,356 |
$2,403 |
|
Property Tax |
$1,525 |
$1,559 |
$1,594 |
$1,630 |
$1,667 |
|
Gross Receipts Tax |
$2,977 |
$3,042 |
$3,109 |
$3,178 |
$3,248 |
|
Excise and Other Taxes |
|||||
|
Alcohol excise |
$59 |
$60 |
$61 |
$63 |
$64 |
|
Tobacco excise |
$371 |
$379 |
$387 |
$396 |
$404 |
|
Gasoline excise |
$243 |
$249 |
$254 |
$260 |
$265 |
|
Insurance premium tax |
$156 |
$160 |
$163 |
$167 |
$171 |
|
Total taxes/household |
$7,465 |
$7,626 |
$7,790 |
$8,049 |
$8,222 |
Finally, once generated, the entire stream must be discounted back to present value to allow comparison with proposed investments made by the state to attract retirees. The discount rate used was from 10-year T-Notes since these instruments are generally perceived as relatively risk-free when considering longer-term investments. The rate used in this analysis was 2.9% (U.S. Department of the Treasury, 2018). Illustrated in Table 5 are the per-household projected tax revenues discounted to present value based on the number of years the retiree resides in New Mexico. For example, in present value dollars, a retiree household here for just five years would generate almost $36,000 in new taxes.
|
Table 5. Discounted Tax Revenues by Number of Years in State |
|
|
Years in state |
Revenues generated* |
|
5 |
$35,912 |
|
10 |
$70,779 |
|
15 |
$104,398 |
|
20 |
$136,814 |
|
25 |
$161,911 |
|
*Discounted to present value |
|
Payback Period on State Investment
Table 6 shows the number of households that must move to New Mexico and the number of years these households must reside in the state to recapture various levels of funding used to attract retirees to the state. As noted previously, the assumption here is that the state will make a one-time investment that attracts retirees to New Mexico during the first year of the program—with no additional relocations for future years. While this seems improbable because there is likely to be impact for many years following a well-constructed campaign, the results shown below indicate the magnitude of retiree households that would be needed to cover the program investment17. For example, if the state were to provide $1 million toward developing a retiree attraction program, recapturing (breaking even) these funds from the taxes paid by retirees would require 27.8 new retiree households who stay in the state for a minimum of five years. If the retirees stay for 10 years, then 14.1 households must move in during the first year. For those making funding decisions, what Table 6 more pointedly asks is, “Do you believe that if the state made a $1 million investment that we would be able to attract 28 (or more) retiree households who would reside in New Mexico for five years or more?”
|
Table 6. Number of Retiree Households Required to |
|||||
|
Number of years residing in New Mexico |
|||||
|
Investment |
5 |
10 |
15 |
20 |
25 |
|
——Number of attracted retiree households—— |
|||||
|
$1,000,000 |
27.8 |
14.1 |
9.6 |
7.3 |
6.2 |
|
$3,000,000 |
83.5 |
42.4 |
28.7 |
21.9 |
18.5 |
|
$5,000,000 |
139.2 |
70.6 |
47.9 |
36.5 |
30.9 |
Future Research
This analysis serves as a preliminary evaluation of the fiscal impacts of attracting retirees to New Mexico. However, there are several key issues that are not addressed here that call for additional research to ensure that decision makers have the best possible information.
Future research could be conducted to verify assumptions made in the analysis and to remove some of the limitations presented below. Such research could include interviews, focus groups, and surveys of individuals in the targeted age ranges to better understand their intentions regarding retirement and factors that may influence their decision to retire in a particular location.
Marketing and Market Assessment
While this analysis mentions various levels of investment, it does not detail how the state might structure its investment to attract retirees. Funds could be allocated to advertise directly to the pool of retirees who might consider relocation. This might be done through targeted advertising in publications such as Where to Retire magazine or through social media, for example. More specifics and lessons learned might be garnered from experts in advertising and marketing who have worked on retiree attraction campaigns. Additional venues might include discussions with public and private developers in states that have long-term retirement attraction strategies, or meeting with attendees at the annual meeting of the American Association of Retirement Communities (AARC; https://the-aarc.org). While the New Mexico True campaign has been successful in promoting the state, it is currently not narrowly targeted enough to reach the desired target market of retirees who would consider relocation. Preliminary research also indicates that the state needs to elevate its profile with the desired retiree pool—many seem to be unaware of New Mexico and what it might offer.
As an alternative to a “push” advertising campaign, the state might instead opt to offer cash incentives to those willing to relocate to New Mexico. While this initially may seem an odd approach, it could be argued that if there is sufficient fiscal and economic impact that the state could solicit a very select group of retirees and incentivize them with the expectation that the monies spent will be recuperated through retiree-paid taxes and spending. Perhaps a claw back provision might be required to ensure these recruited retirees stay in the state for five years or more.
Another area requiring exploration is Certified Retirement Community (CRC) programs. These programs are often used to promote more rural communities. Currently, there are at least five states18 with CRC programs. The programs are administered by a variety of agencies depending on the state. However, the objective is to provide potential retirees with an overview of the community that includes information on the items most important to retirees (e.g., hospitals and medical care, crime rates, cost of living, etc.). While CRC programs seem logical, there is no published research on their effectiveness; that is, does certification result in sufficient increases in retiree population to warrant investing in this strategy? Additional research begins with asking if CRC programs work and if they are successful, then how should CRC programs be designed to get the best return for participating communities?

©Wavebreakmedia Ltd | Dreamstime.com
Feasibility Assessment and Net Benefits
While this preliminary analysis provides some indication of retiree impact at the household level, it does so with rather broad brush strokes. A more refined analysis of feasibility needs to be conducted to provide more detailed information to decision makers. Projections should be made not only of how many new retiree households would be attracted but also with specific attention to when those households will arrive in the state. These projections should be based on the learning that comes from the market research.
In addition to forecasting the gross number of retirees attracted to the state, projections must also be made about where these retirees will choose to relocate. As indicated earlier, much of the impact of adding retiree households will be borne by local governments. Large municipalities may have more capacity to absorb an influx of new households, while smaller communities may need to add to existing services. Based on where the retirees choose to relocate, an assessment of feasibility needs to determine if the increased costs for services are offset through increased tax revenues at the local level.
Further, the longer-term impacts of retirees as an economic development strategy need to be included in the feasibility assessment. The nature of aging is that needs, particularly for healthcare, change over time. Thus, costs for public services may rise as the active retiree household changes to an elderly, less active household. An inflow of retirees may also drive up property and housing costs and make it more difficult for young families to buy homes or even stay in the area.
Beyond assessing feasibility and fiscal impact, the economic impact of attracted retirees also needs to be addressed. Research in other states has found a substantial economic impact as retirees move into an area and build or buy houses, and as new infrastructure emerges to support this community.
Likewise, the impact of potentially losing existing retirees to other states calls for additional research. New Mexico is home to retirees from state and local government, the National Laboratories, large public companies, the military, and the state university system. Retaining these retirees is important not only fiscally but also in terms of their expertise. Research needs to be conducted to understand just how many retirees leave the state as well as what it would take to keep them here.
Because New Mexico is listed as one of the “10 Least Tax Friendly” states for retirees (Kiplinger, 2017), additional research should be conducted on the impacts of reducing or eliminating taxes on retirement. However, it should be noted that while tax friendliness is often listed as a top criteria on “best places to retire” lists, other research has shown that tax policy changes have done nothing to attract retirees (Conway and Rork, 2012).
Perhaps less obvious is that once here, retirees don’t add to the population by having children. As an economic development strategy, retirees must continuously be replaced. Recruiting retirees may elevate the average age of a community and reduce the ratio of the work age population. In small towns, population growth might even become negative as deaths exceed births.
On the other hand, affluent retirees tend to be well-educated and healthy, so current trends indicate retirees may instead start new companies, return to paid work, or do volunteer work. Consequently, retirees may grow the financial, social, and community capital in the local area.
Limitations and Caveats
This analysis was developed to assist those considering a retirement attraction strategy in their decision-making process. The assumptions are purposely conservative and are intended to underestimate potential revenue streams to the state.
The analysis as presented has a number of simplifying assumptions and limitations. Key assumptions and limitations that should be noted include:
- Perhaps the single most important assumption is that a campaign targeting retirees would be effective. Given the sheer size of the potential pool, and the known successes of the recent efforts for some parts of the state and in other states, it seems that the state should be able to attract a substantial number of relocating retirees or pre-retirees. That said, relocated retirees are at the core of this analysis. Should the campaign fail, the ability to recover the cost of a retiree attraction program would be mostly lost.
- This analysis shows retirees relocating to New Mexico in the first year with no additional relocations in the years that follow. This is highly unlikely, especially if a multi-year attraction campaign were initiated.
- Not all of these revenues accrue to the state. Roughly 30% of GRT is returned to local governments and virtually all of property taxes go back to communities to support schools, hospitals, police and fire departments, etc.
- While the Consumer Expenditure Survey (CES) was used as a representation of consumption patterns, variance will exist in spending between households. For example, it may be found that active retirees travel more often and thus spend more money out of state than assumed here. Further, the consumption patterns used in this analysis were based on an income cohort ($70,000 or more). Consumption patterns also change as people age. As expected, as aging increases so does the consumption of healthcare and medical spending.
- This analysis assumes that those who will retire here will live here all year. For retirees who reside in the state part-time, the estimated tax revenues will be reduced since GRT, excise, and income taxes will decrease.
- Rates for GRT and property taxes are directly related to geographic location. By employing statewide averages, this analysis likely underestimates tax revenues if retirees move to more populous areas and overestimates revenues should they choose rural areas of the state.
- This analysis assumes those attracted are relatively affluent, with annual earnings averaging $70,000. Anecdotal evidence indicates that earnings may be well in excess of this assumption. If retiree earnings were to be less, this would result in lower revenues than projected. However, retiree mobility tends to be correlated with affluence, and lower-earning retirees are less likely to relocate.
- In addition to annual earnings, the number of people residing in a household as well as the age of residents and the composition of their earnings all influence the income taxes projected. There may also be some deductions and exemptions for medical expenses that have not been considered here. Variance from the assumptions made herein will influence the income tax revenues available to the state.
- The length of time retirees choose to live in New Mexico impacts this analysis. Statistical life tables were used to show the possibility of how long retirees might be here. However, especially given the assumption of affluence, there is nothing to say that attracted retirees will stay in New Mexico for more than a few years. A case could be made that those leaving would be “backfilled” with new retirees, but this is not a certainty. Retention of retirees is a multifaceted issue that is influenced by such things as crime rates, developed relationships, and proximity to family, to name but a few.
- This analysis looks only at inmigrating retirees and does not account for any retirees lost to outmigration. Retention of existing retirees is an important issue and should be addressed in future research.
Acknowledgments
The authors wish to thank those who reviewed this research. Reviewers included James Libbin, NMSU Professor Emeritus, Agricultural Economics and Agricultural Business, and former Interim Dean of NMSU’s College of Agricultural, Consumer and Environmental Sciences; James Peach, Professor Emeritus and Regents Professor, NMSU College of Business; and Brian McDonald, retired Director of UNM’s Bureau of Business and Economic Research and former President of the New Mexico Tax Research Institute.
References
Button, J., and W. Rosenbaum. 1990. Gray power, gray peril, or gray myth?: The political impact of the aging in local sunbelt politics. Social Science Quarterly, 71, 25–38.
Centers for Disease Control and Prevention. 2018. Map of current cigarette use among adults [Online]. https://www.cdc.gov/statesystem/cigaretteuseadult.html
Conway, K.S., and J.C. Rork. 2012. No country for old men (or women)—Do state tax policies drive away the elderly? [Online]. National Tax Journal, 65, 313–356. https://www.ntanet.org/NTJ/65/2/ntj-v65n02p313-56-country-for-old-men.pdf
Davidson, P. 2017, October 17. Who needs Florida? Here’s where people approaching retirement plan to live [Online]. USA Today. https://www.usatoday.com/story/money/2017/10/17/who-needs-florida-heres-where-people-approaching-retirement-plan-live/741040001/
Federal Reserve Bank of St. Louis. 2018. All-transactions house price index for New Mexico [Online]. https://fred.stlouisfed.org/series/NMSTHPI
Finance New Mexico. 2018, April 22. Internet purchases challenge local budgets [Online]. https://financenewmexico.org/articles/general-business-advice/internet-purchases-challenge-local-budgets/
Kiplinger. 2017. State-by-state guide to taxes on retirees [Online]. https://www.kiplinger.com/tool/retirement/T055-S001-state-by-state-guide-to-taxes-on-retirees/index.php
New Mexico Department of Finance and Administration. 2018. Certificates of property tax rates by county, 2018 [Online]. https://www.nmdfa.state.nm.us/Certificate_of_Property_Tax.aspx
New Mexico Office of Superintendent of Insurance. 2018. Financial audit bureau. https://www.osi.state.nm.us/FinancialAudit/index.aspx
New Mexico Taxation and Revenue. 2018a. Enactment date tables [Online].https://www.tax.newmexico.gov/Government/enactment-date-tables.aspx
New Mexico Taxation and Revenue. 2018b. 2017 PIT-1 preparation instructions [Online]. https://realfile.tax.newmexico.gov/2017pit-1-ins.pdf
New Mexico Taxation and Revenue. 2018c. Instructions for 2017 PIT-ADJ: Schedule of additions, deductions, and exemptions [Online].https://www.tax.newmexico.gov/Individuals/personal-income-tax-forms.aspx
Public Law 115-97. 2017. Individual tax reform and alternative minimum tax. 115th Congress.
Readex Research. 2017. Subscriber study for Where to Retire magazine [Unpublished].
Smart Asset. 2018. New Mexico property tax calculator [Online].https://smartasset.com/taxes/new-mexico-property-tax-calculator
Statista. 2018. Retail price of regular gasoline in the United States from 1990 to 2017 (in U.S. dollars per gallon) [Online]. https://www.statista.com/statistics/204740/retail-price-of-gasoline-in-the-united-states-since-1990/
Tama-Rutigliano, K. 2017, September 26. Five things you need to know about marketing to baby boomers [Online]. Forbes. https://www.forbes.com/sites/forbescommunicationscouncil/2017/09/26/five-things-you-need-to-know-about-marketing-to-baby-boomers/#ddaa8044e55e
U.S. Census Bureau. 2012. Census of governments [Online]. https://www.census.gov/programs-surveys/cog.html
U.S. Census Bureau. 2016. Table AVG1. Average number of people per household, by race and Hispanic origin, marital status, age, and education of householder [Online].https://www.census.gov/data/tables/2016/demo/families/cps-2016.html
U.S. Census Bureau. 2017. Table H2. Households, by type, age of members, region of residence, and age of householder: 2016 [Online]. https://www.census.gov/data/tables/2016/demo/families/cps-2016.html
U.S. Census Bureau. 2018. QuickFacts: New Mexico [Online]. https://www.census.gov/quickfacts/NM
U.S. Department of Labor, Bureau of Labor Statistics. 2016. Table 3243. Consumer units with reference person age 55 to 64 by income before taxes: Average annual expenditures and characteristics, Consumer Expenditure Survey, 2015–2016 [Online]. https://www.bls.gov/cex/2016/CrossTabs/agebyinc/x55to64.PDF
U.S. Department of the Treasury. 2018. Daily Treasury yield curve rates [Online]. https://www.treasury.gov/resource-center/data-chart-center/interest-rates/Pages/TextView.aspx?data=yieldYear&year=2018
U.S. Social Security Administration. 2018a. Actuarial life table [Online]. https://www.ssa.gov/oact/STATS/table4c6.html
U.S. Social Security Administration. 2018b. Cost-of-Living Adjustment (COLA) information for 2018 [Online]. https://www.ssa.gov/news/cola/
Wilson, D. 2018, March 21. Catching the boomer wave: Marketing Las Cruces to retirees [Unpublished]. Presentation to the New Mexico Homebuilders Association.
Footnotes
1Of these households, 65.3% are family households (e.g., married or two people in a relationship). (Back to the top)2This analysis focuses on the attraction of new retirees to the state. Not addressed here is the outmigration of existing retirees from New Mexico. Currently, outmigration exceeds inmigration for a net loss in this cohort. (Back to the top)
3Future analysis should be conducted at a municipal or regional level because a $200,000 home in Deming is quite different from what $200,000 would buy in Santa Fe. Further, property taxes differ by geographic area.(Back to the top)
4This policy is being debated. For example, Amazon currently pays the state portion of GRT but not the portion that goes to local governments. See Finance New Mexico (2018) in the References section of this publication.(Back to the top)
5Food for home, prescription drugs, mortgage and mortgage interest, insurance premiums, taxes (all), and monies paid for pensions and insurance were excluded. Although there are excise taxes on alcohol and tobacco, these are still subject to GRT. An additional 2% was included for purchases outside of New Mexico.(Back to the top)6Those over 65 with household income below $32,000 can apply for a freeze on their home’s assessed value in order to limit annual increases in property taxes. However, those assumed in this analysis exceed this income constraint and would therefore not qualify for this.(Back to the top)7The 2012 Census of Governments shows 95.8% of property taxes in New Mexico go to local governments. (Back to the top)8For 2018, the standard deduction for a two-person household is $24,000 (Public Law 115-97).(Back to the top)9In addition to excise tax, gross receipts taxes are paid on consumption of alcohol and tobacco. (Back to the top)
10To be clear, the CES data are based on a large sample of consumers, most of whom are nonsmokers. However, the data show an average spending on tobacco per household. CDC statistics (Centers for Disease Control) and Prevention, 2018) show that 16.6% of New Mexicans use tobacco. Thus, five of every six households spend nothing on tobacco, while every sixth household would spend substantially more than shown here.(Back to the top)11While the Census of Governments is conducted every five years, the 2017 data had not been released at the time of this writing.(Back to the top)12The per capita costs of providing these services can be determined from the annual budgets that are provided to the Local Government Division (LGD) of the New Mexico Department of Finance and Administration and dividing by the population of those geographies. Local government budgets are not currently available online, but can be obtained by contacting LGD. A sample of three New Mexico communities was calculated to derive a benchmark of the per capita costs of public welfare. The costs for the most recent fiscal year were Clovis ($406), Farmington ($618), and Silver City ($495). Since households are the unit of analysishere, these costs would be doubled.(Back to the top)13Retiree property taxes will pay for schools and school buildings they will not be using.(Back to the top) 14That said, personal safety and security rank very high with retirees. Consequently, some may prefer the lower crime statistics of more rural communities. (Back to the top) 15This is a weighted average of men and women. On average, women live about three years longer than men.(Back to the top) 16A 30-year horizon was developed in the model but is not shown here.(Back to the top) 17This is net new inmigrant retirees.(Back to the top)
18The American Association of Retirement Communities also offers a certification program.(Back to the top)
For further reading
CR-643: Tools for Understanding Economic Change in Communities: Economic Base Analysis and Shift-Share Analysis
https://pubs.nmsu.edu/_circulars/CR643/
CR-651: Rural New Mexico Economic Conditions and Trends
https://pubs.nmsu.edu/_circulars/CR651/
CR-652: Closing Retail Sales Gaps: Boosting the Economic Fortunes of Rural New Mexico Counties
https://pubs.nmsu.edu/_circulars/CR652/

Dr. Jay Lillywhite is an Associate Professor in the Agricultural Economics and Agricultural Business Department at New Mexico State University. He earned his Ph.D. in Agricultural Economics from Purdue University. Dr. Lillywhite's research addresses agribusiness marketing challenges and opportunities.
To find more resources for your business, home, or family, visit the College of Agricultural, Consumer and Environmental Sciences on the World Wide Web at pubs.nmsu.edu.
Contents of publications may be freely reproduced, with an appropriate citation, for educational purposes. All other rights reserved. For permission to use publications for other purposes, contact pubs@nmsu.edu or the authors listed on the publication. New Mexico State University is an equal opportunity/affirmative action employer and educator. NMSU and the U.S. Department of Agriculture cooperating.
December 2018 Las Cruces, NM