Circular 652
Revised by J. Michael Patrick and Don Blayney
College of Agricultural, Consumer and Environmental Sciences, New Mexico State University
Authors: Respectively, Community Resource and Economic Development Specialist and College Professor, Department of Agricultural Economics and Agricultural Business, New Mexico State University. (Print Friendly PDF)
Introduction
The retail sector is an important economic driver in most rural (non-metropolitan) New Mexico counties. This sector accounts for a significant portion (12–30%) of local jobs and personal income and is an important source of tax revenues (gross receipts tax and property tax) that fund county services (e.g., health, education, and public safety).
When residents decide to shop outside their county for retail products, they take sales revenues away from local businesses, thereby limiting their potential for growth and future contributions to the area’s economy. A number of factors determine whether residents shop at home or elsewhere, including satisfaction with the prices, variety, and quality of available retail products. Friendly, knowledgeable, and helpful customer service is also important and can often offset higher prices. Local businesses must compete for the consumer’s dollar. It is in the county’s interest to promote and support efforts that strengthen the competitiveness of local businesses.
© Willjay | Wikimedia Commons
Purpose
This circular examines the potential gains in jobs, personal income, and gross receipts taxes that New Mexico counties might realize by “keeping shoppers at home” and closing the sales gap between actual and potential sales. Practical steps that county leaders and local officials can take to improve the competitiveness of local businesses and encourage residents to shop at home are discussed.
Methodology and Data
Gap analysis is a technique that can be used to measure the differences between actual and potential retail sales in New Mexico counties. The technique calculates a retail sales gap coefficient (index) that indicates the degree to which a county retail sector captures all local potential sales or loses some potential sales to out-of-county businesses.
First, we calculate the actual and potential retail sales for New Mexico’s counties. Next, we calculate the retail sales gap coefficients for the counties. Finally, we estimate the number of jobs and amounts of personal income and gross receipts taxes that would be gained by closing retail sales gaps. In some counties, actual sales exceed potential sales due to sales to shoppers from outside the county; this generates additional jobs, personal income, and gross receipts taxes beyond what would be expected from sales to county residents only.
County potential retail sales can be estimated using statewide average retail sales per capita, adjusted by the ratio of county to state per capita income:
Psr = Pc × PCSrs × PCIc / PCIs
where Psr is potential retail sales for the county, Pc is the county population, PCSrs is state per capita retail sales, PCIc is county per capita income, and PCIs is state per capita income.
Retail sales gap (RSG) coefficients are derived by dividing actual sales (AS) by potential sales (PS):
RSG coefficient = AS / PS
A coefficient of 1.0 indicates that the county retail sector is capturing all the retail expenditures of county residents, but is not drawing in customers from outside the county. A coefficient greater than 1.0 indicates that the county retail sector is capturing all the retail sales of county residents and is also gaining the purchases of shoppers from outside the county. Finally, a coefficient of less than 1.0 indicates that the county retail sector is not capturing
all the retail purchases of county residents since many are choosing to shop at businesses outside
the county.
It is important to recognize the limitations of the retail sales gap analysis technique and resulting coefficients. For instance, the technique does not account for differences in the socioeconomic characteristics of a county and its surrounding region, other than income, that affect the shopping behavior of consumers. Nor does it account for the possibility of retail sales to out-of-county shoppers occurring at the same time county residents are shopping out of county. Nevertheless, this easily calculated estimate (coefficient) represents a realistic initial estimate of a county’s retail sales gap.
Additionally, retail sales gap analysis only indicates whether potential retail sales are being lost. It does not indicate why the sales are being lost. Retail sales gap analysis is the starting point. The next step is conducting consumer surveys to determine local consumer satisfaction with the prices, variety, quality, and other factors, such as customer service, of available retail products.
Related jobs and personal income data were taken from the 2015 Economic Census Summary Statistics (U.S. Census Bureau; latest available data). County gross receipts tax figures were obtained from the New Mexico Gross Receipts Taxes Schedule, New Mexico Taxation and Revenue Department.
Findings
Retail establishments account for 17% of total businesses, 17% of total paid employees, and 10% of total payroll in non-metropolitan New Mexico counties, compared to 14%, 15%, and 10%, respectively, for metropolitan counties and 15%, 15%, and 10%, respectively, for the state (Table 1). Of the non-metropolitan counties, Harding has the highest percentage of retail establishments (33%) and paid employees (28%). Hidalgo has the highest payroll (23%). Los Alamos has the lowest percentage—9%, 4%, and 1%, respectively (Table 1).
|
Table 1. New Mexico Retail Establishments, Paid Employees, and Annual Payroll, 2015, State and County |
|||
|
Retail establishments as percentage of all establishments |
Retail paid employees as percentage of all paid employees |
Retail annual payroll as percentage of all annual payroll |
|
|
New Mexico |
14.9% |
15.4% |
10.1% |
|
Metro Counties |
14.2% |
15.4% |
10.3% |
|
Bernalillo |
13.0% |
14.0% |
9.2% |
|
Doña Ana |
14.0% |
16.5% |
12.6% |
|
San Juan |
16.1% |
16.1% |
9.2% |
|
Sandoval |
11.3% |
14.0% |
9.8% |
|
Santa Fe |
17.4% |
20.3% |
14.6% |
|
Torrance |
19.5% |
27.2% |
15.5% |
|
Valencia |
16.3% |
22.7% |
20.2% |
|
Non-Metro Counties |
16.8% |
16.5% |
10.2% |
|
Catron |
22.0% |
15.1% |
10.6% |
|
Chaves |
16.2% |
19.4% |
14.1% |
|
Cibola |
20.8% |
17.5% |
12.1% |
|
Colfax |
18.1% |
18.3% |
14.1% |
|
Curry |
17.3% |
19.0% |
15.6% |
|
De Baca |
22.2% |
25.5% |
19.8% |
|
Eddy |
13.3% |
12.8% |
6.9% |
|
Grant |
16.7% |
17.3% |
9.8% |
|
Guadalupe |
18.6% |
21.1% |
18.8% |
|
Harding |
33.3% |
27.8% |
17.7% |
|
Hidalgo |
26.0% |
27.3% |
22.6% |
|
Lea |
12.7% |
12.5% |
7.0% |
|
Lincoln |
19.8% |
23.4% |
21.5% |
|
Los Alamos |
8.9% |
4.2% |
1.3% |
|
Luna |
17.1% |
24.0% |
20.5% |
|
McKinley |
23.1% |
21.9% |
16.5% |
|
Mora |
21.3% |
21.1% |
16.6% |
|
Otero |
18.2% |
21.5% |
17.0% |
|
Quay |
16.8% |
23.0% |
20.5% |
|
Rio Arriba |
15.4% |
17.8% |
13.4% |
|
Roosevelt |
15.8% |
18.9% |
15.3% |
|
San Miguel |
17.6% |
15.0% |
12.9% |
|
Sierra |
18.3% |
19.5% |
15.6% |
|
Socorro |
15.1% |
15.0% |
12.4% |
|
Taos |
19.3% |
17.8% |
15.9% |
|
Union |
20.8% |
14.8% |
11.6% |
The average retail sales gap (the difference between actual and potential retail sales) for non-metropolitan New Mexico counties is 12%; that is, on average, non-metropolitan New Mexico counties are capturing 88 cents of every $1.00 in potential retail sales—they are losing 12 cents of every potential retail dollar to out-of-county businesses (Table 2). The non-metropolitan counties with the largest retail sales gaps are Mora (78%), Harding (73%), Catron (67%) and De Baca (62%) (Table 2).
|
Table 2. Retail Sector Surplus (Deficit), Sales, Jobs, Personal Income, and Gross Receipt Taxes for New Mexico |
|||||
|
RSG coefficient AS/PS |
Retail sales |
Jobs |
Wage income |
Gross receipt taxes |
|
|
Metro Counties |
|||||
|
Bernalillo |
0.99 |
($73,777,999) |
(328) |
($9,179,272) |
($2,713,581) |
|
Doña Ana |
0.77 |
($476,230,941) |
(2,421) |
($55,625,216) |
($20,629,048) |
|
San Juan |
0.44 |
($900,708,334) |
(4,263) |
($110,762,565) |
($32,219,426) |
|
Sandoval |
0.97 |
($46,330,079) |
(224) |
($5,810,915) |
($1,952,616) |
|
Santa Fe |
0.89 |
($250,084,603) |
(1,148) |
($33,035,378) |
($10,452,990) |
|
Torrance |
1.04 |
$5,693,324 |
21 |
$479,391 |
$136,178 |
|
Valencia |
0.75 |
($174,383,684) |
(775) |
($18,803,090) |
($6,308,910) |
|
Non-Metro Counties |
|||||
|
Catron |
0.33 |
($23,105,481) |
(135) |
($2,336,336) |
($625,199) |
|
Chaves |
1.11 |
$81,230,621 |
334 |
$8,386,663 |
$2,814,698 |
|
Cibola |
0.83 |
($37,239,619) |
(182) |
($4,268,604) |
($1,237,289) |
|
Colfax |
0.85 |
($21,594,713) |
(112) |
($2,496,263) |
($846,309) |
|
Curry |
0.73 |
($172,159,679) |
(895) |
($22,777,167) |
($8,129,490) |
|
De Baca |
0.38 |
($14,456,321) |
(103) |
($2,075,985) |
($457,766) |
|
Eddy |
1.11 |
$102,489,111 |
306 |
$8,436,731 |
$4,239,605 |
|
Grant |
0.75 |
($77,879,367) |
(400) |
($8,810,966) |
($3,554,626) |
|
Guadalupe |
1.78 |
$32,222,455 |
87 |
$2,083,121 |
$731,493 |
|
Harding |
0.27 |
($6,752,052) |
(27) |
($360,409) |
($201,302) |
|
Hidalgo |
0.94 |
($2,822,748) |
(15) |
($297,867) |
($56,823) |
|
Lea |
1.31 |
$238,659,709 |
804 |
$22,130,404 |
$10,600,815 |
|
Lincoln |
1.07 |
$17,182,541 |
82 |
$2,070,578 |
$854,650 |
|
Los Alamos |
0.37 |
($222,508,854) |
(922) |
($23,235,049) |
($6,132,664) |
|
Luna |
0.97 |
($7,714,710) |
(37) |
($825,772) |
($255,185) |
|
McKinley |
1.07 |
$38,792,600 |
222 |
$5,147,786 |
$1,601,626 |
|
Mora |
0.22 |
($53,492,424) |
(256) |
($4,711,848) |
($2,155,335) |
|
Otero |
0.72 |
($189,217,445) |
(1,016) |
($23,377,018) |
($7,777,462) |
|
Quay |
1.27 |
$24,657,585 |
94 |
$2,094,643 |
$728,668 |
|
Rio Arriba |
0.61 |
($149,925,482) |
(708) |
($18,649,917) |
($6,643,801) |
|
Roosevelt |
0.86 |
($29,336,390) |
(106) |
($2,644,824) |
($1,047,257) |
|
San Miguel |
0.63 |
($101,565,688) |
(552) |
($11,978,411) |
($4,504,815) |
|
Sierra |
0.71 |
($35,591,744) |
(184) |
($3,827,809) |
($1,526,132) |
|
Socorro |
0.61 |
($67,718,643) |
(292) |
($6,912,208) |
($2,340,119) |
|
Taos |
0.94 |
($20,919,187) |
(100) |
($2,428,221) |
($913,267) |
|
Union |
0.86 |
($6,045,637) |
(23) |
($518,065) |
($179,921) |
Seven non-metropolitan counties have retail sales surpluses, where actual sales are greater than potential sales, indicating that outsiders are shopping in these counties. For instance, Guadalupe County has actual retail sales 1.8 times greater than potential sales; Lea and Quay Counties’ actual retail sales are 1.3 times greater than potential sales (Table 2). One explanation for actual retail sales being greater than potential sales in (Santa Rosa) Guadalupe County and (Tucumcari) Quay County is their location on Interstate 40, which allows them to benefit from sales to in-transit shoppers. Hobbs (Lea County), with a race track, attracts shoppers from bordering communities in Texas.
The total retail sales gap for non-metropolitan New Mexico counties is $704.8 million. Closing the retail sales gap would generate 4,134 jobs, $92.2 million in personal income, and $27.0 million in gross receipts taxes for New Mexico’s non-metropolitan counties (Table 2). Non-metropolitan counties with the most to gain from closing their retail sales gaps are Mora, Harding, Catron, De Baca, and Los Alamos (Table 2).
The distribution of non-metropolitan New Mexico counties by retail sales gaps is shown in Figure 1; 19 counties have retail sales gaps (actual sales are less than potential sales) and seven counties have retail sales surpluses (actual sales are greater than potential sales).
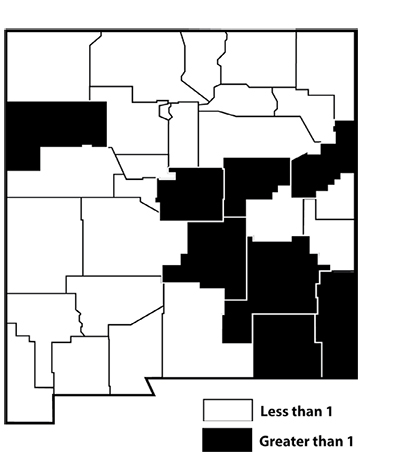
Figure 1. Retail sales gaps (actual sales/potential sales), New Mexico counties, 2015.
Recommendations
Local leaders and businesses in rural (non-metropolitan) New Mexico counties can take actions to close the retail sales gaps in their counties and recapture lost jobs, personal income, and gross receipts taxes. These actions might include establishing a business retention and expansion (BR&E) program to improve the competitiveness of local businesses. Such programs are in widespread use in rural communities across the country and internationally.
The objectives of a BR&E program are to demonstrate community support for local business, provide expertise and assistance to meet the immediate challenges local businesses face, and increase their competitiveness and contribution to the long-term economic development of the community/county.
BR&E program activities include:
- Visits to businesses to pinpoint needs, concerns, and development plans.
- Organized responses to the needs and concerns expressed by the businesses.
- Formulation of strategies for improving the local business climate.
- Partnerships for increasing the competitiveness of local businesses.
- Consumer surveys to determine consumer preferences and satisfaction with locally available retail products.
BR&E programs:
- Improve citizen understanding of the local economy and the important role local businesses play in providing jobs and income, increasing the local tax base, contributing to the social fabric of their communities through participation in leadership roles in civic organizations and by serving on boards and as elected officials, and providing in-kind and cash contributions to civic and charitable organizations.
- Identify concerns of local businesses.
- Set priorities and mobilize resources to meet local business needs and concerns.
- Increase the competitiveness of local businesses.
- Increase consumer satisfaction and “shopping at home,” and reduce “shopping away from home.”
- Sustain and grow communities and improve quality of life for their residents.
Successful BR&E programs are built on a foundation of effective public/private partnerships involving local business organizations (e.g., chamber of commerce or merchants’ associations), local government (e.g., community or county economic development organizations or offices), and business management education and training professionals (e.g., the Cooperative Extension Service or Small Business Development Center).
This circular demonstrates that, by closing retail sales gaps, many New Mexico counties can increase the number of jobs and increase personal income and gross receipts taxes in their counties. The recaptured retail sales dollars circulate like new dollars coming into the county, creating even greater economic benefits through the multiplier effect from successive rounds of local spending. For instance, a county experiencing a $1-million loss in retail sales because local residents are spending 70% of their retail dollars outside the county may be able to recapture those lost retail expenditures through a BR&E or similar program, generating an overall benefit to the county of close to $3 million, once the multiplier effects in the area economy are taken into account. (See the Notes section for an explanation of the multiplier effect.)
For more information and assistance in developing a BR&E program for your community or county, contact your county Extension office (https://aces.nmsu.edu/county/).
Notes
Where consumers spend their dollars will have a direct impact on the number of jobs and on personal income and tax receipts in a community. If consumers spend their retail dollars in the community, the dollars circulate through multiple rounds of spending (i.e., consumer dollars spent on goods and services become income for business owners, their employees, and suppliers, who in turn spend it on goods and services, and so on), creating more jobs, personal income, and tax receipts for the community. If they spend their retail dollars outside the community, fewer dollars circulate, fewer jobs are created, and smaller amounts of personal income and tax receipts are received.
Economists have developed a technique called a spending multiplier that can be used to estimate the economic impact of consumer spending on jobs, income, and tax receipts in a community. For instance, the following formula is for a spending multiplier that can be used to estimate the impact of initial consumer spending on total spending in the community:
Spending multiplier = 1 / (1 − (x))
where x is the percentage of consumer spending done in the community.
The higher the percentage of consumer spending in the community, the larger the multiplier. The lower the percentage of consumer spending in the community, the smaller the multiplier. For instance, if consumers spend 80% of their income in the community, the multiplier is 5.0 (1 / [1 − 0.8]). However, if consumers spend only 20% of their income in the community, the multiplier is 1.25 (1 / [1 − 0.20]). If initial consumer spending is $1 million, with a multiplier of 5, the total impact in the community is $5 million in consumer spending. However, with a multiplier of 1.25, the total impact in the community is $1.25 million, nearly 40% less.
For a more comprehensive discussion of multipliers and their application, consult the following resources:
Miller, W.P. 1999. Economic multipliers: How communities can use them for planning. Little Rock: University of Arkansas, Cooperative
Extension Service.
Shaffer, R., S. Deller, and D. Marcoullier. 2004. Community economics: Linking theory and practice, 2nd ed. Ames, IA: Blackwell Publishing.
For further reading
CR-643: Tools for Understanding Economic Change in Communities
https://pubs.nmsu.edu/_circulars/CR643/
CR-651: Rural New Mexico Economic Conditions and Trends
https://pubs.nmsu.edu/_circulars/CR651/
Z-108: Income Multipliers in Economic Impact Analysis
https://pubs.nmsu.edu/_z/Z108/

J. Michael Patrick is an Associate Professor and Extension Community Resource and Economic Development Specialist in the Department of Agricultural Economics and Agricultural Business. He earned his Ph.D. at Michigan State University. His research and Extension efforts include entrepreneurship, rural development, and the economic development of Native American communities.
To find more resources for your business, home, or family, visit the College of Agricultural, Consumer and Environmental Sciences on the World Wide Web at pubs.nmsu.edu
Contents of publications may be freely reproduced for educational purposes. All other rights reserved. For permission to use publications for other purposes, contact"pubs@nmsu.edu"or the authors listed on the publication.
New Mexico State University is an equal opportunity/affirmative action employer and educator. NMSU and the U.S. Department of Agriculture cooperating.
Revised August, 2019 Las Cruces, NM