Guide B-409
Marcy Ward and Victor Flores
College of Agriculture, Consumer and Environmental Sciences, New Mexico State University. (Print Friendly PDF)
Authors: Respectively, Extension Livestock Specialist and PhD candidate, both from Department of Animal and Range Sciences, New Mexico State University.
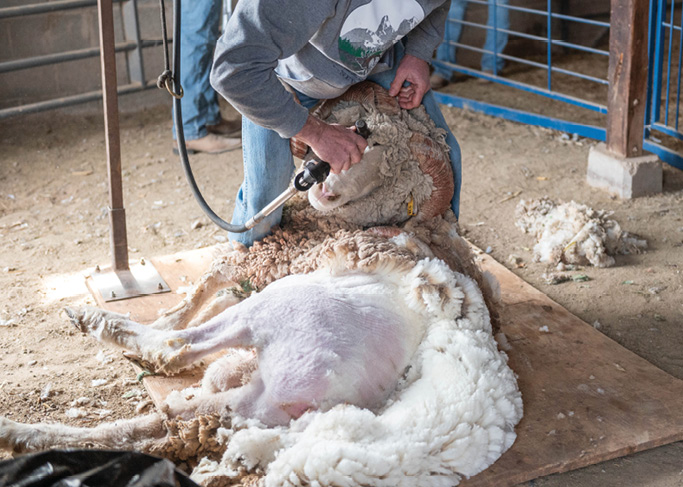
Photo by Josh Bachman. NMSU, 2024.
Introduction
Wool can represent up to 20% of a sheep producer’s annual total income; therefore, it is important to understand how fleece quality and grading can influence the price of wool. The potential range of end products that wool may be used for is dictated by many qualities, including fineness, clean wool yield, length, color, and uniformity. Consequently, these qualities determine the value of the raw product. Fineness, or grade, is of primary importance in determining market value of raw wool. Finer (smaller diameter) wools usually are associated with more expensive, lighter weight fabrics, while coarser-fibered wools (larger diameter) usually are used in bulkier sweaters, blankets, and carpets.
Fineness and Grading
Wool fineness refers only to the diameter of the individual wool fibers. When wool is graded (fineness determined), the entire fleece is given a grade that represents the average fineness and is placed into grade lines with fleeces of similar fiber diameter. Grading should not be confused with wool classing; sorting fleeces into various lines according to fineness, length, strength, yield, color, and style.
The three systems of wool grading used in the United States are: American Blood Grade System, Spinning Count System, and Micron System. All three systems are used interchangeably, but the latter is the system used internationally and preferred by wool buyers and manufacturers (Table 1).
Understanding the Numbers and Terms
The American Blood Grade System
This system was developed in the early 1800s and originally represented the amount of fine-wool Merino genetics (Spanish origin) present in the native coarse-wool sheep. The wool grade was simply defined as a percentage of Merino genetics. The first cross was expressed as 1/2 blood; the same applied for 3/8 blood and 1/4 blood. The American Blood Grade System no longer refers to breeding background but represents a broad description of fiber diameter. Grades of wool described by the American Blood Grade System are Fine, 1/2 Blood, 3/8 Blood, 1/4 Blood, Low 1/4 Blood, Common, and Braid (Figure 1).
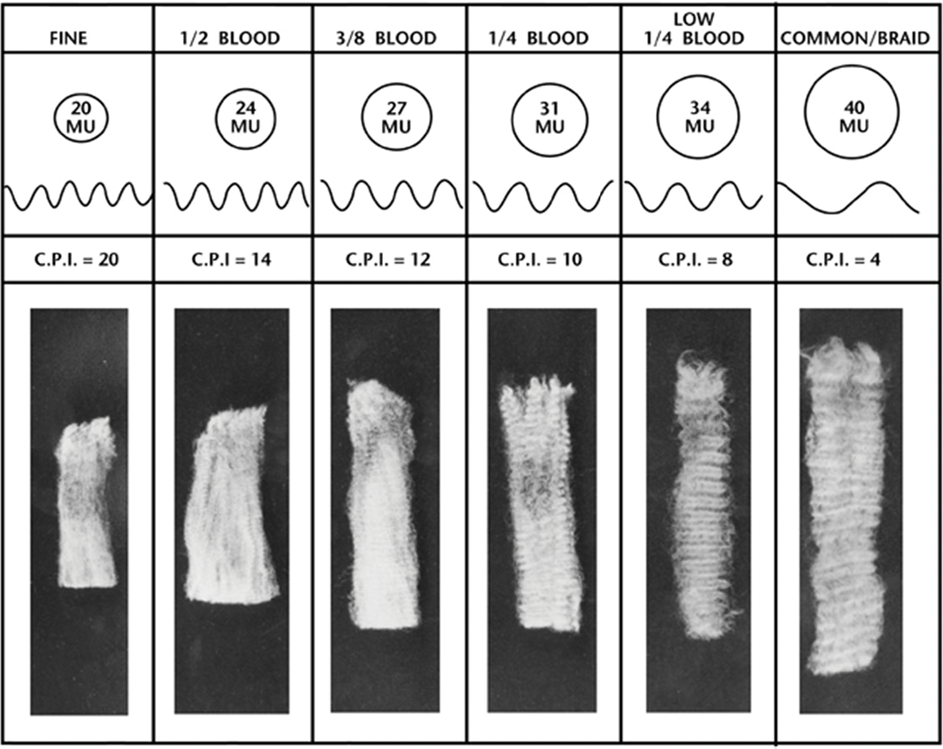
Figure 1. Grades of wool described by the American Blood Grade System (C.P.I = Crimps per inch; MU = micron units).
The Spinning Count System
Spinning count is a more technical classification of wool fineness than the American Blood Grade System and identifies wool within a narrower range of fiber diameter (Table 1). For example, wool that grades 80s, 70s, or 64s in the Spinning Count System would fall within the broader Fine category in the American Blood Grade System. The “spinning count” is based on the number of “hanks” of yarn that can be spun from one pound of clean wool. Finer wools have more individual fibers per unit of weight. Consequently, more hanks of yarn can be spun from fine wool than coarse wool. A hank is equal to 560 yards. One pound of clean, Fine, 80s spinning count wool spun to its maximum would result in 80 hanks of yarn, or 44,800 yards (80 hanks × 560 yards). One pound of clean, Low 1/4 Blood, 46s spinning count wool would yield only 25,760 yards (46 hanks × 560 yards).
|
Table 1. Specifications for wool grades. |
|||
|---|---|---|---|
|
American Blood Grade |
Spinning Count |
Range for Average Fiber Diameter (Microns;µm) |
Maximum Standard Deviation |
|
Fine |
Finer than 80s 80s 70s 64s |
Under 17.70 17.70-19.14 9.15-20.59 20.60-22.04 |
3.59 4.09 4.59 5.19 |
|
1/2 Blood |
62s 60s |
22.05-23.49 23.50-24.94 |
5.89 6.49 |
|
3/8 Blood |
58s 56s |
24.95-26.39 26.40-27.84 |
7.09 7.59 |
|
1/4 Blood |
54s 50s |
27.85-29.29 29.30-30.99 |
8.19 8.69 |
|
Low 1/4 Blood |
48s 46s |
31.00-32.69 32.70-34.39 |
9.09 9.59 |
|
Common |
44s 40s |
34.40-36.19 36.20-38.09 |
10.09 10.69 |
|
Braid |
36s Coarser than 36s |
38.10-40.20 More than 40.20 |
11.19 |
The Micron System
This system is a much more precise and descriptive method of measuring average fiber diameter. Individual fiber diameters are measured in microns (1/25,400 of an inch). Traditionally, the standard method of measuring these fibers is by a micro projection technique in which short longitudinal sections of the fibers are projected onto a screen at 500-fold magnification. As the wool gets coarser, it becomes necessary to measure significantly more fibers to ensure a high degree of accuracy. Wool that grades in the 62s spinning count requires about 3,000 fiber measurements, while 50s spinning count wool requires taking more than 6,000 fiber measurements to ensure acceptable accuracy. A competent technician could measure only about 600 fibers per hour. Technological advancements have greatly improved the efficiency and accuracy of fiber diameter measurement. Electro-optical and image analysis machines are much faster and have the capability of measuring 2,000-4000 fibers, calculating an average, standard deviation and a coefficient of variation, and printing this information with a histogram in less than three minutes (Figure 2).
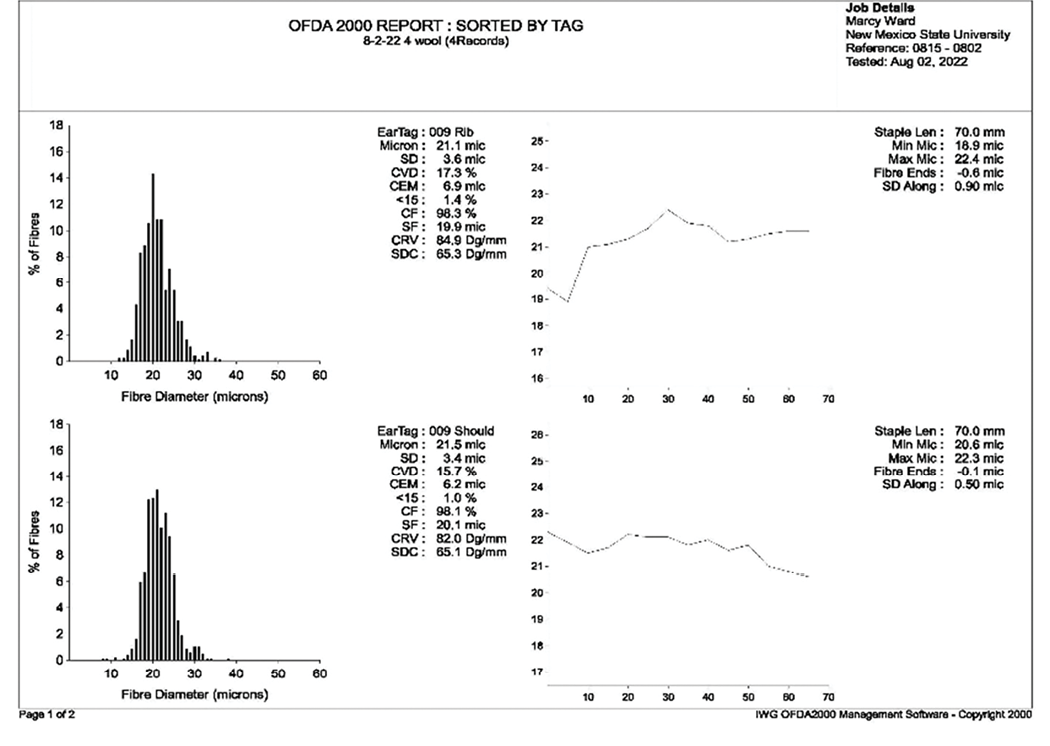
Figure 2. OFDA 2000 Report of side and shoulder sample measurements of Ram 009, including fiber diameter, staple length and variation within the sample.
Wool Analysis
The first step in grading wool can be done by visual appraisal. Knowing key characteristics can help with wool sorting. In order to get specific measurements, however, equipment is now used to fully assess and quantify wool quality.
The Optical Fiber Diameter Analyzer 4000 (OFDA4000) is the latest technology that analyzes 2 mm snippets of an original scoured sample. This machine has the capacity to measure fiber diameter, length, hauteur (average length), and variation (barbe) within a sample, simplifying the analysis process down to a single piece of equipment. These fibers are spread automatically onto a glass slide and loaded into the OFDA. New OFDAs can measure 4,000 fibers in about 30 seconds. Many certified wool labs utilize this technology. The American Sheep Industry Association provides a list of labs that provide this service (https://www.sheepusa.org/contacts-woolpelt-researchtesting). Reports provide a comprehensive breakdown of wool sample characteristics (Figure 2).
There is also a portable option that can quickly analyze wool quality on site; measuring grease wool and diameter profile along with staple length. For larger operations, this piece of equipment will analyze about 800 samples in 8 hours, improving sorting efficiency and marketability of the fleeces. This equipment, however, is quite expensive and would have to be justified based on production volume. And as with any technology, repairs and upgrades could be frequent and require special training. It should also be noted that at the farm, the equipment would only be analyzing raw unclean wool. This could impact the quality of the analysis.
Figure 2 is an example of wool analysis from one ram, utilizing an OFDA 2000 machine. The capacity of this technology allows for 2000 fibers to be analyzed in less than a minute. Samples were taken from separate parts of each fleece to demonstrate variation that can be seen within a fleece. It is recommended that samples be taken from the shoulder. This region typically has the cleanest wool and is of the greatest quality on the fleece.
When multiple samples are sent, a table comparison is provided to fully evaluate the differences between fleeces (Table 2).
Based on this report, Ram 009 had finer (lower micron fiber diameter), longer staple length (SL), and less variation across the fleece (CV). Both rams, however, produce high quality fleeces of fine wool with high comfort factor (CF) and good spin count (SDC). The comfort factor value is based on the percentage of the sample fibers that are less than 30 microns in diameter, which can then be correlated to the feel of the fabric.
|
Table 2. Wool analysis of to sample locations from two mature Rambouillet rams. |
||||||||||||||
|---|---|---|---|---|---|---|---|---|---|---|---|---|---|---|
|
OFDA 2000 Report: Sorted by Tag |
||||||||||||||
|
Animal Eartag |
Mic Ave |
SD Mic |
CV Mic |
CEM |
<15% |
CF% |
SF Mic |
SL mm |
Min Mic |
Max Mic |
Fibre Ends |
SD Along |
CRV Dg/mm |
SDC Dg/mm |
|
Averages |
22.1 |
3.8 |
17.0 |
7.2 |
0.9 |
96.9 |
20.8 |
61.3 |
20.6 |
23.4 |
0.85 |
84.2 |
64.4 |
|
|
009 Rib |
21.1 |
3.6 |
17.3 |
6.9 |
1.4 |
98.3 |
19.9 |
70.0 |
18.9 |
22.4 |
-0.6 |
0.90 |
84.9 |
65.3 |
|
009 |
21.5 |
3.4 |
15.7 |
6.2 |
1.0 |
98.1 |
20.1 |
70.0 |
20.6 |
22.3 |
-0.1 |
0.50 |
82.0 |
65.1 |
|
818 Rib |
22.9 |
4.0 |
17.5 |
7.6 |
0.9 |
96.0 |
21.7 |
50.0 |
21.6 |
24.8 |
-0.5 |
1.20 |
87.5 |
67.1 |
|
818 |
22.9 |
4.0 |
17.5 |
8.0 |
0.3 |
95.1 |
21.6 |
55.0 |
21.4 |
24.3 |
-1.1 |
0.80 |
82.4 |
60.0 |
Fleece Anatomy
To gain maximum value of a fleece and reduce variation, it is important to know where the best wool is generally found on a fleece, compared to the poorest. Producers can then sort their fleeces to optimize the price. Figure 3 depicts the location of the various parts of the fleece. The color codes reflect locations of best (green) to worst (red) regions of quality within a fleece.
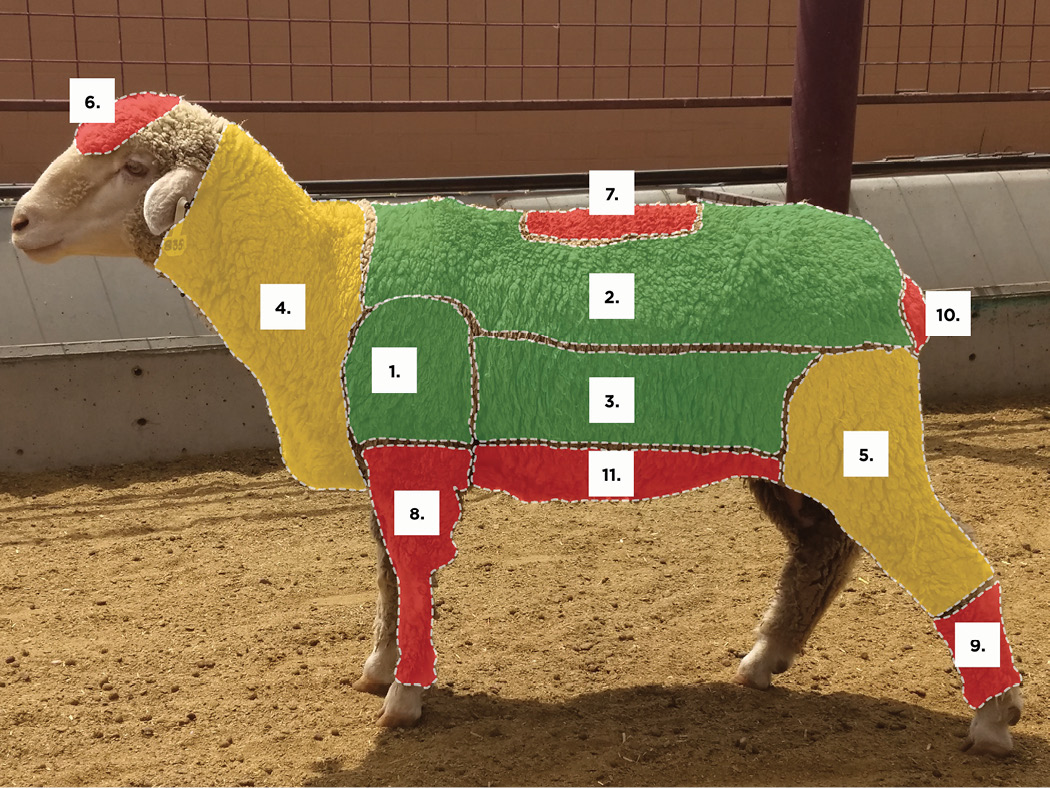
Figure 3. Fleece Anatomy.
GREEN = Where you will find the portions of the fleece that best represent overall quality.
- Shoulder wool: Best wool. Can set the standard for the rest of the fleece.
- Fleece wool: Contains good to average source of wool, with the least amount of contaminants.
- Side wool: Similar quality as shoulder but heavier in condition.
YELLOW = Lower quality that tends to be coarser and more inconsistent. Increased areas of contamination are also possible.
- Neck wool: Longer stapled (dependent on breed), coarser than shoulder, fleece, or side wool.
- Britch wool: Shorter staple, more brittle (kempy), and coarser. Can have high amount of contaminants.
RED = The most inconsistent portion of the fleece that can contain high amounts of hair, contaminants, or stains. Since this typically represents a small portion of the fleece, by weight, it should be sorted to the side. These fibers can still be used, however, for lower grade products such as rugs.
- Top knot: Very short and dirty. Offers no value to the overall fleece.
- Back wool: Receives the most weather stress and tends to be open and pungent.
- Arm piece: This wool is very short and has very short, open fiber edges. Often heavy with contaminants.
- Hairy shanks: High percentage of hair or kempy fibers containing very little wool. They are used to manufacture low quality goods such as rugs.
- Stained wool: This wool will likely not wash to desired white condition. Consider discarding this portion of the fleece.
- Belly wool: This is a bulky wool, heavy in condition, and usually very high in contaminants.
Distribution of Fiber Diameter
Individual fibers vary in diameter within any fleece. The britch (Figure 3) typically is coarser than the rest of the fleece, even in fine-wool breeds selected for uniformity. In crossbreds and sheep of coarser wool breeds, it is common to find fibers representing 4-5 different spinning counts within the same fleece. Because of the variation within individual fleeces, it may be economical to sort wool into uniform lots prior to selling. Sorting reduces variation and consequently optimizes marketing potential.
It is to the manufacturers’ advantage to know how much grade variation exists in any given lot of wool before determining its fair market value. The amount of grade variation is expressed as either the “standard deviation” or “coefficient of variation”. Most micron test reports include this information (Figure 2). Highly variable wool will have a larger standard deviation.
The American Society for Testing Materials has established variability limits for wool fineness (Figure 2; bar graphs on the left). If a wool sample is more variable or has a higher standard deviation than the one allowed for that grade, the grade is then lowered one spinning count. This is due to the fact that there are likely more coarse fibers, thus a lower CF, which would result in grading into the next courser spin count.
The “coefficient of variation” is another useful measurement of fiber diameter variability. The coefficient of variation is the fraction or percentage that the standard deviation is of the average. This statistic is most useful in comparing the variation of unrelated groups, such as coarse wool variation versus fine wool variation. A standard of uniformity based on coefficient of variation has been developed for wool (Table 3).
|
Table 3. Uniformity of wools as expressed by a coefficient of variation. |
|
|---|---|
|
Coefficient of Variation |
Standard of Uniformity |
|
Less than 21% |
Excellent |
|
21% to 27% |
Average |
|
Over 27% |
Poor |
Breeding for Wool Quality
Wool quality is moderately to highly heritable, depending on the fiber characteristic,1 and is strongly correlated to breed.
The range of average diameters for the major sheep breeds is listed in Table 4. These are commonly accepted ranges. However, it is possible to find individuals within each breed that produce wool measuring outside of these ranges. You will note, the coarser the fleece classification, the more variation you will find within breed.
|
Table 4. Common ranges of fiber diameter, grease fleece weight, and clean wool yield for various sheep breeds. |
|||
|---|---|---|---|
|
Breed |
Range of Fiber Diameter (µm) |
Range of Greece Fleece Weight (lbs) |
Range of Clean Wool Yield (%) |
|
Fine |
<22 |
6-12 |
50-70 |
|
Merino |
<18 |
6-9 |
60-70 |
|
Merino (Fine) |
19-20 |
6-11 |
60-70 |
|
Merino |
21-22 |
9-13 |
65--75 |
|
Delaine-Merino |
17-22 |
9-14 |
45-55 |
|
Rambouillet |
19-23 |
9-14 |
45-60 |
|
Moderate |
23-30 |
5-10 |
45-60 |
|
Columbia |
23-30 |
9-14 |
45-60 |
|
Southdown |
24-29 |
5-8 |
40-55 |
|
Corriedale |
24-31 |
9-14 |
45-60 |
|
Dorset |
26-32 |
5-8 |
50-65 |
|
Coarse |
31< |
7-12 |
50-70 |
|
Lincoln |
34-41 |
10-14 |
55-70 |
|
Hampshire |
26-33 |
6-10 |
50-60 |
|
Suffolk |
26-33 |
6-10 |
50-60 |
|
Navajo Churro* |
22-47 |
4-8 |
60-65 |
|
* Navajo Churro have a fine undercoat and a coarse outercoat. This results in the wide range of fineness within a single fleece. (Sheep Production Handbook, 2015.) |
|||
Conclusion
Grade of fiber diameter and diameter variation are of primary importance in determining wool value. As the textile industry continues to modernize its carding, combing, spinning, and weaving equipment with high-speed, state-of-the-art technology, grade and uniformity of the raw product become even more important. A higher percentage of wool will be purchased based on objective measurements. Consequently, producers must become more knowledgeable about the use of objective measurements. Regular and consistent testing (sampling from the same location) of the fleeces of your replacement animals will help track progress in wool quality across the herd.
References
- Whaley, J. (2024, February). Economically Relevant Wool Traits and Wool Heritability. South Dakota State University Extension. https://extension.sdstate.edu/economically-relevant-wool-traits-and-wool-heritability
For Further Reading
LaValley, S.B. (2004). Grades and Lengths of Grease Wool [Fact Sheet No. 1.401] Colorado State University Extension https://jeffco.extension.colostate.edu/docs/pubs/livestk/01401.pdf
Original author: James M. Sachse, Extension Sheep Specialist. Subsequently revised by Clay P. Mathis, Extension Livestock Specialist and Brian Faris, Graduate Student, Department of Animal and Range Science.

Marcy Ward is the Extension Livestock Specialist at NMSU. She received her B.S. and M.S. in animal science from Colorado State University and NMSU, respectively, and her Ph.D. in ruminant nutrition from North Dakota State University. She was most recently the Beef Program Director at Colby Community College in Colby, KS.
To find more resources for your business, home, or family, visit the College of Agricultural, Consumer and Environmental Sciences on the World Wide Web at pubs.nmsu.edu.
Contents of publications may be freely reproduced for educational purposes. All other rights reserved. For permission to use publications for other purposes, contact pubs@nmsu.edu or the authors listed on the publication.
New Mexico State University is an equal opportunity employer and educator. NMSU and the U.S. Department of Agriculture cooperating.
Revised December 2025, Las Cruces, NM